


Report Overview
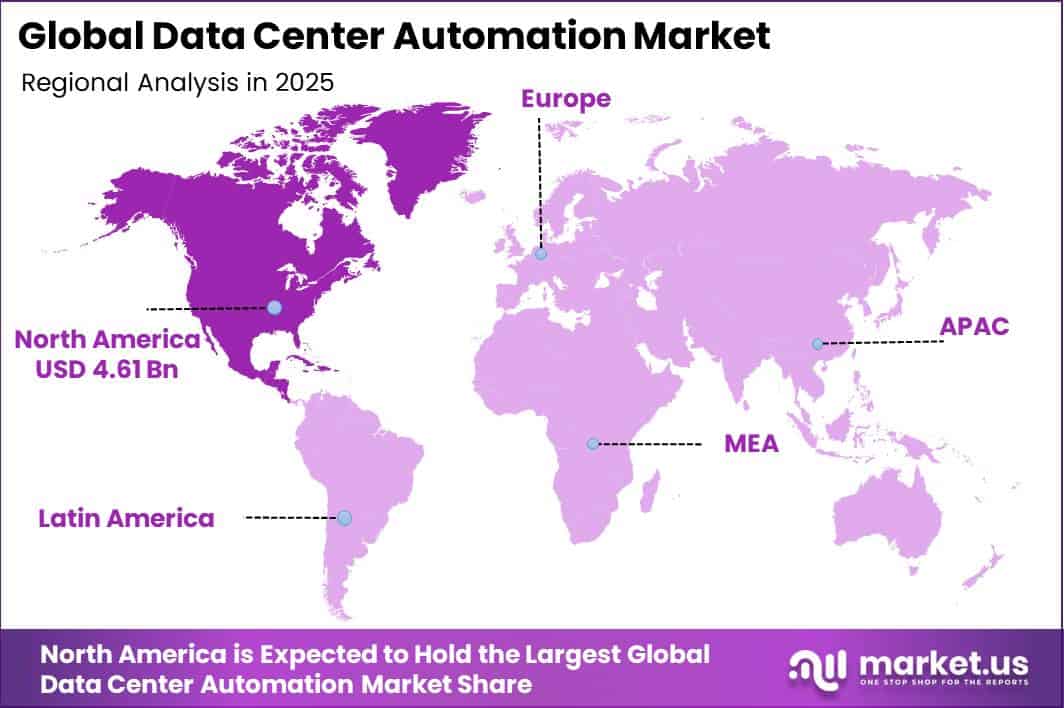
In 2025, the Global Data Center Automation Market was valued at USD 11.9 billion. The market is projected to grow at a CAGR of 14.2% during 2026–2035, reaching approximately USD 44.8 billion by 2035. North America dominated the global market in 2025, accounting for more than 38.7% of the total market share and generating approximately USD 4.6 billion in revenue.
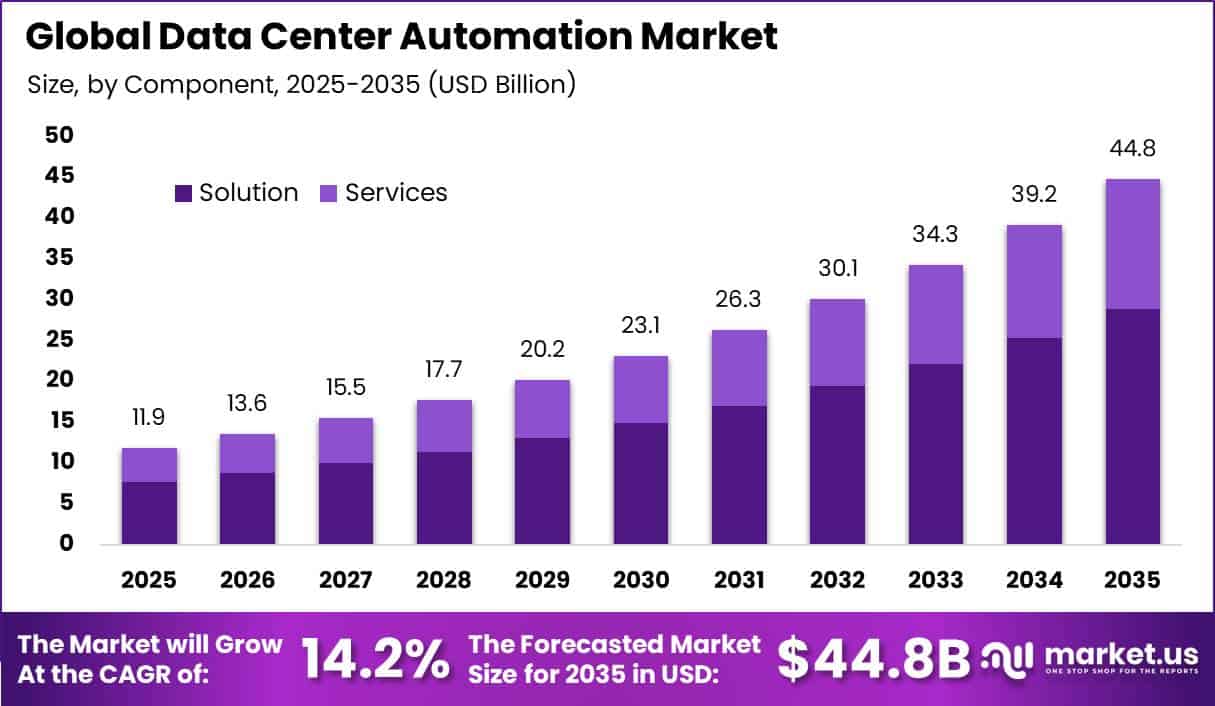
Market growth is being supported by rising data-center electricity use, AI workloads, cloud adoption, and the need to manage large facilities with fewer manual errors. The U.S. Department of Energy, through Lawrence Berkeley National Laboratory, reported that U.S. data centers consumed 176 TWh of electricity in 2023, representing 4.4% of total national electricity use.
Consumption could increase to 325–580 TWh by 2028, equal to around 6.7%–12.0% of U.S. electricity demand. U.S. data-center electricity demand alone could rise by 149–404 TWh between 2023 and 2028, increasing the need for automated monitoring, cooling control, predictive maintenance, workload management, and faster fault detection.
Globally, data-center electricity demand increased by 17% in 2025, while electricity use from AI-focused facilities rose by 50%. Total global data-center electricity consumption is projected to increase from 485 TWh in 2025 to about 950 TWh by 2030, strengthening long-term demand for intelligent automation and control solutions through 2035.
Key Takeaway
- The Data Center Automation Market was valued at USD 11.9 billion in 2025 and is projected to reach USD 44.8 billion by 2035 at a 14.2% CAGR.
- The Solution segment was led by Component, with a 64.5% share in 2025.
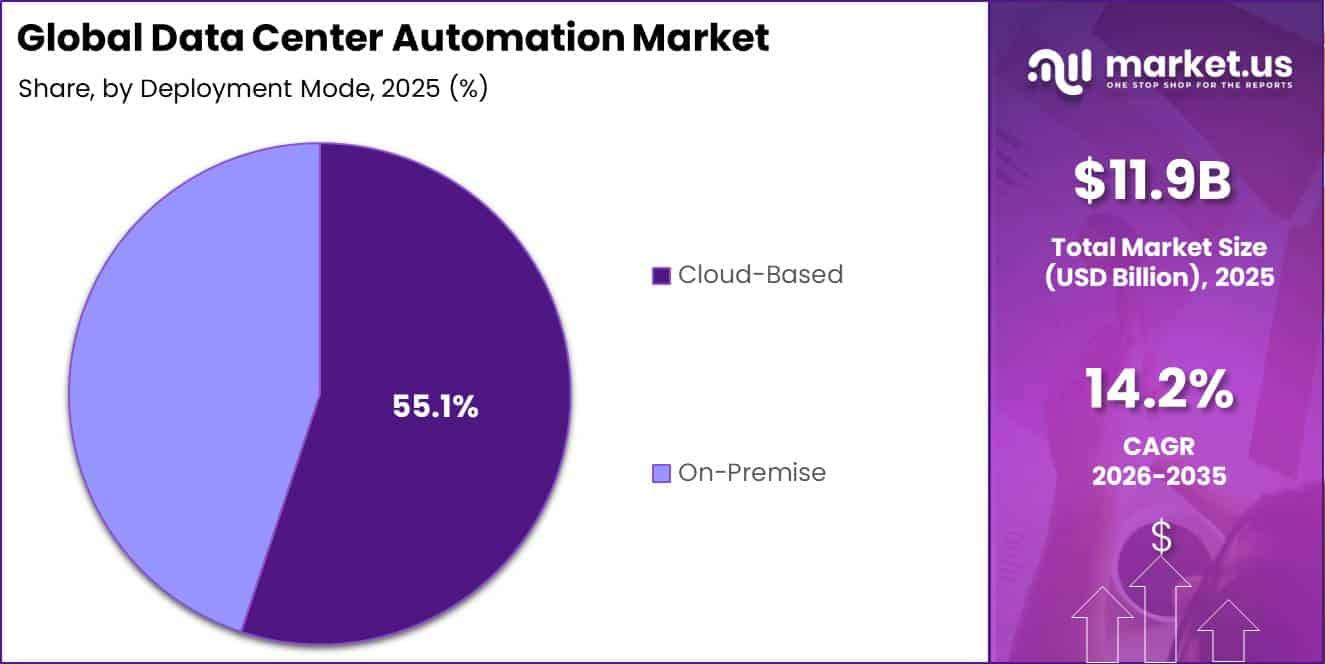
- The Cloud-Based segment was led by Deployment Mode with a 55.1% share in 2025.
- Large Enterprises accounted for 67.3% of the market in 2025.
- IT and Telecommunications led By Industry Vertical with a 24.8% share in 2025.
- North America led the market with a 38.7% share and USD 4.6 billion in revenue in 2025.
Market Statistics and Data Insights
- Global data-center electricity consumption increased by about 17% in 2025, representing an increase of roughly 70 TWh. Electricity consumption from AI-focused data centers increased even faster, by around 50% during the year. This directly supports automation for workload scheduling, cooling, power management, and capacity optimization.
- U.S. data-center electricity consumption increased from only 58 TWh in 2014 to 176 TWh in 2023. DOE also reports that individual large-load sites are now requesting electrical capacity of up to 4.5 GW, highlighting the need for automated power control and grid-interactive operating systems.
- Uptime Institute’s 2025 Global Data Center Survey collected responses from more than 800 data-center owners and operators. It found that 45% of IT workloads remained in corporate facilities, while nearly two-thirds of operators reported difficulty retaining staff, finding qualified candidates, or both.
- Uptime’s 2026 outage analysis found that 57% of respondents said their most recent major outage cost more than USD 100,000, while 1 in 5 said their latest impactful outage cost more than USD 1 million. These losses strengthen the business case for automated fault detection and predictive maintenance.
- In the EU, 52.7% of enterprises purchased cloud-computing services in 2025, increasing by 7.4 percentage points from 45.2% in 2023. Among large enterprises, cloud adoption reached 84.7%, supporting demand for centralized hybrid-cloud and data-center automation.
- Among EU businesses buying cloud services in 2025, 85.2% used cloud email, 71.7% used cloud office software, and 71.5% used cloud file storage. Security software was purchased through the cloud by 65.5% of these enterprises.
- ITU estimates that approximately 6 billion people, or 74% of the global population, were using the internet in 2025. This represents around 1.3 billion more users than in 2020, when penetration stood at 60%.
By Component
In 2025, the Solution component segment held a dominant position in the Data Center Automation Market, capturing a 64.5% share. This leadership is supported by the rapid expansion of global data-center infrastructure and the growing need for software-based automation. World Bank data shows that the number of hyperscale data centers more than tripled since 2015, reaching 900 facilities in 2023 and accounting for 37% of worldwide data-center capacity.
This share is expected to exceed 50% by 2028. The United States operated around 5,375 data centers in 2023, followed by Germany with 522, the UK with 517, and China with 448. As hyperscale capacity is expected to nearly triple by 2028, operators increasingly depend on automation solutions for workload management, capacity planning, energy optimization, monitoring, and remote fault correction across large facilities.
By Deployment Mode
In 2025, the Cloud-Based deployment segment held a dominant position in the Data Center Automation Market, capturing a 55.1% share. This leadership is supported by the growing use of cloud platforms for business applications, data storage, and computing workloads. Eurostat reported that 52.7% of EU enterprises used paid cloud services in 2025, increasing by 7.4 percentage points from 45.2% in 2023.
Cloud adoption was even stronger among large enterprises, reaching 66.8%. In addition, the OECD reported that an average of 49% of businesses with 10 or more employees across member countries used cloud computing. This expanding cloud environment increases demand for centralized automation tools that can manage workloads, provision virtual servers, monitor capacity, apply security policies, and respond to system issues across multiple locations.
By Organization Size
In 2025, the Large Enterprises segment held a dominant position in the Data Center Automation Market, capturing a 67.3% share. This leadership is supported by the complex digital infrastructure managed by large organizations across private data centers, public clouds, branch locations, and critical business systems.
Eurostat reported that 84.7% of large EU enterprises used paid cloud computing services in 2025, compared with 52.7% across all enterprises. It also found that 55.0% of large enterprises used AI technologies, versus 20.0% across the overall enterprise base. These large digital environments generate heavy workloads, data traffic, virtual machines, and security events, making manual management less practical.
By Industry Vertical
In 2025, the IT and Telecommunications segment held a dominant position in the Data Center Automation Market, capturing a 24.8% share. This leadership is supported by the sector’s role in managing the infrastructure behind internet, cloud, mobile, and enterprise connectivity.
According to the International Telecommunication Union, around 5.5 billion people, or 68% of the global population, used the internet in 2024, representing an increase of 227 million users in one year. At the same time, more than 50% of the world’s population was covered by 5G networks, while 5G subscriptions accounted for over one-third of mobile-broadband subscriptions.
Key Market Segments
By Component
- Solution
- Services
By Deployment Mode
- Cloud-Based
- On-Premise
By Organization Size
- Small and Medium-Sized Enterprises
- Large Enterprises
By Industry Vertical
- IT and Telecommunications
- BFSI
- Retail
- Healthcare
- Manufacturing
- Government
- Other
Geopolitical Impact Analysis
Geopolitical tensions are increasing hardware costs and creating longer and less predictable delivery times across the Data Center Automation Market. Automation systems depend on servers, network switches, processors, sensors, programmable controllers, and power-management equipment, making the market sensitive to trade restrictions and supply-chain disruptions.
U.S.–China trade measures remain an important concern, as the U.S. maintains a 50% Section 301 tariff on selected semiconductor imports from China, including integrated circuits, diodes, transistors, and other electronic components. These parts are widely used in automation servers, edge gateways, intelligent power systems, and network-control equipment.
However, supplier diversification can also increase qualification, inventory, and system-integration expenses. Shipping disruption creates additional pressure. During the severe Red Sea disruption, Suez Canal transits were reported to be 42% below their peak, while weekly container-ship transits declined by 67%, forcing many vessels to use longer routes around the Cape of Good Hope.
This can delay deliveries of racks, cooling controls, cables, and replacement components. Energy-price uncertainty also affects data-center operating budgets. The World Bank projected its energy-price index to decline by 12% in 2025 and another 10% in 2026, while warning that geopolitical conflict and stronger natural-gas demand could push prices higher.
Regional Analysis
North America dominated the Data Center Automation Market, capturing a 38.7% share and generating approximately USD 4.61 billion in revenue. The region benefits from a mature digital economy, strong cloud infrastructure, and a high concentration of enterprise IT, telecom, software, and hyperscale data centers.
According to the U.S. Bureau of Economic Analysis, the U.S. digital economy contributed USD 2.6 trillion in value added in 2022, representing 10.0% of national GDP. Cloud services were the fastest-growing digital activity, expanding by 232.1% between 2017 and 2022, equal to an average annual growth of 27.2%.
Canada also supports regional demand, with 81 federal departments and agencies adopting the Shared Services Canada cloud procurement model by 2022–23. These large digital environments increase demand for automated provisioning, workload management, security controls, and real-time infrastructure monitoring.
Asia Pacific is expected to be the fastest-growing region. The ITU reported that 66% of the regional population was online in 2024, while mobile broadband subscriptions reached 97 per 100 inhabitants. Monthly mobile broadband traffic increased from 7 GB per subscription in 2019 to 15 GB in 2024, while fixed-broadband traffic rose from 117 GB to 271 GB.
Key Regions and Countries
North America
- US
- Canada
Europe
- Germany
- France
- The UK
- Spain
- Italy
- Rest of Europe
Asia Pacific
- China
- Japan
- South Korea
- India
- Australia
- Rest of APAC
Latin America
- Brazil
- Mexico
- Rest of Latin America
Middle East & Africa
- GCC
- South Africa
- Rest of MEA
Market Dynamics
Drivers
| Driver | (~) % CAGR | Geographic Relevance | Impact Timeline |
|---|---|---|---|
| AI workload orchestration | +2.4% | Global | Short term (2 years or less) |
| Hybrid infrastructure control | +1.8% | North America and Europe | Medium term (2 to 4 years) |
| Network automation adoption | +1.5% | Global | Short term (2 years or less) |
| Outage prevention spending | +1.3% | Global | Short term (2 years or less) |
| Cloud-native operations | +1.1% | North America and Asia Pacific | Medium term (2 to 4 years) |
AI workload orchestration
AI adoption is changing data-center operations from fixed-capacity management to continuous workload scheduling across servers, storage, networks, power, and cooling systems. The IEA reported that data-center electricity demand increased by 17% in 2025, while AI-focused facilities recorded a 50% rise.
Cisco reported USD 2.1 billion in AI-infrastructure orders from hyperscale customers in Q2 FY2026, while Broadcom had licensed more than 100 million VMware Cloud Foundation cores by 2025. Rising AI infrastructure spending could support an estimated 2.4% incremental CAGR contribution for data-center automation.
Restraints
| Restraint | (~) % CAGR | Geographic Relevance | Impact Timeline |
|---|---|---|---|
| Grid connection constraints | -2.1% | North America and Europe | Medium term (2 to 4 years) |
| High implementation costs | -1.4% | Global | Short term (2 years or less) |
| Data sovereignty rules | -1.2% | Europe and Asia Pacific | Medium term (2 to 4 years) |
| Legacy system lock-in | -1.0% | Global | Medium term (2 to 4 years) |
| Capital budget deferrals | -0.8% | Emerging markets | Short term (2 years or less) |
Grid connection constraints
Electricity-grid availability is becoming a key constraint on new data-center construction and related automation spending. The IEA reported that data centers consumed about 415 TWh, or 1.5% of global electricity, in 2024, with demand expected to reach around 945 TWh by 2030.
Limited grid connections and transmission capacity can delay facility openings and postpone purchases of servers, cooling systems, networking equipment, and automation solutions. These constraints could reduce near-term market growth by an estimated 2.1% CAGR.
Challenges
| Challenge | (~) % CAGR | Geographic Relevance | Mitigation Horizon |
|---|---|---|---|
| Power cooling complexity | -1.8% | Global | Medium term (2 to 4 years) |
| Multi-vendor interoperability | -1.4% | Global | Medium term (2 to 4 years) |
| Cybersecurity policy sprawl | -1.2% | Global | Short term (2 years or less) |
| Automation skills shortage | -1.0% | North America and Europe | Long term (4 years or more) |
| Component sourcing volatility | -0.9% | Global | Short term (2 years or less) |
Power cooling complexity
High-density AI infrastructure is making data-center automation more complex across electrical, thermal, IT, and network systems. The IEA expects electricity consumption from AI-focused data centers to triple between 2025 and 2030, while total data-center electricity demand could approach 3% of global electricity use by 2030.
With renewables expected to supply nearly 50% of additional data-center electricity demand through 2030, operators need stronger integration, digital twins, and cooling telemetry. These challenges could create an estimated 1.8% CAGR friction drag.
Opportunities
| Opportunity | (~) % CAGR | Geographic Relevance | Execution Window |
|---|---|---|---|
| Energy-aware automation SaaS | +2.2% | Global | Medium term (2 to 4 years) |
| Edge-site orchestration | +1.7% | Asia Pacific and Latin America | Long term (4 years or more) |
| Autonomous remediation platforms | +1.5% | North America and Europe | Medium term (2 to 4 years) |
| Carbon reporting integration | +1.1% | Europe and North America | Medium term (2 to 4 years) |
| Managed automation services | +0.9% | Emerging markets | Short term (2 years or less) |
Energy-aware automation SaaS
Energy-aware automation offers a strong future revenue opportunity as most current systems focus on uptime rather than real-time energy optimization.
Advanced software-led efficiency measures could reduce data-center electricity demand by more than 15%, supporting recurring SaaS models based on energy savings, cooling optimization, and carbon reporting. With potential operating-cost reductions above 15%, energy-aware automation could add approximately 2.2% above the baseline CAGR while also helping operators meet growing sustainability reporting requirements.
Key Players Analysis
The Data Center Automation Market is led by Tier-1 infrastructure and platform providers, including Broadcom, Cisco, IBM, HPE, and ABB, supported by their large installed bases, software portfolios, and global reach. Broadcom reported USD 27.03 billion in infrastructure-software revenue in FY2025, up 26%, while investing USD 2.5 billion in infrastructure-software R&D and USD 10.9 billion in total R&D.
IBM generated USD 29.9 billion in software revenue in 2025, growing 10.6%, and spent USD 8.3 billion on R&D. Cisco recorded USD 56.6 billion in FY2025 revenue and invested USD 9.3 billion, or 16.4% of revenue, in R&D. Broadcom, Cisco, IBM, and HPE are estimated to represent around 45%–55% of the addressed competitive revenue base, although audited company-level market shares are not publicly available.
HPE generated USD 1.7 billion in Networking revenue in Q3 FY2025, up 54%. ABB reported USD 17.3 billion in Electrification revenue, growing 12%, alongside USD 8.08 billion in Automation revenue in 2025.
Among Tier-2 challengers, Hitachi reported ¥2.8 trillion in Digital Systems & Services revenue in FY2024, while Fujitsu Uvance revenue increased 47% to ¥709.3 billion in FY2025. OpenText generated USD 1.8 billion in cloud-services and subscription revenue and spent USD 755.9 million on R&D in FY2025.
Top Key Players in the Market
- Cisco Systems, Inc.
- Broadcom Inc.
- Hewlett Packard Enterprise (HPE)
- IBM Corporation
- BMC Software, Inc.
- Hitachi, Ltd.
- Open Text Corporation
- Fujitsu Limited
- ABB Group
- Juniper Networks, Inc.
Recent Developments
- In 2026, Cisco strengthened its automation, observability, and security portfolio by completing the acquisition of Galileo Technologies on May 22 and Astrix Security on June 29. Cisco later reported USD 17.3 billion in Q4 FY2026 revenue and USD 3.9 billion in GAAP net income.
- In 2025, HPE completed its acquisition of Juniper Networks on July 2 after agreeing to acquire the company for approximately USD 14 billion, or USD 40.0 per share. HPE subsequently raised its expected annual run-rate cost synergies to at least USD 600 million over 3 years, compared with the earlier USD 450 million target.
Report Scope
| Report Features | Description |
|---|---|
| Market Value (2025) | USD 11.9 Billion |
| Forecast Revenue (2035) | USD 44.8 Billion |
| CAGR (2026-2035) | 14.2% |
| Base Year for Estimation | 2025 |
| Historic Period | 2020-2024 |
| Forecast Period | 2026-2035 |
| Report Coverage | Revenue Forecast, Market Dynamics, Competitive Landscape, Recent Developments |
| Segments Covered | By Component (Solution, Services); By Deployment Mode (Cloud-Based, On-Premise); By Organization Size (Small and Medium-Sized Enterprises, Large Enterprises); By Industry Vertical (IT and Telecommunications, BFSI, Retail, Healthcare, Manufacturing, Government, Other) |
| Regional Analysis | North America – US, Canada; Europe – Germany, France, The UK, Spain, Italy, Rest of Europe; Asia Pacific – China, Japan, South Korea, India, Australia, Singapore, Rest of APAC; Latin America – Brazil, Mexico, Rest of Latin America; Middle East & Africa – GCC, South Africa, Rest of MEA |
| Competitive Landscape | Cisco Systems, Inc.; Broadcom Inc.; Hewlett Packard Enterprise (HPE); IBM Corporation; BMC Software, Inc.; Hitachi, Ltd.; Open Text Corporation; Fujitsu Limited; ABB Group; Juniper Networks, Inc. |
| Customization Scope | Customization for segments, region/country-level will be provided. Additional customization can be done based on requirements. |
| Purchase Options | We have three licenses to opt for: Single User License, Multi-User License (Up to 5 Users), Corporate Use License (Unlimited Users and Printable PDF) |





























