Report Overview
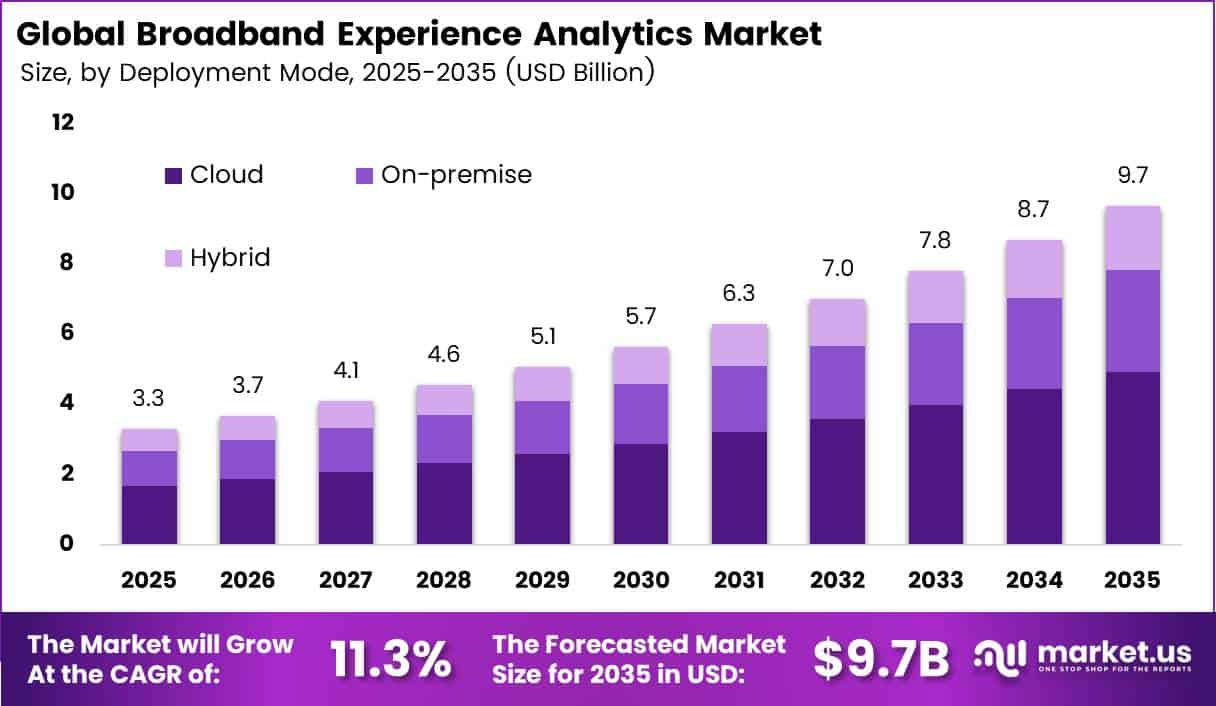
In 2025, the Global Broadband Experience Analytics Market was valued at USD 3.3 billion. The market is projected to grow at a CAGR of 11.3% during 2026–2035, reaching approximately USD 9.7 billion by 2035. North America dominated the global market in 2025, accounting for more than 31.3% of the total market share and generating approximately USD 1.03 billion in revenue.
Growth comes from the fast build-out of fixed broadband around the world. According to the ITU, fixed broadband subscriptions grew by an average of 5.2% each year over the past five years. Global fixed broadband use now stands at 20 subscriptions per 100 people.
That beats the old fixed line peak of 19 per 100 people, set in 2006. Each new fiber or cable home adds routers, mesh nodes, and smart devices that operators must watch. Operators now use analytics tools to spot slow Wi-Fi, fix faults early, and keep subscribers from leaving. As networks grow, manual checks no longer work, so demand for automated experience analytics keeps rising.
The North America region has deep fixed broadband use and strong public funding. The ITU reports 39 fixed broadband subscriptions per 100 people in high-income countries, compared with only 0.6 in low-income countries. In the US, the NTIA manages the USD 42.45 billion Broadband Equity, Access, and Deployment (BEAD) program to connect unserved homes.
Key Takeaways
- The Broadband Experience Analytics Market reached USD 3.3 billion in 2025 and will hit USD 9.7 billion by 2035. At a CAGR of 11.3% from 2026 to 2035.
- By Analytics Capability, Customer Experience Analytics leads with a 31.3% share.
- By Deployment Mode, Cloud leads with a 57.3% share and is also the fastest-growing sub-segment.
- By Component, Software leads with a 61.2% share.
- By Provider Type, Broadband Internet Service Providers lead with a 34.7% share.
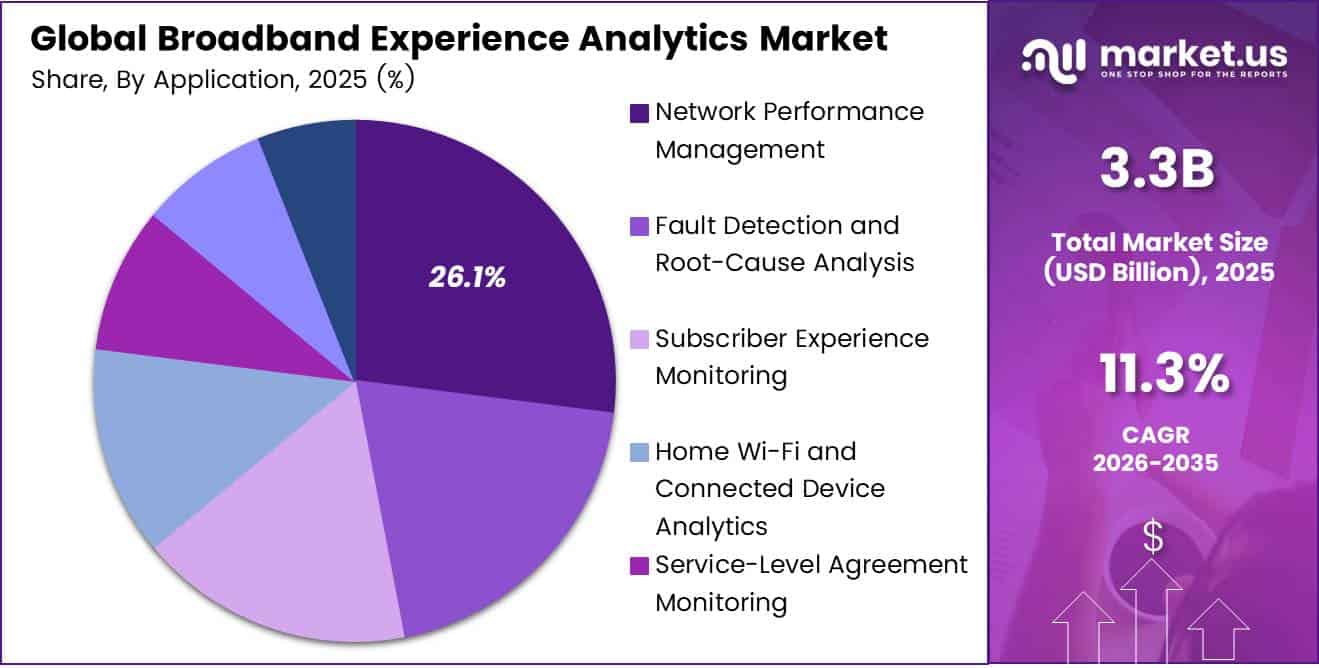
- By Application, Network Performance Management leads with a 26.1% share.
- By Organization Type, Large Operators lead with a 72.1% share.
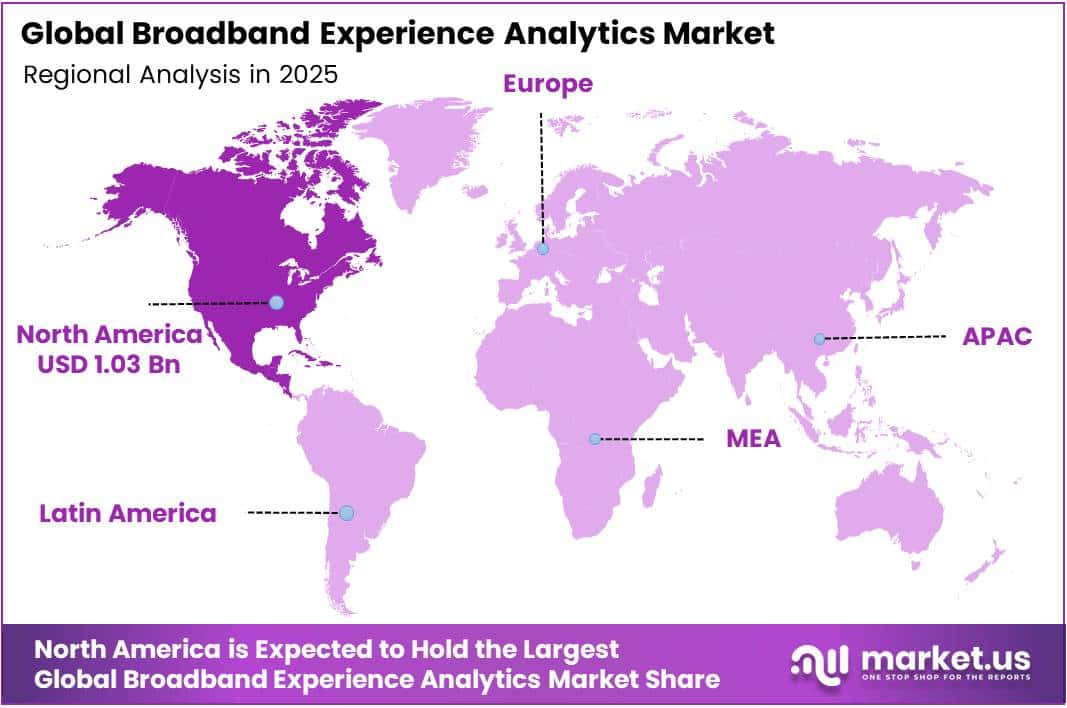
- North America leads with a 31.3% share, worth USD 1.03 billion in revenue.
By Analytics Capability
Customer Experience Analytics dominates with 31.3% due to a unified view of subscriber journeys.
Customer Experience Analytics leads because operators now serve a very large and demanding online public. ITU estimates that 6.1 billion people used the internet in 2025, which equals about 74% of the world’s population. With so many users, providers need one clear view of every customer journey, from sign-up to billing to support calls.
Quality of Experience Analytics grows fastest because users now judge broadband by how apps feel, not by headline speed. Video calls, cloud gaming, and streaming show small delays at once. QoE tools measure what each user actually sees on screen, so operators can link network faults to real user pain. As more households run many apps at the same time, providers move budgets toward this user-level view.
By Deployment Mode
Cloud dominates with 57.3% due to elastic scaling for subscriber data.
Cloud holds the largest share because broadband networks now produce far more data than in-house servers can easily handle. OECD data shows fibre made up 51% of all fixed broadband subscriptions across member countries in 2025, up from 31% in 2020. Fibre lines carry more traffic and more device signals, so operators need storage and computing power that grows on demand.
Cloud also grows fastest, and faster networks set this pace. Gigabit plans reached 24% of OECD fixed broadband subscriptions in 2025, so each home creates heavier data streams that need real-time review. Vendors now release new AI features straight into cloud platforms, and operators get these updates without long upgrade projects.
By Component
Software dominates with 61.2% due to its core role in data processing.
Software leads because it does the main work of collecting, sorting, and showing broadband data. ITU reports that fixed broadband subscriptions grew by an average of 5.2% per year over the past five years. Each new line adds more data points, and operators need strong software to turn raw signals into clear reports and alerts.
Services grow fastest because many operators lack the in-house skills to set up and run advanced analytics. Global fixed broadband penetration now stands at 20 subscriptions per 100 inhabitants, and this growing base pushes providers to seek outside help with setup, data links, and staff training. Consulting and managed services shorten launch time and lower project risk.
By Provider Type
Broadband Internet Service Providers dominate with 34.7% due to direct ownership of home subscriber links.
Broadband Internet Service Providers lead because they own the last-mile link into homes and deal with users every day. OECD average fixed broadband penetration rose from 33 to 37 subscriptions per 100 inhabitants between 2020 and 2025. In such mature markets, providers cannot rely on new sign-ups alone, so they invest in analytics to keep current customers happy and cut support costs.
Managed Service Providers grow fastest because many operators now hand network monitoring to outside experts. New access types add more complexity. Fixed wireless access reached 5.8% of OECD fixed broadband subscriptions in 2025, up from 4.8% in 2023, and mixed fibre, wireless, and satellite networks are hard to track in-house.
By Application
Network Performance Management dominates with 26.1% due to rising traffic load on access networks.
Network Performance Management leads because operators must keep networks stable before they can improve any other part of the user experience. ITU reports that 5G subscriptions already make up more than one-third of all mobile broadband subscriptions, and these fast links push heavy traffic into fixed and backhaul networks.
Performance tools track speed, delay, and packet loss in real time, so teams can spot and fix congestion quickly. Churn Prediction and Retention grows fastest because winning a new customer costs far more than keeping an old one. Access gaps remain wide, with 39 fixed broadband subscriptions per 100 inhabitants in high-income countries against just 0.6 in low-income countries.
By Organization Type
Large Operators dominate with 72.1% due to huge subscriber bases and budgets.
Large Operators lead because they run the biggest networks and have the money to buy full analytics suites. Their fibre rollouts are also very large. OECD data shows total fibre subscriptions grew by nearly 15% per year from 2019 to 2024. Each new fibre area adds millions of data points that need constant review.
Small and Medium-Sized Operators grow fastest because cloud tools have lowered the entry cost of analytics. In the past, these firms could not afford large servers or data teams. Now they can rent ready-made platforms by the month. Fast-moving markets add pressure, as fibre subscriptions in Greece rose by 140% over the same period, and new local players in such markets need simple tools to compete.
Key Market Segments
By Analytics Capability
- Customer Experience Analytics
- Network Performance Analytics
- Quality of Experience Analytics
- Service Assurance Analytics
- Others
By Deployment Mode
- Cloud
- On-premise
- Hybrid
By Component
- Software
- Services
By Provider Type
- Broadband Internet Service Providers
- Telecom Service Providers
- Cable Operators
- Managed Service Providers
- Government and Regulatory Agencies
- Enterprise Network Operators
By Application
- Network Performance Management
- Fault Detection and Root-Cause Analysis
- Subscriber Experience Monitoring
- Home Wi-Fi and Connected Device Analytics
- Service-Level Agreement Monitoring
- Churn Prediction and Retention
- Other
By Organization Type
- Large Operators
- Small and Medium-Sized Operators
Geopolitical Impact Analysis
Trade tensions between the US and China directly raise costs for the hardware behind broadband analytics. In 2025, US Section 301 tariffs on Chinese semiconductors rose to 50%, up from 25%. Analytics tools depend on chip-based probes, edge servers, and smart Wi-Fi gateways. Higher chip costs push up the price of these devices. Vendors then pass part of the cost to operators through higher bundle prices.
Shipping disruption adds another layer of cost. UNCTAD reported that Suez Canal transits fell by more than 50% after Red Sea attacks. Ships rerouted around the Cape of Good Hope, adding about 10 to 14 days per Asia-to-Europe trip. Delays slow the delivery of network test gear and customer premises equipment. Operators in Europe and Africa then face slower rollouts of home Wi-Fi analytics.
Energy and metal prices also shape the market. The World Bank tracked sharp swings in copper prices, which rose above USD 10,000 per ton in 2025. Copper and rare metals feed into server boards, cables, and data center gear. Analytics platforms run on cloud data centers, so higher hardware and power costs raise hosting fees.
Trade volume shifts affect where vendors source parts. The WTO projected global merchandise trade growth of only about 0.9% for 2025 as tariffs took hold. Vendors respond by moving assembly to India, Vietnam, and Mexico. This shift lowers tariff exposure but adds short-term setup costs. Rules on Chinese suppliers in several Western countries also limit Huawei sales, which opens space for European and US vendors.
Regional Analysis
North America dominates the Broadband Experience Analytics Market, holding a 31.3% share and generating USD 1.03 billion in revenue. The US drives most of this demand. The FCC reports that more than 90% of US homes can now get fixed broadband at 100/20 Mbps speeds. Large cable and fiber firms compete on speed and Wi-Fi quality, so they invest heavily in experience tools.
AT&T alone committed USD 250 billion to fiber, wireless, and satellite network growth in 2026. Each new fiber home needs monitoring from day one. The FCC also runs the Broadband Data Collection program, which requires providers to file detailed coverage maps twice a year. These filings push operators to track real network results, not just plans. Canada adds steady demand.
The Canadian government set a goal to connect 100% of homes to 50/10 Mbps service by 2030, backed by the CAD 3.225 billion Universal Broadband Fund. Rural rollouts in both countries rely on cloud analytics, since field teams are small and spread out. US firms such as Calix, Plume, Cisco, and Ookla also base their research teams in the region.
Asia Pacific is the fastest-growing region in the market. China leads with more than 600 million fixed broadband users, based on MIIT data. India pushes fiber through BharatNet, which links over 200,000 village councils. Australia upgrades its NBN to give over 10 million homes gigabit access. Fast subscriber growth and a large base of smaller operators drive strong demand for cloud analytics across the region.
Europe holds a strong position, led by Germany, France, and the UK. The EU Digital Decade plan aims to give every home gigabit access by 2030. The European Commission reports that fiber to the premises now covers about 64% of EU homes. Germany works hard to close its fiber gap, while France leads in fiber use. Strict GDPR data rules shape how vendors design analytics.
Key Regions and Countries
North America
- US
- Canada
Europe
- Germany
- France
- The UK
- Spain
- Italy
- Rest of Europe
Asia Pacific
- China
- Japan
- South Korea
- India
- Australia
- Rest of APAC
Latin America
- Brazil
- Mexico
- Rest of Latin America
Middle East and Africa
- GCC
- South Africa
- Rest of MEA
Market Dynamics
Drivers
| Driver | (~) % Impact on CAGR Forecast | Geographic Relevance | Impact Timeline |
|---|---|---|---|
| Fiber and DOCSIS 4.0 Network Upgrades | +2.4% | North America, Europe, Asia Pacific | Short term (2 years or less) |
| Subscriber Churn Reduction Pressure | +1.9% | Global | Short term (2 years or less) |
| Wi-Fi 7 Home Gateway Rollouts | +1.6% | North America, Europe, East Asia | Medium term (2 to 4 years) |
| Regulatory Broadband Label and Performance Disclosure Mandates | +1.2% | United States, European Union, United Kingdom | Short term (2 years or less) |
| Hybrid Work and Cloud Gaming Latency Sensitivity | +1.0% | Global | Medium term (2 to 4 years) |
| Fixed Wireless Access Subscriber Growth | +0.9% | North America, India, Middle East | Short term (2 years or less) |
Fiber and DOCSIS 4.0 Network Upgrades
The in-home experience is. Fiber Broadband Association and RVA tracking show US fiber passings went past 88 million homes in 2024, adding about 10 million in one year. According to CableLabs specification milestones, DOCSIS 4.0 interoperability events and the first commercial deployments by major cable operators took place across 2024 and 2025.
More multi-gigabit tiers mean more ways the service can degrade, and Ookla-style crowdsourced measurement methods suggest that up to 60% of reported slowdowns start inside the home on Wi-Fi rather than on the access network.
Operator investor disclosures put the cost of an avoided truck roll at about USD 80 to USD 150 per visit, and AI-based fault isolation is commonly cited as cutting dispatches by 15% to 25%. Experience analytics is becoming a standard line item in network upgrade budgets, which adds an estimated 2.4 percentage points to the baseline 11.3% CAGR.
Restraints
| Restraint | (~) % Impact on CAGR Forecast | Geographic Relevance | Impact Timeline |
|---|---|---|---|
| Data Privacy and Consent Restrictions on Subscriber Telemetry | -1.8% | European Union, United Kingdom, India | Short term (2 years or less) |
| Tier-2 and Tier-3 Operator OpEx Constraints | -1.4% | Latin America, Africa, South and Southeast Asia | Short term (2 years or less) |
| Elevated Cost of Capital Delaying Network Budgets | -1.1% | Global | Short term (2 years or less) |
| Data Localization and Cross-Border Transfer Limits | -0.8% | China, India, Russia, Middle East | Medium term (2 to 4 years) |
| Restrictions on Untrusted Vendor CPE Firmware | -0.6% | United States, European Union | Medium term (2 to 4 years) |
Data Privacy and Consent Restrictions on Subscriber Telemetry
Broadband experience analytics depends on detailed telemetry from home gateways, including device fingerprints, traffic classification, and per-application usage. Privacy law increasingly treats much of this as personal data that needs a lawful basis to process.
The European Data Protection Board considers device identifiers and traffic metadata personal data under the GDPR, where fines can reach 4% of global annual turnover. In India, the Ministry of Electronics and Information Technology notified the Digital Personal Data Protection Rules in 2025, which phase in consent-manager and data-minimization obligations over roughly 18 months.
In practice, operators in Europe are shipping analytics with application-level visibility switched off by default. Consent rates reported in BEREC consultations are often below 40%, which leaves a large part of the installed base without usable telemetry. This reduces the value of premium analytics modules.
It also adds compliance work, such as data protection impact assessments and legal review, that can push contract signature back by about 6 to 9 months. Some operators have already cancelled or downgraded renewals. These effects take about 1.8 percentage points off the baseline 11.3% CAGR in privacy-regulated regions.
Challenges
| Challenge | (~) % CAGR Friction Drag | Geographic Relevance | Mitigation Horizon |
|---|---|---|---|
| Fragmented Multi-Vendor CPE Integration | -1.3% | Global | Medium term (2 to 4 years) |
| Network Data Science Talent Gap | -0.9% | North America, Europe, India | Long term (4 years or more) |
| Legacy OSS/BSS Interoperability Debt | -0.8% | Europe, Asia Pacific | Long term (4 years or more) |
| Proving Measurable Churn ROI | -0.6% | Global | Short term (2 years or less) |
| Gateway Cybersecurity Attack Surface | -0.5% | Global | Medium term (2 to 4 years) |
Fragmented Multi-Vendor CPE Integration
Most operators run several generations of home gateways and mesh extenders from different vendors, and each uses its own firmware, data models, and reporting intervals. As a result, the same device can report the same problem in incompatible ways.
The Broadband Forum’s TR-369 USP standard is meant to fix this, but Broadband Forum certification counts show that only a minority of the installed base is USP-capable. Large operators also commonly support 10 to 20 distinct CPE models at once.
Every unsupported model needs a custom agent or adapter. Operator RFP disclosures and vendor earnings calls point to integration timelines of 4 to 8 months per model family, and professional services can account for 25% to 35% of first-year contract value.
That holds back gross margins compared with pure-SaaS benchmarks. prpl Foundation membership expansion shows the industry is moving toward open reference firmware, but replacing CPE fleets takes 5 to 7 years, in line with operator depreciation schedules. Until that happens, integration friction reduces maximum growth by about 1.3 percentage points.
Opportunities
| Opportunity | (~) % Potential CAGR Upside | Geographic Relevance | Execution Window |
|---|---|---|---|
| Subsidized Rural Network Performance Verification | +1.7% | United States, India, European Union | Medium term (2 to 4 years) |
| Premium Consumer Wi-Fi Assurance Subscriptions | +1.4% | North America, Western Europe | Short term (2 years or less) |
| Generative AI Agentic Customer Care Integration | +1.2% | Global | Medium term (2 to 4 years) |
| SMB Managed Connectivity Analytics | +0.9% | North America, Europe, Asia Pacific | Medium term (2 to 4 years) |
| Smart Home and IoT Security Bundling | +0.8% | Global | Long term (4 years or more) |
| Satellite LEO Broadband Experience Monitoring | +0.6% | Africa, Latin America, Remote Regions | Long term (4 years or more) |
Subsidized Rural Network Performance Verification
Large public broadband subsidy programs are now moving from funding construction to confirming that the service actually performs. This creates demand for independent, subscriber-level performance checks that very few analytics vendors serve today, which is why it counts as untapped rather than a current driver. The NTIA’s BEAD program has a USD 42.45 billion allocation and was restructured in 2025.
It requires funded networks to meet speed and latency thresholds of 100/20 Mbps and 100 ms. FCC performance testing rules under earlier support programs already require periodic speed and latency testing, and a failure can cost a provider up to 25% of support. In India, the Department of Telecommunications BharatNet program covers more than 250,000 gram panchayats and has created a similar need to verify last-mile quality.
So far, compliance testing has mostly been done with one-off hardware probes and manual reporting. Vendors that adapt continuous experience analytics into turnkey compliance-as-a-service could cut verification cost per location by an estimated 40% to 60%. Because one analytics stack can serve both regulatory filings and operations, incremental gross margins of 70% to 80% are plausible.
Rural providers that often lack internal analytics teams would make up a sizable new customer base. If vendors capture this white space, it could add about 1.7 percentage points on top of the baseline 11.3% CAGR.
Key Players Analysis
Tier 1 leaders include Cisco, Ericsson, Nokia, and Huawei. Cisco posted revenue of about USD 56.7 billion in fiscal 2025 and spent close to USD 9.3 billion on R&D. Ericsson reported net sales of SEK 236.7 billion in 2025. It spent about SEK 48.9 billion on R&D, or just over 20% of sales. Nokia reported net sales of about EUR 19.2 billion in 2024 and expanded its optical business through the Infinera deal.
Nokia completed its purchase of Infinera at an enterprise value of about USD 2.3 billion. Nokia targets over EUR 200 million in operating profit savings from the deal by 2027. Huawei keeps a strong lead in Asia and the Middle East, but security rules limit its sales in many Western markets.
Amdocs leads in subscriber and churn analytics. It reported fiscal 2025 revenue of USD 4.53 billion and spent USD 340.8 million on R&D. In fiscal 2026, its revenue rose to USD 4.70 billion. Broadcom supplies the chips inside many broadband gateways and keeps a large footprint in the market.
Tier 2 challengers hold strong niche positions. Calix grew revenue by 20% to about USD 1.00 billion in 2025, with net income of USD 17.9 million. Plume leads in home Wi-Fi analytics, while RADCOM, Infovista, Opensignal, and Ookla focus on assurance and measurement. Ookla’s platform handles more than 250 million consumer speed tests each month.
Top Key Players in the Market
- Nokia Corporation
- Cisco Systems, Inc.
- Telefonaktiebolaget LM Ericsson
- Amdocs Limited
- Huawei Technologies Co., Ltd.
- Plume Design, Inc.
- Calix, Inc.
- Broadcom Inc.
- RADCOM Ltd.
- Infovista S.A.S.
- Opensignal Limited
- Ookla LLC
Recent Developments
- In April 2026, Nokia agreed to sell its Fixed Wireless Access business to Inseego and invested USD 10 million in Inseego for an ownership stake of about 11%.
- In March 2026, Accenture agreed to acquire Ookla, a platform that handles more than 250 million consumer speed tests per month, and closed the deal in June 2026.
- In August 2025, Ericsson completed the sale of iconectiv to Koch Equity Development, gaining a net cash benefit of about USD 1.0 billion.
- In July 2025, Hewlett Packard Enterprise completed its USD 14 billion acquisition of Juniper Networks, adding AI-driven network experience tools.
- In February 2025, Nokia completed its acquisition of Infinera at an enterprise value of about USD 2.3 billion, expanding its optical networks business.
Report Scope
| Report Features | Description |
|---|---|
| Market Value (2025) | USD 3.3 Billion |
| Forecast Revenue (2035) | USD 9.7 Billion |
| CAGR (2026-2035) | 11.3% |
| Base Year for Estimation | 2025 |
| Historic Period | 2020-2024 |
| Forecast Period | 2026-2035 |
| Report Coverage | Revenue Forecast, Market Dynamics, Competitive Landscape, Recent Developments |
| Segments Covered | By Analytics Capability (Customer Experience Analytics, Network Performance Analytics, Quality of Experience Analytics, Service Assurance Analytics, Others); By Deployment Mode (Cloud, On-premise, Hybrid); By Component (Software, Services); By Provider Type (Broadband Internet Service Providers, Telecom Service Providers, Cable Operators, Managed Service Providers, Government and Regulatory Agencies, Enterprise Network Operators); By Application (Network Performance Management, Fault Detection and Root-Cause Analysis, Subscriber Experience Monitoring, Home Wi-Fi and Connected Device Analytics, Service-Level Agreement Monitoring, Churn Prediction and Retention, Other); By Organization Type (Large Operators, Small and Medium-Sized Operators) |
| Regional Analysis | North America – US, Canada; Europe – Germany, France, The UK, Spain, Italy, Rest of Europe; Asia Pacific – China, Japan, South Korea, India, Australia, Singapore, Rest of APAC; Latin America – Brazil, Mexico, Rest of Latin America; Middle East & Africa – GCC, South Africa, Rest of MEA |
| Competitive Landscape | Nokia Corporation, Cisco Systems, Inc., Telefonaktiebolaget LM Ericsson, Amdocs Limited, Huawei Technologies Co., Ltd., Plume Design, Inc., Calix, Inc., Broadcom Inc., RADCOM Ltd., Infovista S.A.S., Opensignal Limited, Ookla LLC |
| Customization Scope | Customization for segments and region/country-level will be provided. Moreover, additional customization can be done based on the requirements. |
| Purchase Options | We have three licenses to opt for: Single User License, Multi-User License (Up to 5 Users), Corporate Use License (Unlimited Users and Printable PDF) |