
Global Biological Data Visualization Market By Technique (Sequencing, Microscopy, Magnetic Resonance Imaging, X-ray Crystallography and Others), By Application (Cell and Organism Imaging, Structural Biology and Molecular Modeling, Genomic Analysis, Alignments, Phylogeny, and Evolution and Systems Biology), By Platform (Windows, Mac OS, Linux and Others), By End-use (Academic Research, Pharmaceutical & Biotechnology Companies, Hospitals & Clinics and Others), Region and Companies – Industry Segment Outlook, Market Assessment, Competition Scenario, Trends and Forecast 2026-2035
- Published date: March 2026
- Report ID: 182129
- Number of Pages: 327
- Format:
-
keyboard_arrow_up
Quick Navigation
Report Overview
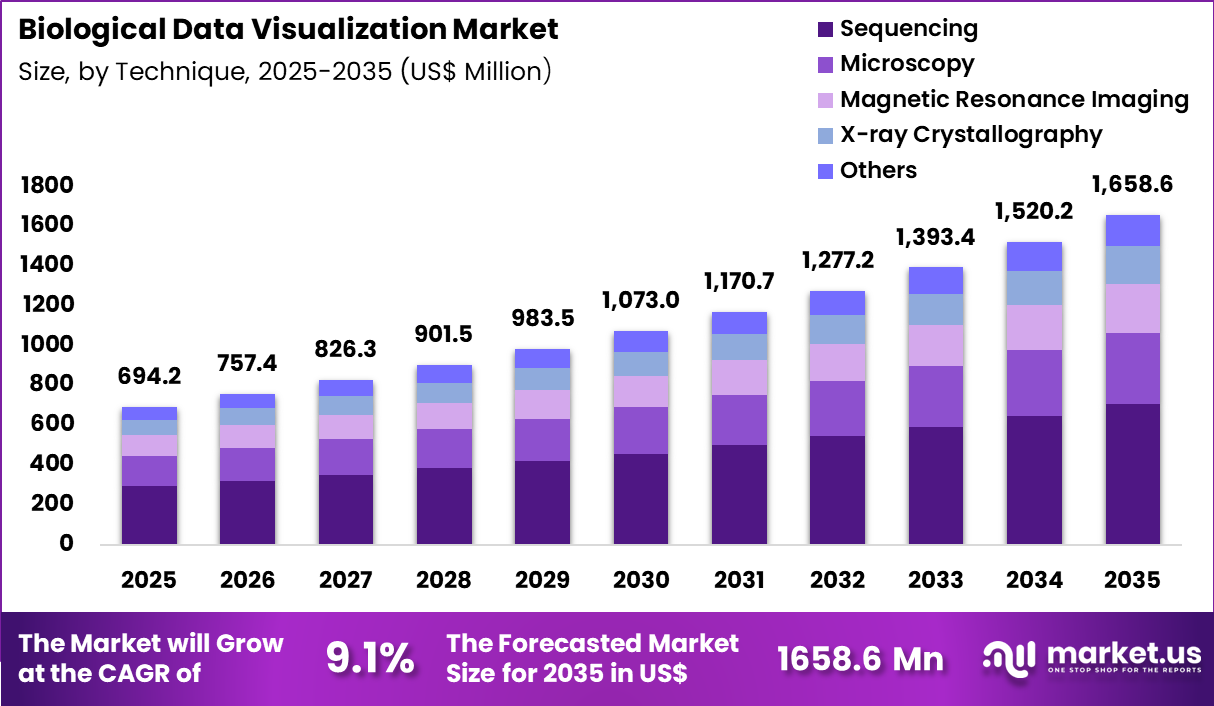
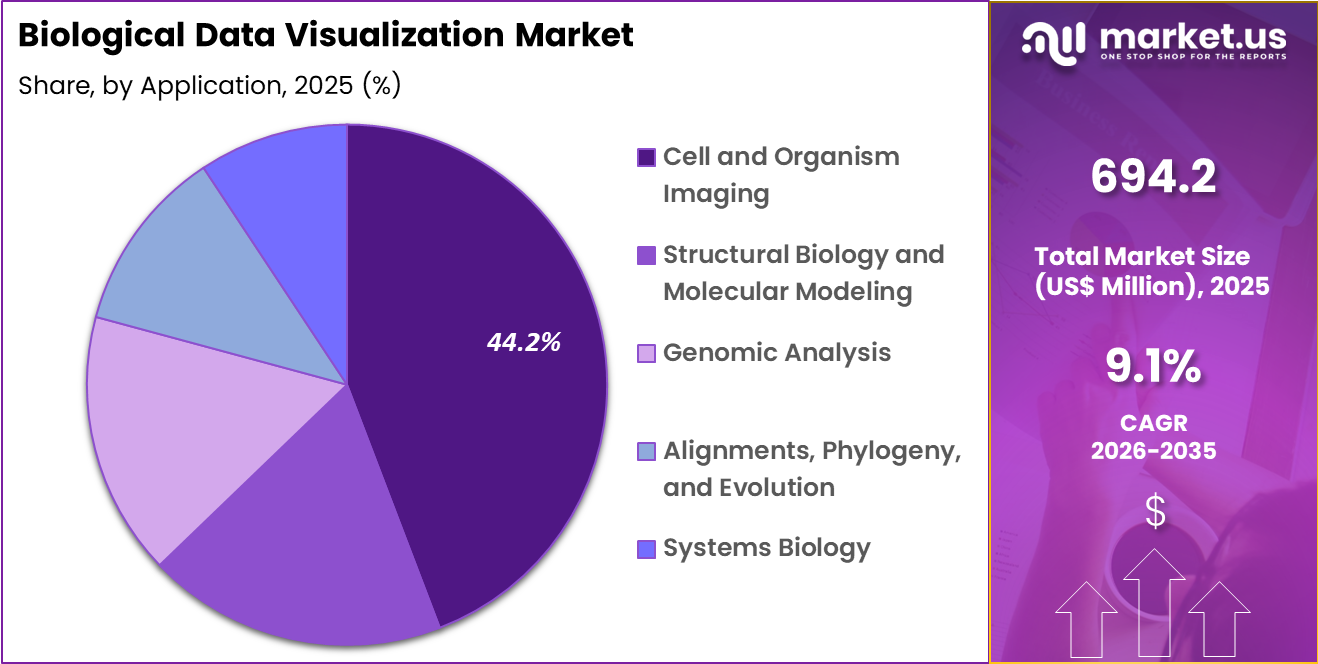
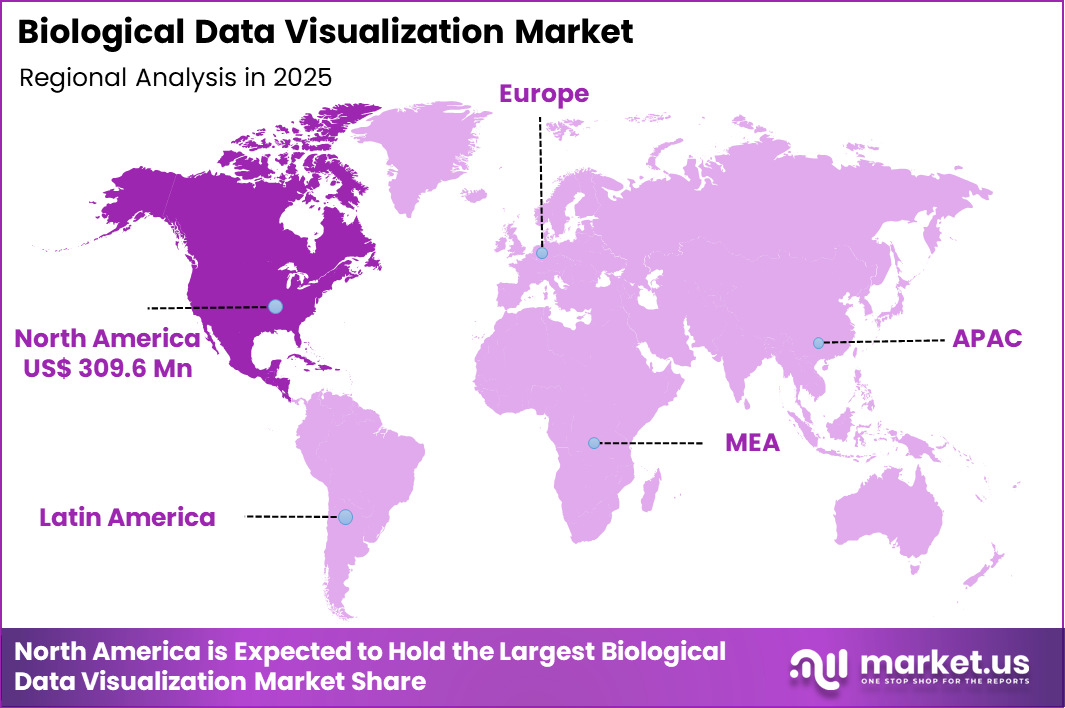
The Global Biological Data Visualization Market size is expected to be worth around US$ 1658.6 Million by 2035 from US$ 694.2 Million in 2025, growing at a CAGR of 9.1% during the forecast period 2026-2035. In 2025, North America led the market, achieving over 44.6% share with a revenue of US$ 309.6 Billion.
Growing demand for interpretable insights from complex biological datasets propels the Biological Data Visualization market as researchers and pharmaceutical companies require sophisticated tools to transform high-dimensional omics data into actionable knowledge.
Scientists increasingly employ interactive heatmaps and volcano plots in transcriptomics studies to identify differentially expressed genes in cancer subtypes, enabling rapid prioritization of therapeutic targets for precision oncology programs.
These visualization platforms support multi-omics integration by overlaying genomic, proteomic, and metabolomic layers, revealing pathway perturbations in neurodegenerative diseases such as Alzheimer’s and Parkinson’s for biomarker discovery. In structural biology, researchers utilize 3D molecular viewers to explore protein-ligand interactions and conformational dynamics, guiding rational drug design and virtual screening efforts.
Clinicians apply network-based visualizations to map protein-protein interactions and signaling cascades in rare genetic disorders, facilitating hypothesis generation for gene therapy development. At SLAS 2026 in February, Agilent presented an early view of its upcoming Cytation imaging platform. The system incorporates upgraded optical performance and faster image capture capabilities, alongside artificial intelligence–based tools designed to optimize laboratory workflows and improve high-content screening efficiency.
Manufacturers pursue opportunities to develop AI-augmented visualization platforms that automate pattern recognition and anomaly detection in large-scale single-cell datasets, expanding applications in immunology where researchers dissect immune cell heterogeneity and activation states in autoimmune and infectious disease models.
These tools facilitate real-time interactive dashboards that support collaborative analysis across global research teams, accelerating hypothesis testing in infectious disease outbreaks and vaccine development. Opportunities emerge in augmented and virtual reality interfaces that enable immersive exploration of 3D tissue architectures and cellular interactions, enhancing understanding of tumor microenvironments and organoid models.
Companies invest in cloud-based platforms with robust security features to handle sensitive patient-derived data while enabling secure sharing for multicenter studies. In early 2026, ZEISS reported an increasing contribution from recurring revenue streams, approaching nearly half of its total revenue base.
The company continues to emphasize its microsurgery segment, where advanced surgical microscopes support real-time three-dimensional visualization to assist clinicians during complex neurosurgical procedures.
Recent trends focus on explainable AI integration, multi-modal data fusion, and immersive visualization environments, positioning the market for sustained growth in data-driven discovery and translational research across life sciences.
Key Takeaways
- In 2025, the market generated a revenue of US$ 694.2 Million, with a CAGR of 9.1%, and is expected to reach US$ 1658.6 Million by the year 2035.
- The technique segment is divided into sequencing, microscopy, magnetic resonance imaging, x-ray crystallography and others, with sequencing taking the lead with a market share of 42.6%.
- Considering application, the market is divided into cell and organism imaging, structural biology and molecular modeling, genomic analysis, alignments, phylogeny, and evolution and systems biology. Among these, cell and organism imaging held a significant share of 44.2%.
- Furthermore, concerning the platform segment, the market is segregated into windows, mac OS, linux and others. The windows sector stands out as the dominant player, holding the largest revenue share of 70.3% in the market.
- The end-use segment is segregated into academic research, pharmaceutical & biotechnology companies, hospitals & clinics and others, with the academic research segment leading the market, holding a revenue share of 68.4%.
- North America led the market by securing a market share of 44.6%.
Technique Analysis
Sequencing accounted for 42.6% of growth within technique and dominate the biological data visualization market due to the massive expansion of genomic data generated through next-generation sequencing technologies. Research institutions and biotechnology companies increasingly rely on sequencing platforms to analyze DNA, RNA, and epigenetic information at high throughput.
The National Human Genome Research Institute highlights that sequencing costs have dropped dramatically over the past decade, which has accelerated genomic data generation worldwide. Scientists use advanced visualization tools to interpret complex genomic datasets, identify mutations, and understand genetic variation.
The segment is expected to expand as precision medicine initiatives and population genomics projects continue to grow globally. Increasing integration of sequencing data with bioinformatics platforms is likely to strengthen the demand for advanced visualization tools.
Application Analysis
Cell and organism imaging accounted for 44.2% of growth within application and dominate the biological data visualization market due to the increasing use of high-resolution imaging technologies in biological research. Researchers analyze cellular structures, tissue organization, and organism-level biological processes using microscopy and imaging platforms.
Visualization tools help scientists interpret large image datasets and extract meaningful biological insights. Advances in imaging technologies such as confocal microscopy and live-cell imaging generate complex datasets that require advanced visualization techniques.
The segment is projected to grow as biological research increasingly focuses on understanding cellular behavior and disease mechanisms. Rising adoption of imaging-based research in drug discovery and life sciences is expected to further drive demand for visualization solutions.
Platform Analysis
Windows accounted for 70.3% of growth within platform and dominate the biological data visualization market due to its widespread adoption across research institutions, laboratories, and healthcare organizations. Many bioinformatics and visualization software solutions are designed primarily for Windows environments due to compatibility and user familiarity.
Research facilities and academic institutions frequently deploy Windows-based systems because they support a wide range of analytical tools and computational software. The platform is expected to maintain its dominance as laboratories continue to rely on standardized operating environments for data analysis and visualization workflows. Increasing integration of visualization tools with enterprise IT infrastructure further strengthens Windows adoption in research settings.
End-Use Analysis
Academic research accounted for 68.4% of growth within end use and dominate the biological data visualization market due to the strong focus on scientific discovery and data-driven research across universities and research institutes.
Academic institutions generate large volumes of biological data through genomics, proteomics, and imaging studies. Researchers depend on advanced visualization tools to interpret complex datasets and communicate findings effectively.
Government funding agencies such as the National Institutes of Health continue to support large-scale biological research projects, which increases demand for data analysis and visualization tools. The segment is anticipated to expand as academic research programs continue to grow and generate increasingly complex biological datasets.
Key Market Segments
By Technique
- Sequencing
- Microscopy
- Magnetic Resonance Imaging
- X-ray Crystallography
- Others
By Application
- Cell and Organism Imaging
- Structural Biology and Molecular Modeling
- Genomic Analysis
- Alignments, Phylogeny, and Evolution
- Systems Biology
By Platform
- Windows
- Mac OS
- Linux
- Others
By End-use
- Academic Research
- Pharmaceutical & Biotechnology Companies
- Hospitals & Clinics
- Others
Drivers
Rising volume of multi-omics datasets is driving the market.
The generation of large-scale multi-omics data from genomics, transcriptomics, proteomics, and metabolomics has accelerated significantly in recent years. Researchers require advanced visualization tools to integrate and interpret these heterogeneous datasets effectively. The driver aligns with expanded adoption of next-generation sequencing and mass spectrometry technologies producing terabytes of biological information.
Academic institutions and pharmaceutical companies invest in platforms capable of interactive exploration of high-dimensional data. The trend supports identification of novel biomarkers through correlated patterns across omics layers. Enhanced visualization facilitates hypothesis generation in complex disease research.
The expansion reflects increased emphasis on systems biology approaches. Tools enable dynamic filtering and clustering of multi-layered datasets. Sustained data volume growth maintains demand for specialized visualization solutions. This factor reinforces market expansion through essential interpretive capabilities in biological research.
Restraints
Limited interoperability among visualization platforms is restraining the market.
Many biological data visualization tools operate with proprietary file formats and limited API support for seamless data exchange. Researchers encounter challenges transferring results between different software environments for downstream analysis. The restraint increases workflow inefficiencies when combining outputs from multiple omics pipelines.
The factor contributes to duplicated efforts in data reformatting and manual integration steps. Smaller research groups face difficulties adopting enterprise-grade platforms lacking flexible import/export options. The dynamic moderates collaboration across distributed teams using diverse toolsets.
The constraint limits scalability when handling federated datasets from consortium projects. Providers encounter extended onboarding times due to format conversion requirements. This limitation persists in constraining unified analysis pipelines across institutions. Interoperability gaps continue to affect adoption efficiency in multi-tool environments.
Opportunities
Integration of AI-assisted pattern recognition in visualization tools is creating growth opportunities.
Advanced platforms now incorporate machine learning algorithms to automatically detect clusters, trajectories, and differential features within complex biological datasets. These capabilities enable rapid identification of biologically meaningful patterns without extensive manual parameter tuning. Opportunities arise for accelerated discovery in drug target identification and disease subtyping.
The framework supports interactive refinement of AI-generated insights through user-guided visualization. Developers gain capacity to offer predictive modeling directly within visualization interfaces. The development facilitates handling of sparse and noisy single-cell datasets.
Such features attract pharmaceutical companies pursuing precision medicine initiatives. The opportunity fosters differentiation through reduced time-to-insight in exploratory analyses. Stakeholders anticipate improved reproducibility of pattern detection across studies. This advancement positions providers for expansion in AI-enhanced interpretive workflows.
Impact of Macroeconomic / Geopolitical Factors
Organizations increasingly rely on biological data visualization to interpret complex omics and clinical datasets, yet broader economic signals shape how quickly teams invest in advanced analytics tools. Rising costs for cloud computing, storage, and specialized software licenses put pressure on research budgets and can delay platform upgrades.
Tighter capital availability also affects biotech startups that depend on scalable visualization tools for data-driven discovery. Geopolitical dynamics influence data sharing policies, cross-border collaborations, and access to high-performance computing infrastructure. US tariffs on imported servers, GPUs, and networking hardware increase infrastructure costs for companies managing large biological datasets.
These pressures can slow system expansion and limit adoption in smaller research environments. At the same time, organizations prioritize efficient data interpretation and invest in integrated visualization platforms to accelerate insights. Growing reliance on data-intensive biology and precision medicine continues to support strong long-term demand.
Latest Trends
Increased adoption of cloud-based collaborative visualization platforms is driving the market.
Cloud-hosted solutions have gained prominence for enabling real-time collaborative exploration of biological datasets among distributed research teams. These platforms provide scalable computing resources for rendering large-scale visualizations without local hardware constraints. The 2024-2025 period reflects growing utilization in multi-institutional consortia projects requiring shared access to unified views.
Researchers benefit from version control and annotation features for joint interpretation sessions. The trend aligns with institutional policies promoting open science through accessible data sharing environments. Facilities report reduced infrastructure maintenance burdens compared to on-premises deployments.
The development supports integration with public repositories for seamless import of reference datasets. Early implementations demonstrate enhanced productivity in cross-disciplinary collaborations. The increased deployment accelerates knowledge dissemination across global research networks. Overall, this cloud transition strengthens accessibility and interactivity in biological data interpretation.
Regional Analysis
North America is leading the Biological Data Visualization Market
North America accounted for 44.6% of the biological data visualization market in 2025 as research institutions, pharmaceutical companies, and healthcare organizations expanded use of advanced analytics platforms to interpret complex biological datasets.The rapid growth of genomics, proteomics, and clinical data generation across the United States and Canada has created strong demand for tools that convert large-scale datasets into meaningful visual insights.
According to the National Human Genome Research Institute, the cost of sequencing a human genome fell to around USD 600 in 2023, significantly increasing the volume of genomic data generated and strengthening the need for advanced visualization solutions.
Life sciences companies are increasingly using visualization platforms to support drug discovery, biomarker identification, and precision medicine research. Academic institutions are integrating data visualization tools into bioinformatics and computational biology programs to enhance research capabilities.
Healthcare providers are also adopting these technologies to analyze patient data and improve clinical decision-making. Cloud computing and high-performance data processing technologies have enabled faster and more scalable visualization of large biological datasets.
Technology companies are developing interactive platforms that allow researchers to explore multi-dimensional data in real time. These developments collectively supported strong growth of biological data visualization solutions across North America in 2025.
The Asia Pacific region is expected to experience the highest CAGR during the forecast period
Asia Pacific is expected to experience strong expansion during the forecast period as biotechnology research and digital health initiatives accelerate across the region. Countries such as China, Japan, South Korea, and India are investing heavily in genomics research, biomedical data analytics, and precision medicine programs.
China’s National Bureau of Statistics reported that research and development spending reached about 3.09 trillion yuan in 2022, supporting large-scale data-driven research initiatives across life sciences. Research institutions and biotechnology companies across the region are generating vast volumes of genomic and clinical data that require advanced visualization tools for analysis and interpretation.
Governments are promoting national genomics programs and digital health strategies that encourage data integration and scientific collaboration. Universities are expanding bioinformatics and data science programs that train researchers in advanced analytical and visualization techniques.
Pharmaceutical companies are adopting data visualization platforms to improve drug discovery efficiency and clinical research outcomes. Cloud-based analytics platforms are enabling researchers to process and visualize complex datasets more efficiently across distributed research environments. These developments are expected to accelerate adoption of biological data visualization technologies throughout Asia Pacific in the coming years.
Key Regions and Countries
North America
- The US
- Canada
Europe
- Germany
- France
- The U.K.
- Italy
- Spain
- Russia & CIS
- Rest of Europe
Asia Pacific
- China
- India
- Japan
- South Korea
- ASEAN
- Australia & New Zealand
- Rest of Asia Pacific
Middle East & Africa
- GCC
- South Africa
- Rest of Middle East & Africa
Latin America
- Brazil
- Mexico
- Rest of Latin America
Key Players Analysis
Key participants in the Biological Data Visualization Market expand their presence by developing advanced visualization platforms, integrating AI-driven analytics, and enhancing interactive dashboards that help researchers interpret complex genomic and proteomic datasets.
Companies collaborate with pharmaceutical firms, research institutes, and biotech organizations to support drug discovery, precision medicine, and clinical research workflows. They also invest in cloud-based platforms and scalable data visualization tools that enable real-time analysis of large biological datasets.
Thermo Fisher Scientific represents a prominent participant in the Biological Data Visualization Market and operates as a global life sciences company headquartered in the United States that provides analytical instruments, software solutions, and laboratory services for research and healthcare applications.
The company develops bioinformatics and visualization tools that support data interpretation across genomics and molecular biology studies. Industry competitors continue to introduce advanced analytics platforms, strengthen research collaborations, and expand digital biology ecosystems to accelerate adoption of data-driven life sciences solutions.
Top Key Players
-
- Thermo Fisher Scientific, Inc.
- QIAGEN
- ZEISS International
- Oxford Instruments
- Olympus Corporation
- General Electric Company
- Agilent Technologies Inc.
- Clarivate
Recent Developments
- In January 2026, Thermo Fisher Scientific entered into a strategic collaboration with NVIDIA to embed advanced artificial intelligence capabilities into its scientific instrumentation portfolio. The partnership is focused on improving data processing speed and enabling more effective visualization of complex biological datasets generated in laboratory environments.
- In December 2025, QIAGEN completed the acquisition of Parse Biosciences, bringing Evercode single-cell sequencing technology into its broader digital solutions ecosystem. The integration supports large-scale single-cell analysis workflows, allowing researchers to generate and interpret high-resolution cellular data more efficiently.
Report Scope
Report Features Description Market Value (2025) US$ 694.2 Million Forecast Revenue (2035) US$ 1658.6 Million CAGR (2026-2035) 9.1% Base Year for Estimation 2025 Historic Period 2020-2024 Forecast Period 2026-2035 Report Coverage Revenue Forecast, Market Dynamics, COVID-19 Impact, Competitive Landscape, Recent Developments Segments Covered By Technique (Sequencing, Microscopy, Magnetic Resonance Imaging, X-ray Crystallography and Others), By Application (Cell and Organism Imaging, Structural Biology and Molecular Modeling, Genomic Analysis, Alignments, Phylogeny, and Evolution and Systems Biology), By Platform (Windows, Mac OS, Linux and Others), By End-use (Academic Research, Pharmaceutical & Biotechnology Companies, Hospitals & Clinics and Others) Regional Analysis North America – The US, Canada; Europe – Germany, France, The U.K., Italy, Spain, Russia & CIS, Rest of Europe; Asia Pacific – China, India, Japan, South Korea, ASEAN, Australia & New Zealand, Rest of Asia Pacific; Middle East & Africa – GCC, South Africa, Rest of Middle East & Africa; Latin America – Brazil, Mexico, Rest of Latin America Competitive Landscape Thermo Fisher Scientific, Inc., QIAGEN, ZEISS International, Oxford Instruments, Olympus Corporation, General Electric Company, Agilent Technologies Inc., Clarivate. Customization Scope Customization for segments, region/country-level will be provided. Moreover, additional customization can be done based on the requirements. Purchase Options We have three licenses to opt for: Single User License, Multi-User License (Up to 5 Users), Corporate Use License (Unlimited User and Printable PDF)  Biological Data Visualization MarketPublished date: March 2026add_shopping_cartBuy Now get_appDownload Sample
 -
-
- Thermo Fisher Scientific, Inc.
- QIAGEN
- ZEISS International
- Oxford Instruments
- Olympus Corporation
- General Electric Company
- Agilent Technologies Inc.
- Clarivate
Our Clients
- 182129
- March 2026


