


Report Overview
Global Basketball Equipment Market size is expected to be worth around USD 8.2 Billion by 2035 from USD 4.5 Billion in 2025, growing at a CAGR of 6.2% during the forecast period 2026 to 2035. This trajectory reflects sustained participation growth across school, collegiate, recreational, and professional tiers worldwide. Investors entering now face a market with compounding structural tailwinds rather than a single cyclical catalyst.
The basketball equipment market covers the full product stack required for play, training, and competition. This includes footwear, apparel, balls, hoops and goals, protective gear, and training accessories sold across offline retail, online platforms, and direct-to-consumer channels. End users span men, women, and youth across institutional, recreational, and professional segments globally.
Key Takeaways
- Market size in 2025: USD 4.5 Billion
- Market size by 2035: USD 8.2 Billion
- CAGR (2026 to 2035): 6.2%
- Dominant product type: Footwear with 42.0% share
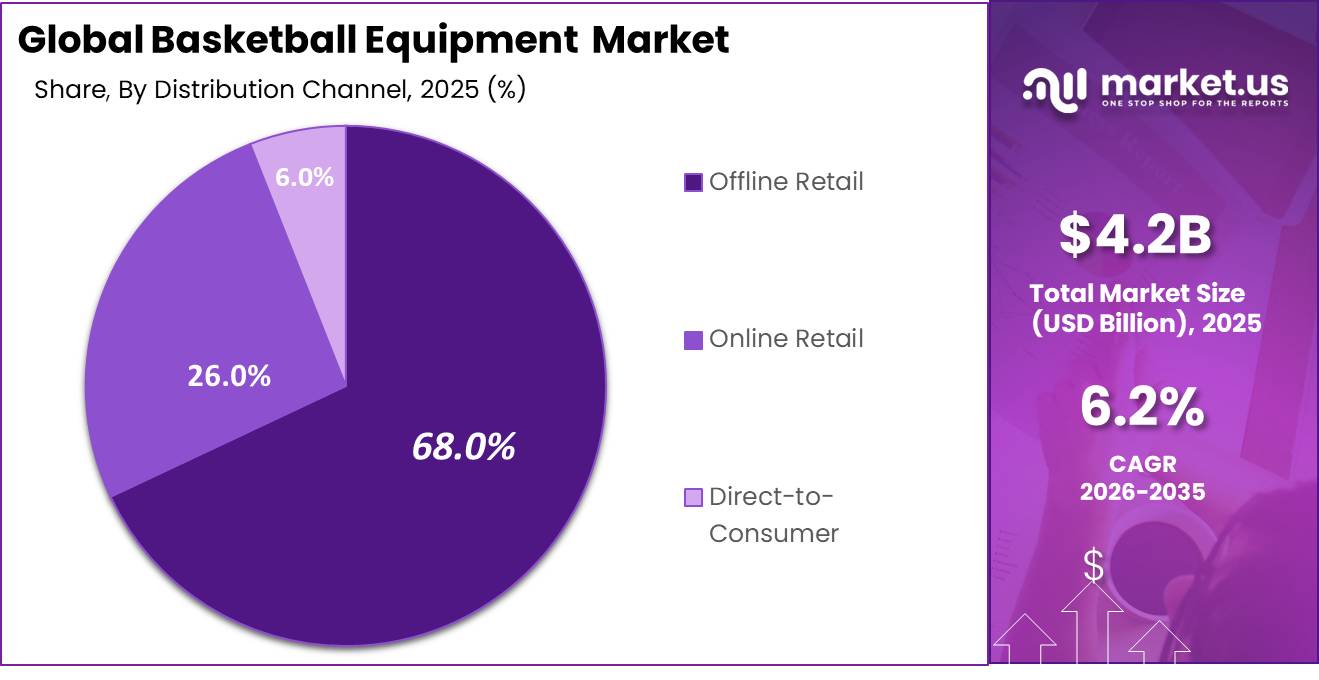
- Dominant distribution channel: Offline Retail with 68.0% share
- Dominant end user: Men with 62.0% share
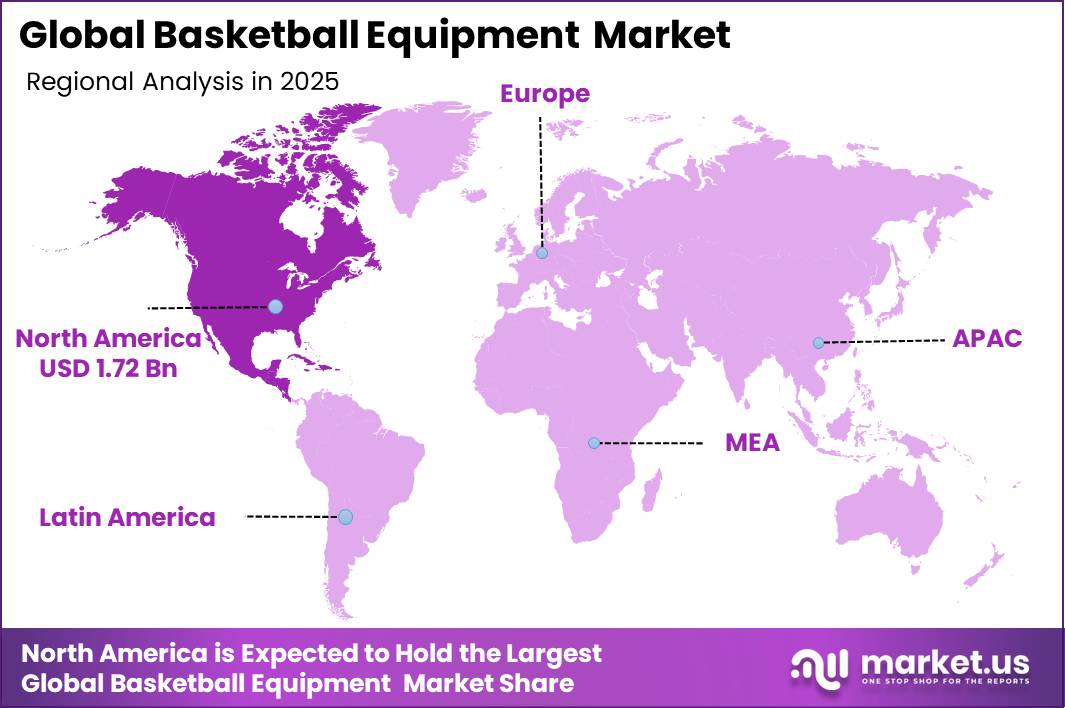
- Dominant region: North America with 38.5% share
According to Project Play data, 65% of youth aged 6 to 17 participated in sports at least once during 2024, up from 59% in 2021, the highest level recorded by SFIA since at least 2012. This recovery directly expands the addressable buyer pool for basketball equipment across all price tiers. Brands that scale youth-facing SKUs now will capture loyalty before competitors enter this cohort.
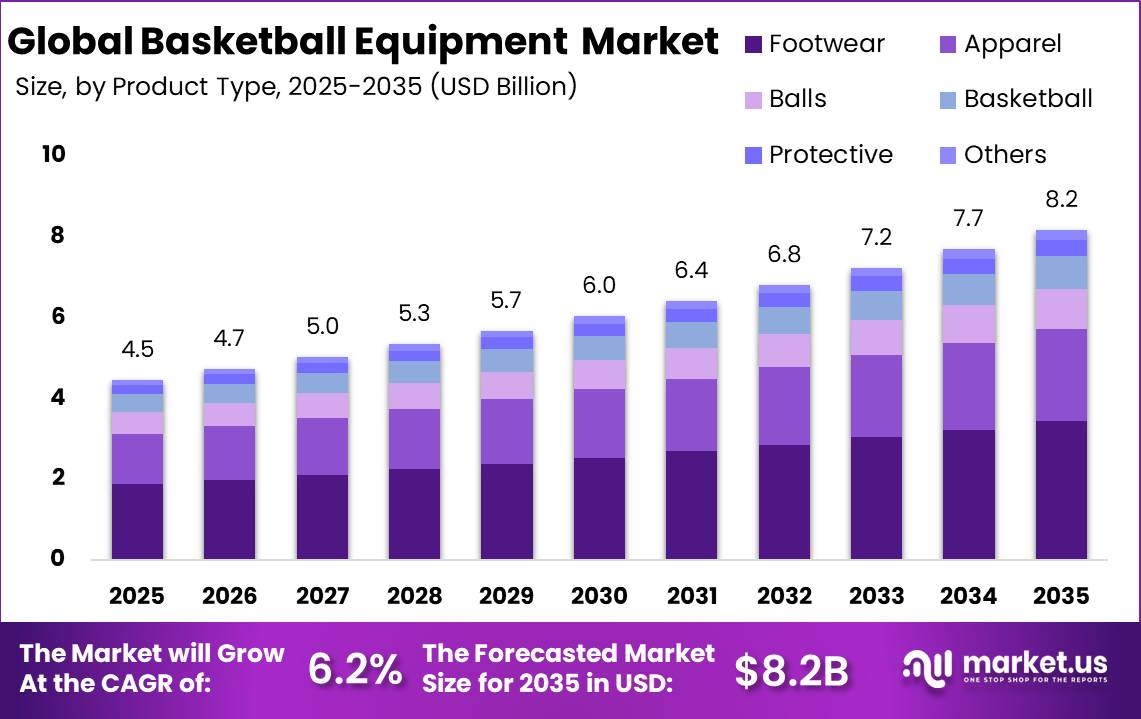
Project Play data also shows average annual spending on a child’s primary sport rose 46% between 2019 and 2025. This reflects a structural shift toward premium, performance-grade purchases rather than seasonal commodity buying. Vendors with tiered product lines that serve both budget-conscious and premium-seeking families hold the strongest positioning across this market. Wilson Sporting Goods continued supplying official game balls for major FIBA-associated tournaments and leagues throughout 2025, reinforcing the link between elite competition visibility and downstream consumer demand.
Product Type Analysis
Footwear dominates with 42.0% due to high replacement frequency and performance loyalty.
In 2025, Footwear held a dominant market position in the By Product Type segment of the Basketball Equipment Market, with a 42.0% share. Footwear drives the highest replenishment rate of any product category because court wear degrades faster than other gear. This means footwear suppliers benefit from recurring revenue cycles that are structurally independent of participation spikes.
Apparel commands a 28.0% share, anchored by team kit procurement from schools, clubs, and leagues. Institutional buyers place bulk orders on defined seasonal cycles, creating predictable revenue windows for manufacturers. Vendors with direct school and club channel relationships convert this predictability into more efficient inventory planning than general sporting goods retailers achieve.
Balls hold a 12.0% share, supported by FIBA 3×3 visibility at scale. FIBA 3×3 generated a record 1.35 billion video views during 2024, widening consumer awareness of format-specific ball standards. This signals an expanding addressable market for outdoor and 3×3-specific ball SKUs beyond the traditional indoor game ball category.
Basketball Hoops and Goals account for 10.0% of the market, driven by residential and municipal court installations. Protective Gear and Training Equipment holds 5.0%, while Others contribute the remaining 3.0%, covering accessories, bags, and ancillary training tools across institutional and recreational end users.
Distribution Channel Analysis
Offline Retail dominates with 68.0% due to trial-driven purchase behavior and institutional procurement.
In 2025, Offline Retail held a dominant market position in the By Distribution Channel segment of the Basketball Equipment Market, with a 68.0% share. Physical retail remains the primary channel because buyers across all segments, from parents selecting youth footwear to procurement officers ordering team kits, require tactile evaluation before committing. In 2026, Dick’s Sporting Goods expanded its sports retail strategy by rolling out more than 100 new in-store branded shop concepts, directly strengthening distribution density for basketball footwear, apparel, and equipment.
Online Retail captures 26.0% of channel revenue, driven by replenishment purchases where brand and size decisions are already established. Repeat buyers of balls, accessories, and apparel increasingly default to online for speed and price comparison. This channel is growing as a share of total revenue but remains anchored to categories where consumers do not need physical evaluation.
Direct-to-Consumer accounts for 6.0% of revenue but carries outsized strategic weight because it eliminates intermediary margin and builds first-party customer data. Brands that scale DTC channels gain pricing flexibility and loyalty leverage that offline-dependent competitors cannot replicate.
End User Analysis
Men dominate with 62.0% due to higher historical participation rates and institutional procurement volume.
In 2025, Men held a dominant market position in the By End User segment of the Basketball Equipment Market, with a 62.0% share. As reported by the NFHS, high school sports participation exceeded 8 million participants for the first time in history during the 2023 to 2024 school year. Male-dominated school and collegiate programs account for a disproportionate share of institutional equipment procurement, sustaining this segment’s lead.
Women represent a structurally underpenetrated segment whose share is rising as organized league participation expands. Project Play data shows participation among Latina girls increased from 39.5% in 2019 to 48.4% in 2024. This demographic shift signals that brands investing in women-specific fit, sizing, and product architecture now are positioned to capture a cohort with rising purchasing frequency before competitors build category presence.
Key Market Segments
By Product Type
- Footwear
- Apparel
- Balls
- Basketball Hoops and Goals
- Protective Gear and Training Equipment
- Others
By Distribution Channel
- Offline Retail
- Online Retail
- Direct-to-Consumer
By End User
- Men
- Women
- Kids
Regional Analysis
North America Dominates the Basketball Equipment Market with a Market Share of 38.5%, Valued at USD 1.7 Billion
North America holds the largest regional share at 38.5%, anchored by the deepest institutional procurement infrastructure globally. School, collegiate, and municipal programs generate predictable annual equipment budgets across every state. In 2026, Dick’s Sporting Goods accelerated its House of Sport concept expansion, with new locations featuring basketball courts and interactive equipment-testing environments, directly reinforcing omnichannel distribution depth for the basketball equipment category.
Europe represents the second-largest region, supported by club-structured participation systems across Germany, France, the UK, Spain, and Italy. National federations drive standardized equipment procurement for club teams, creating a reliable institutional revenue layer that supplements consumer retail. EU sustainability mandates are reshaping supplier qualification criteria, rewarding vendors who meet recycled materials thresholds ahead of competitors who do not.
Asia Pacific is the fastest-expanding region, driven by urban youth basketball adoption in China, Japan, South Korea, and India. In May 2025, Nike launched the S.T. Flare, its first basketball shoe engineered specifically for outdoor courts, targeting the outdoor basketball community in China. This product action confirms that major brands are committing capital to APAC urban segments as a long-term structural growth priority.
Latin America shows participation growth concentrated in Brazil and Mexico, though monetization of that participation into equipment purchases remains uneven across income brackets. Middle East and Africa present early-stage opportunity, particularly in GCC markets where government investment in sports infrastructure and youth engagement programs is actively expanding the addressable equipment buyer base.
Key Regions and Countries
North America
- US
- Canada
Europe
- Germany
- France
- The UK
- Spain
- Italy
- Rest of Europe
Asia Pacific
- China
- Japan
- South Korea
- India
- Australia
- Rest of APAC
Latin America
- Brazil
- Mexico
- Rest of Latin America
Middle East and Africa
- GCC
- South Africa
- Rest of MEA
Drivers
Omnichannel sporting-goods retailers are converting distribution efficiency into a direct growth mechanism for basketball equipment. DICK’S delivered 4.5% full-year 2025 comparable sales growth and opened 16 House of Sport and 15 Field House locations during 2025, with approximately 14 House of Sport and 22 Field House openings planned for 2026. Amer Sports raised direct-to-consumer revenue to 49% in 2025 from 30% in 2022. Decathlon reported 2025 GMV growth of 7.1% and net sales of EUR 16.8 Billion. These channel expansions improve premium ball shelf space, bundle-selling with footwear, and click-and-collect replenishment speed for schools and clubs, all of which convert into measurable CAGR uplift.
| Driver | (~) % Impact on CAGR Forecast | Geographic Relevance | Impact Timeline |
|---|---|---|---|
| Participation rebound in team sports and basketball frequency | +1.4% | North America core, Western Europe, urban APAC | Short term (≤ 2 years) |
| Female and youth basketball pipeline expansion | +1.1% | Europe, North America, China corridors, selected MENA | Medium term (2-4 years) |
| Omnichannel retail scaling and experiential sports stores | +0.9% | North America core, EU, developed APAC | Short term (≤ 2 years) |
| Premium replacement cycle in balls, footwear-linked accessories, and training aids | +0.8% | North America, Japan, South Korea, affluent EU | Medium term (2-4 years) |
| School, club, and municipal court investment | +0.7% | Europe, India, Southeast Asia, Latin America spill-over | Medium term (2-4 years) |
| Sustainability and material innovation in sporting goods supply chains | +0.5% | EU, North America, premium urban APAC | Long term (≥ 4 years) |
Restraints
Freight volatility continues to structurally constrain basketball equipment throughput, particularly for cube-inefficient items such as backboards, portable systems, and ball racks where logistics account for 8% to 15% of delivered cost. Drewry’s World Container Index remained approximately 97% above the 2019 pre-pandemic average in late 2024. By May 2026, the composite container rate reached approximately USD 2,800 per 40-foot container, with Shanghai to New York near USD 4,597 and Shanghai to Los Angeles around USD 3,473. A 2 to 4 week transit variance pushes seasonal school and league deliveries outside procurement windows, increasing canceled orders and working-capital absorption. This creates a measurable conversion drag that trims forecast CAGR by roughly 0.7 percentage points, especially across North America and Europe where imported hardgoods dominate.
| Restraint | (~) % Impact on CAGR Forecast | Geographic Relevance | Impact Timeline |
|---|---|---|---|
| Tariff-led landed cost inflation | -1.1% | North America core, China-linked supply chains, India export corridors | Short term (≤ 2 years) |
| Freight and lead-time volatility | -0.7% | U.S. import channels, EU, APAC export hubs | Short term (≤ 2 years) |
| Consumer affordability squeeze | -0.9% | North America, EU, urban APAC | Medium term (2-4 years) |
| Retail inventory discipline | -0.6% | North America core, EU chains, mature APAC | Medium term (2-4 years) |
| Certification and compliance cost load | -0.5% | Export-oriented Asia, EU, North America | Medium term (2-4 years) |
| Uneven participation monetization | -0.8% | LATAM, MEA, secondary Asia markets | Long term (≥ 4 years) |
Challenges
Demand forecasting in basketball equipment is distorted by overlapping school calendars, league registration cycles, tournament spikes, and weather-linked outdoor play patterns. The US high school sports base reached 8.26 million participants in 2024 to 2025, with boys’ basketball alone at 540,704 participants. That scale amplifies planning error because a 5% to 8% miss in back-to-school or institutional demand creates simultaneous stockouts in core SKUs and excess inventory in slower variants. Manufacturers typically operate with 10 to 18 weeks of forecast visibility but only 4 to 8 weeks of meaningful reorder agility on imported goods. This recurring mismatch creates a 0.5 percentage point CAGR drag through markdowns, missed replenishment, and inefficient working capital. Point-of-sale integration and league-calendar demand modeling are achievable within two years but require channel data sharing that many fragmented distributors still lack.
| Challenge | (~) % CAGR Friction Drag | Geographic Relevance | Mitigation Horizon |
|---|---|---|---|
| Materials Cost Volatility | -0.8% | North America imports, EU converters, APAC factories | Medium term (2-4 years) |
| Asia Supply Chain Concentration | -1.1% | China-Vietnam sourcing belts, US retail channels, EU import hubs | Medium term (2-4 years) |
| Tariff-Exposed Component Sourcing | -0.9% | North America core, cross-border OEM supply routes | Long term (≥ 4 years) |
| Entry-Level Quality Inconsistency | -0.7% | Emerging Asia, Latin America, e-commerce-heavy markets | Short term (≤ 2 years) |
| Court Infrastructure Replacement Lag | -0.6% | Municipal North America, Western Europe, urban APAC schools | Long term (≥ 4 years) |
| Demand Forecasting Seasonality Gaps | -0.5% | US school sports, Europe club channels, distributor-led APAC | Short term (≤ 2 years) |
Opportunities
Women-specific gear platforms represent the most undercapitalized structural opportunity in basketball equipment today. FIBA has formally prioritized female participation growth, and school-age girls are a named expansion cohort, yet the equipment sector has not yet fully translated that participation agenda into dedicated footwear sizing, protective gear, training accessories, and subscription-style team kits at scale. A credible upside case is a 1.6 percentage point CAGR lift if major brands convert even 8% to 12% of female participants from generic purchases into higher-frequency, fit-specific baskets. Women-led capsule lines typically support 300 to 600 basis points better gross margin, 15% to 25% lower markdown risk, and 1.2x to 1.4x higher repeat purchase rates when linked to clubs, school leagues, and creator-led digital storefronts. By 2030, this can open an incremental addressable pool worth roughly USD 550 Million to USD 800 Million globally across basketball apparel, practice accessories, and direct-to-consumer bundles.
| Opportunity | (~) % Potential CAGR Upside | Geographic Relevance | Execution Window |
|---|---|---|---|
| Women-specific gear platforms | +1.6% | North America, EU, APAC urban | Short term (≤ 2 years) |
| 3×3 urban ecosystem bundles | +2.1% | APAC, EU, Middle East, Africa | Medium term (2-4 years) |
| Youth sports service bundling | +2.4% | North America core, EU, Gulf | Short term (≤ 2 years) |
| Circular resale and refurbish | +1.3% | EU, North America, Japan | Short term (≤ 2 years) |
| Africa and India entry playbook | +2.0% | Africa, India, Southeast Asia | Medium term (2-4 years) |
| Smart connected training gear | +1.8% | North America, China, Korea, EU | Long term (≥ 4 years) |
Key Company Insights
NIKE, Inc. commands the basketball equipment market through product innovation timed to cultural moments. In July 2025, Nike unveiled the Sabrina 3, Giannis Freak 7, and G.T. Future at its global SNKRS Showcase, and followed with the G.T. Future featuring Air Zoom, Zoom Strobel, and Cushlon 3.0 technologies. This sequenced launch strategy locks in athlete-segment loyalty before competitors can respond with comparable product depth.
Wilson Sporting Goods Co. holds a structural advantage through official ball supply relationships across major FIBA-associated tournaments and leagues. Its Airless Gen1 basketball, a fully 3D-printed inflation-free ball, signals a technology-first positioning that differentiates Wilson from conventional ball manufacturers. However, this premium technology remains a limited-distribution product, leaving Wilson exposed to share loss in the high-volume institutional segment where price and reliability outrank innovation.
Key Players
- NIKE, Inc.
- Adidas AG
- Under Armour, Inc.
- PUMA SE
- New Balance Athletics, Inc.
- Spalding (Russell Brands, LLC)
- Wilson Sporting Goods Co.
- Molten Corporation
- Decathlon S.A.
- AND1
- Anta Sports Products Limited
- Li-Ning Company Limited
- Skechers USA, Inc.
- Everlast Worldwide, Inc.
- Baden Sports, Inc.
- Others
Recent Developments
- February 2025 – Molten Corporation unveiled the official FIBA EuroBasket 2025 game ball based on its BG5000 platform, featuring a tournament-specific design developed in collaboration with FIBA.
- February 2025 – Wilson Sporting Goods reintroduced its limited-edition Airless Gen1 3D-printed basketball, expanding commercialization of its inflation-free basketball technology following strong demand from previous releases.
- September 2025 – Dick’s Sporting Goods completed its USD 2.4 Billion acquisition of Foot Locker, significantly expanding its basketball footwear and sports equipment retail footprint through more than 3,200 stores globally.
- 2025 – Franklin Sports launched WNBA-licensed youth basketball products under a new multi-year licensing agreement with the Women’s National Basketball Association, including toy hoops, basketball sets, and fan products.
- 2025 – Wilson Sporting Goods expanded its basketball ecosystem through the release of new WNBA player-signature basketball collections featuring league stars and team-themed designs.
- 2025 – Wilson Sporting Goods continued commercialization of advanced basketball technology by expanding availability of its Airless Gen1 basketball, a fully 3D-printed ball requiring no inflation.
Report Scope
| Report Features | Description |
|---|---|
| Market Value (2025) | USD 4.5 Billion |
| Forecast Revenue (2035) | USD 8.2 Billion |
| CAGR (2026-2035) | 6.2% |
| Base Year for Estimation | 2025 |
| Historic Period | 2020-2024 |
| Forecast Period | 2026-2035 |
| Report Coverage | Revenue Forecast, Market Dynamics, Market Opportunity Analysis, Technology and Innovation Landscape, Competitive Landscape, Recent Developments |
| Segments Covered | By Product Type (Footwear, Apparel, Balls, Basketball Hoops and Goals, Protective Gear and Training Equipment, Others); By Distribution Channel (Offline Retail, Online Retail, Direct-to-Consumer); By End User (Men, Women, Kids) |
| Regional Analysis | North America (US and Canada), Europe (Germany, France, The UK, Spain, Italy, and Rest of Europe), Asia Pacific (China, Japan, South Korea, India, Australia, and Rest of APAC), Latin America (Brazil, Mexico, and Rest of Latin America), Middle East and Africa (GCC, South Africa, and Rest of MEA) |
| Competitive Landscape | NIKE, Inc., Adidas AG, Under Armour, Inc., PUMA SE, New Balance Athletics, Inc., Spalding (Russell Brands, LLC), Wilson Sporting Goods Co., Molten Corporation, Decathlon S.A., AND1, Anta Sports Products Limited, Li-Ning Company Limited, Skechers USA, Inc., Everlast Worldwide, Inc., Baden Sports, Inc., Others |
| Customization Scope | Customization for segments, region/country-level will be provided. Additional customization can be done based on requirements. |
| Purchase Options | We have three licenses to opt for: Single User License, Multi-User License (Up to 5 Users), Corporate Use License (Unlimited User and Printable PDF) |
Frequently Asked Questions (FAQ)
The Global Basketball Equipment Market Size is USD 912.8 Million in 2023.
The Global Basketball Equipment Market is expected to grow at a CAGR of 4.30% (2024-2033).
Market.US has segmented the Global Basketball Equipment Marke by geographic (North America, Europe, APAC, South America, and Middle East and Africa). By Type(S Size, M Size, L Size, Other Types), By Application(Dog, Cat, Others)
Adidas, Amer Sports, Nike, Rawlings Sporting Goods, Spalding Sports Equipment, JORDAN, McDavid, Mizuno, Nivia Sports, Puma, Under Armour
The US, Canada, Mexico are leading key areas of operation for Global Basketball Equipment Market.





































