


Report Overview
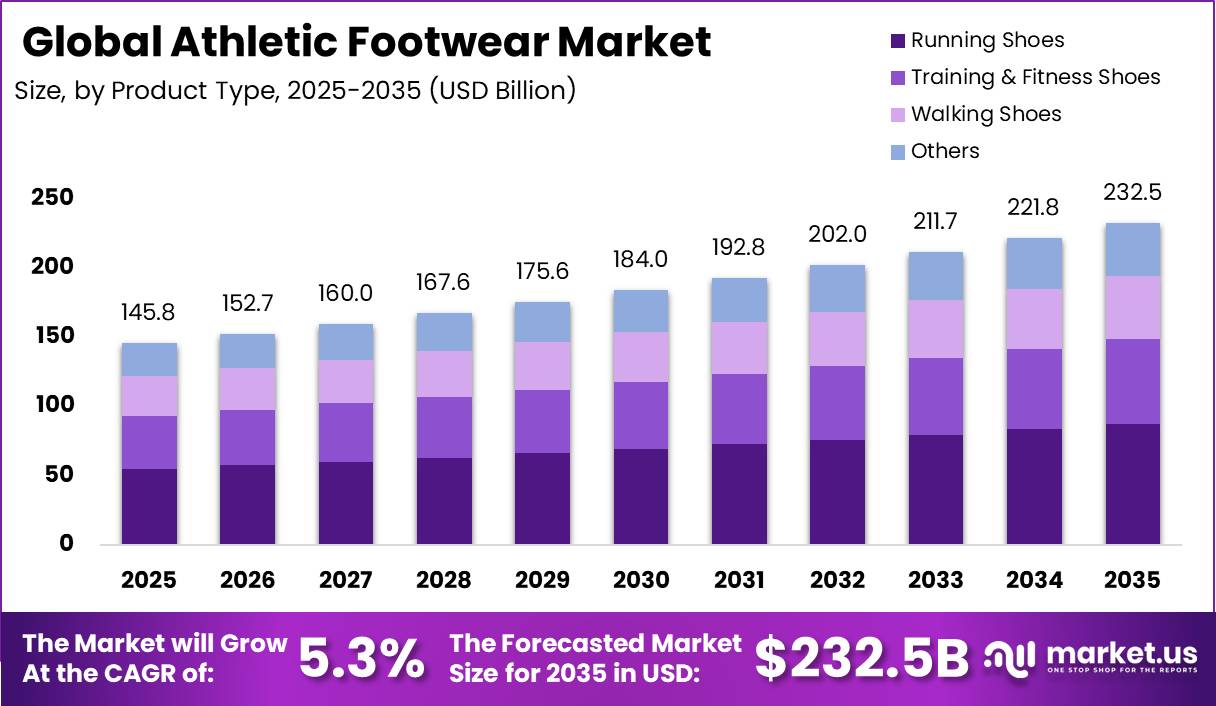
Global athletic footwear market size is expected to be worth around USD 232.5 Billion by 2035 from USD 145.8 Billion in 2025, growing at a CAGR of 5.3% during the forecast period 2026 to 2035.
The athletic footwear market covers shoes built for running, training, walking, and casual sport use. This structure spans product type, price range, distribution channel, material type, and end user categories. Therefore, brands compete across multiple price tiers and channels rather than one single format.
Government bodies across major economies continue to influence the market through trade policy and customs enforcement on imported footwear. Tariff structures on China to US and China to EU shipments directly shape sourcing decisions for major brands. This means manufacturers face rising landed costs that push some production toward Vietnam and Indonesia.
As reported by AlixPartners, 78% of U.S. footwear shoppers walked away from a purchase due to cost in 2025, up 12 percentage points from the prior year. This shift signals deepening price sensitivity among core buyers. As a result, brands must defend value perception through financing options and tiered product lines. In July 2025, New Balance launched the FuelCell Rebel v5, featuring a higher stack PEBA blended midsole built for daily training performance.
Key Takeaways
- Global Athletic Footwear Market size is valued at USD 145.8 Billion in 2025 and is projected to reach USD 232.5 Billion by 2035.
- The market is set to grow at a CAGR of 5.3% between 2026 and 2035.
- Running Shoes dominate the By Product Type segment with a 37.6% share.
- Economy and Budget footwear leads the By Price Range segment with a 35.0% share.
- Offline retail dominates the By Distribution Channel segment with a 56.3% share.
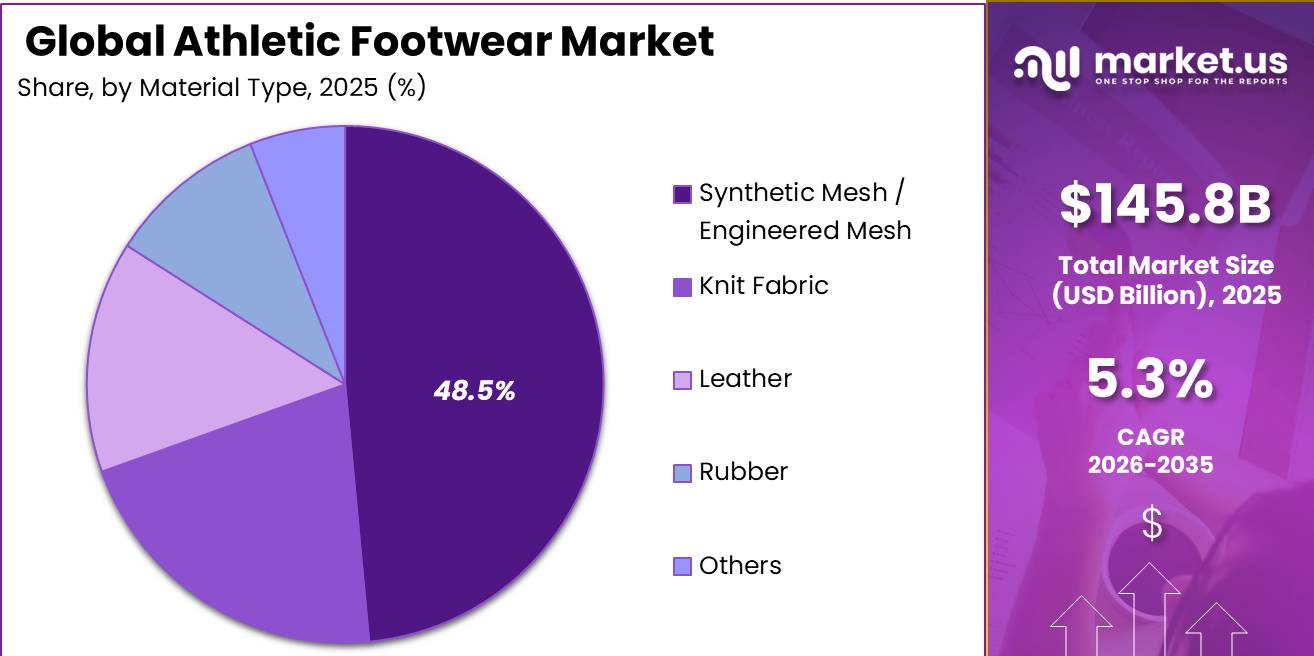
- Synthetic Mesh leads the By Material Type segment with a 48.5% share.
- Men hold the largest share in the By End User segment at 58.9%.
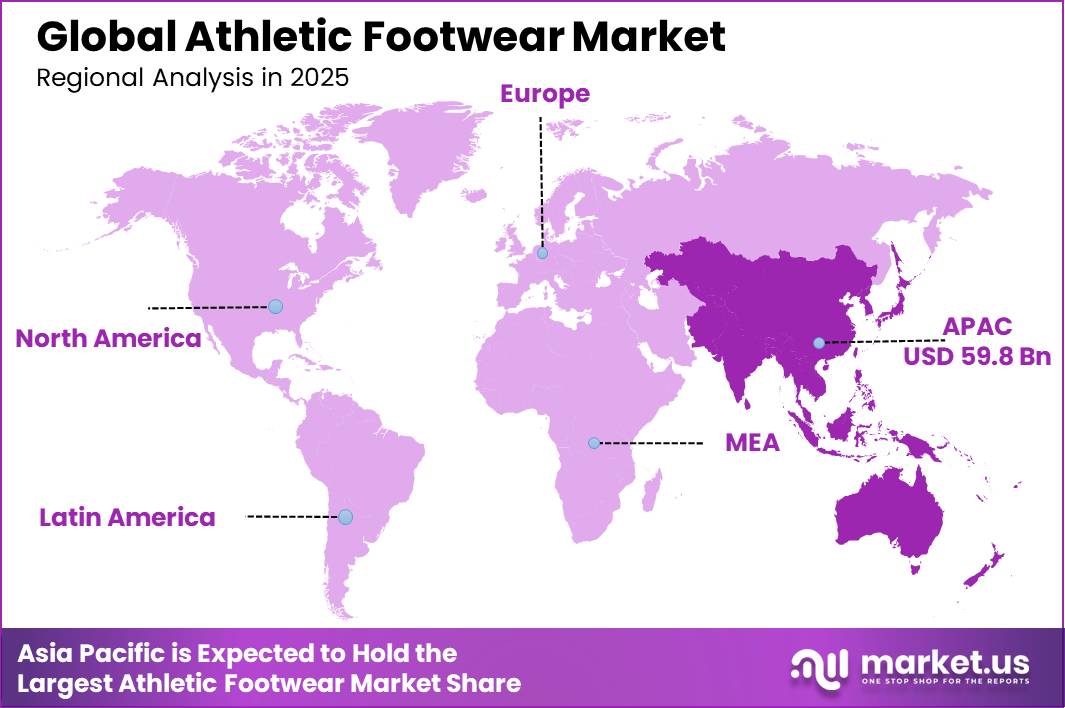
- Asia Pacific dominates the regional market with a 41.0% share, valued at USD 59.77 Billion.
Product Type Analysis
Running Shoes dominates with 37.6% due to high replacement frequency and performance demand.
In 2025, Running Shoes held a dominant market position in the By Product Type segment of Athletic Footwear Market, with a 37.6% share. Runners replace shoes more often than casual buyers, which sustains repeat purchase cycles. According to Runnea, 50% of surveyed runners intended to repurchase the same brand, reinforcing loyalty driven revenue stability for established performance labels.
Training and Fitness Shoes serve gym and cross training buyers who prioritize stability and durability over pure cushioning. This sub-segment grew fastest among product types in 2025. Consequently, brands are investing in multi-purpose designs that support both lifting and cardio sessions within a single shoe.
Walking Shoes hold a 19.6% share, appealing to buyers seeking comfort over performance specifications. This segment draws steady demand from older consumers and casual users. As a result, brands position walking models around cushioning technology rather than competitive racing features.
Others account for the remaining 16.5% share, covering niche athletic formats outside the four core categories. In November 2025, Puma launched the Fast-R NITRO Elite 3 racing shoe with an updated foam platform for competitive runners. This signals continued innovation pressure even within smaller product niches.
Price Range Analysis
Economy / Budget dominates with 35.0% due to broad affordability across price sensitive buyers.
In 2025, Economy / Budget held a dominant market position in the By Price Range segment of Athletic Footwear Market, with a 35.0% share. This tier serves cost conscious households across emerging and developed markets alike. Therefore, mass retailers and value chains continue to anchor volume sales in this category.
Premium price tiers recorded the fastest growth within the price range segment in 2025. Buyers in this tier pay more for proprietary cushioning and technical fabrics. This reflects rising willingness among consumers to trade up for performance specific features.
Distribution Channel Analysis
Offline dominates with 56.3% due to fitting needs and established retail networks.
In 2025, Offline held a dominant market position in the By Distribution Channel segment of Athletic Footwear Market, with a 56.3% share. Physical stores let buyers test fit and cushioning before purchase. This matters because sizing accuracy directly affects return rates and customer satisfaction.
Online / E-commerce grew fastest among distribution channels during 2025. As per our research, 65% of consumers abandoned purchases due to out of stock sizes, a 91% increase year over year. This signals that digital inventory visibility now directly shapes online conversion rates.
Material Type Analysis
Synthetic Mesh / Engineered Mesh dominates with 48.5% due to lightweight breathable performance benefits.
In 2025, Synthetic Mesh / Engineered Mesh held a dominant market position in the By Material Type segment of Athletic Footwear Market, with a 48.5% share. This material also recorded the fastest growth rate among material types. Manufacturers favor mesh because it balances cost, weight, and durability across mass and premium tiers.
End User Analysis
Men dominates with 58.9% due to higher historical participation in performance sports categories.
In 2025, Men held a dominant market position in the By End User segment of Athletic Footwear Market, with a 58.9% share. This group drives consistent demand across running and training categories. Therefore, brands continue prioritizing men’s product lines for flagship technology launches.
Women recorded the fastest growth rate within the End User segment in 2025. This growth reflects expanding female specific design and fit research across major brands. Consequently, women specific lasts and sizing now represent a distinct growth lever for product teams.
Key Market Segments
By Product Type
- Running Shoes
- Training and Fitness Shoes
- Walking Shoes
- Others
By Price Range
- Economy / Budget (Below USD 50)
- Mid-Range (USD 50 to 100)
- Premium (USD 100 to 200)
- Super-Premium (USD 200 to 400)
- Ultra-Premium / Luxury (Above USD 400)
By Distribution Channel
- Offline
- Brand-owned mono stores and flagship stores
- Hypermarkets and department stores
- Others
- Online / E-commerce
- Brand-owned D2C websites
- E-commerce marketplaces
- Social commerce
- Others
By Material Type
- Synthetic Mesh / Engineered Mesh
- Knit Fabric
- Leather
- Rubber
- Others
By End User
- Men
- Women
- Kids / Youth
- Toddlers and infants (0 to 3 years)
- Children (4 to 12 years)
- Teens / juniors (13 to 17 years)
- Unisex
Regional Analysis
Asia Pacific Dominates the Athletic Footwear Market with a Market Share of 41.0%, Valued at USD 59.77 Billion
Asia Pacific leads the athletic footwear market due to its large manufacturing base and rapidly expanding urban sportswear culture. Regional production hubs reduce sourcing costs for global brands. This structural advantage supports consistent volume growth across China, India, and Southeast Asian markets through 2035.
North America holds a 38.6% share, supported by strong premium brand loyalty and dense flagship retail networks. Trade tariff policy directly affects sourcing costs into this region. Consumers here continue prioritizing performance technology over price, sustaining higher average selling prices across the category.
Key Regions and Countries
North America
- US
- Canada
Europe
- Germany
- France
- The UK
- Spain
- Italy
- Rest of Europe
Asia Pacific
- China
- Japan
- South Korea
- India
- Australia
- Rest of APAC
Latin America
- Brazil
- Mexico
- Rest of Latin America
Middle East and Africa
- GCC
- South Africa
- Rest of MEA
Drivers
Performance running stands out as the strongest demand engine in athletic footwear because it lifts both replacement frequency and average selling price rather than just unit volume. HOKA revenue rose 24% in fiscal 2025 to about USD 2.2 Billion, and On exceeded CHF 3.0 Billion in net sales in 2025.
This shows consumers continue paying more for differentiated cushioning and technical silhouettes even during cautious spending periods. As brands segment by race day, daily trainer, and trail use cases, they widen shelf productivity. This shift pushes business models toward faster innovation calendars and higher margin franchises built around hero platforms.
| Driver | (~) % Impact on CAGR Forecast | Geographic Relevance | Impact Timeline |
|---|---|---|---|
| Premium running and performance-specialization upgrade cycle | +1.4% | North America core, Western Europe, developed APAC | Medium term (2-4 years) |
| DTC, membership, and omnichannel conversion efficiency | +1.1% | North America core, EU, Japan, South Korea, urban China | Short term (≤ 2 years) |
| APAC premiumization and sports-participation expansion | +1.3% | China recovery pockets, India, Southeast Asia, Japan spill-over | Medium term (2-4 years) |
| Supply-chain diversification and tariff-driven sourcing realignment | +0.8% | U.S. import market, Vietnam-dependent sourcing hubs, China-exposed brands | Short term (≤ 2 years) |
| Sustainability compliance, traceability, and circular product architecture | +0.6% | EU core, UK alignment, premium global brands | Long term (≥ 4 years) |
| Lifestyle-sport crossover and higher wear-frequency demand | +0.9% | North America, Europe, GCC urban retail, APAC metro channels | Short term (≤ 2 years) |
Restraints
Trade policy has shifted from background cost noise into a structural drag on athletic footwear margins. US import tariffs on certain shoe categories can spike from near 11% to over 40% depending on HS code, while European rates commonly sit near 17% on some codes.
Removal of low value parcel exemptions adds USD 2 to 4 per pair in extra customs costs for direct to consumer brands. Layered tariffs of 15 to 30 percentage points force either retail price increases or margin compression. This collectively trims around 1.3 percentage points from sustainable CAGR by slowing cross border expansion.
| Restraint | (~) % Impact on CAGR Forecast | Geographic Relevance | Impact Timeline |
|---|---|---|---|
| Volatile input & labor costs | -1.6% | APAC hubs, NA, EU | Short-Medium |
| Trade tariffs & customs friction | -1.3% | US, EU, China, ASEAN | Short-Medium |
| Demand downtrading & price fatigue | -1.1% | North America core, EU, LATAM | Short term |
| Sustainability & compliance cost overhang | -0.9% | EU, UK, NA, Developed APAC | Medium-Long |
| Supply-chain complexity & lead-time risk | -0.8% | APAC corridors, Global brands | Short-Long |
| Tax & indirect duty shifts | -0.6% | India, Emerging APAC, LATAM | Short-Medium |
Challenges
The athletic footwear supply chain still relies heavily on long haul ocean shipping from Southeast Asia and China, with factory to distribution center lead times of 55 to 75 days. This causes 3 to 5% of seasonal assortments to miss ideal launch windows or require discounting.
Port congestion adds 3 to 7 days of average transit risk, extending pipeline inventory by 8 to 12%. Many distribution centers still operate legacy picking models at 80 to 90 lines per labor hour versus 140 to 160 achievable with robotics, raising per pair logistics cost by USD 0.3 to 0.6.
| Challenge | (~) % CAGR Friction Drag | Geographic Relevance | Mitigation Horizon |
|---|---|---|---|
| Volatile input material costs | -1.2% | APAC sourcing hubs, EU, North America | Medium term (2-4 years) |
| Supply chain and logistics rigidity | -1.0% | APAC-US/EU lanes, Latin America, EMEA | Medium term (2-4 years) |
| Sustainability and compliance burden | -0.9% | EU regulatory hubs, North America core | Long term (≥ 4 years) |
| Talent and labor productivity gaps | -0.8% | North America, Western Europe, China, ASEAN | Long term (≥ 4 years) |
| Demand fragmentation and channel complexity | -0.7% | Global urban markets, digital-first APAC | Medium term (2-4 years) |
| Innovation and performance-cost trade-offs | -0.6% | Global performance segments, premium brands | Long term (≥ 4 years) |
Opportunities
A major untapped opportunity lies in shifting athletic footwear from a pure sports item toward a medically validated mobility platform. This expands addressable spend into podiatry, preventive health, and employer wellness reimbursement channels beyond core fitness demand.
If 3 to 5% of global units shifted to medically positioned products at a 25 to 40% ASP premium, incremental revenue could reach USD 3 to 5 Billion by the early 2030s. Aging developed markets and proven willingness to pay for performance narratives make this opportunity increasingly viable.
| Opportunity | (~) % Potential CAGR Upside | Geographic Relevance | Execution Window |
|---|---|---|---|
| Medicalized performance footwear | +1.4% | North America, EU, Japan, South Korea | Medium term |
| Women-specific premium innovation | +1.1% | North America, EU, India, China urban | Short term |
| Circular resale and refurbishment | +0.9% | EU, UK, North America | Short term |
| Team-sport B2B platforms | +1.3% | North America core, EU, Australia | Medium term |
| Outdoor-hybrid adjacency | +1.6% | North America, DACH, Nordics, Japan | Medium term |
| India and SEA value-premium ladder | +1.8% | India, Indonesia, Vietnam, Philippines | Long term |
Key Company Insights
Nike, Inc. holds a structural advantage through scale across running, training, and lifestyle categories worldwide. In January 2025, Nike launched the Pegasus Premium with a sculpted Air Zoom unit and ZoomX foam. According to FDRA, athletic and athleisure spending was projected to rise 28% year over year, supporting Nike’s broad portfolio demand base.
Adidas AG differentiates through sustainability positioning, with 60% of materials used across products and packaging classified as recycled or sustainably sourced. This reduces raw material exposure as compliance pressure rises in Europe. However, this approach requires continued capital investment, which may pressure near term margins against leaner competitors.
Key Players
- Nike, Inc.
- Adidas AG
- Skechers U.S.A., Inc.
- New Balance Athletics, Inc.
- Puma SE
- Deckers Brands
- Anta Sports Products Ltd.
- ASICS Corporation
- On Holding AG
- Under Armour, Inc.
- Li-Ning Company Ltd.
- Brooks Sports, Inc. (Berkshire Hathaway)
- FILA Holdings Corp.
- Wolverine World Wide, Inc.
- Mizuno Corporation
Recent Developments
- March 2026 – adidas announced its Adizero EVO SL approached 10 million pairs sold globally, marking one of the company’s most successful recent performance running launches.
- June 2026 – ASICS launched the GEL-KAYANO 33, introducing the new FLUIDSUPPORT guidance system with a dual layer cushioning platform for stability.
- July 2026 – HOKA launched the Clifton PRO, featuring the PROGLIDE+ system, supercritical foam technology, and a 42 mm heel stack.
Report Scope
| Report Features | Description |
|---|---|
| Market Value (2025) | USD 145.8 Billion |
| Forecast Revenue (2035) | USD 232.5 Billion |
| CAGR (2026-2035) | 5.3% |
| Base Year for Estimation | 2025 |
| Historic Period | 2020-2024 |
| Forecast Period | 2026-2035 |
| Report Coverage | Revenue Forecast, Market Dynamics, Market Opportunity Analysis, Technology and Innovation Landscape, Competitive Landscape, Recent Developments |
| Segments Covered | By Product Type (Running Shoes, Training and Fitness Shoes, Walking Shoes, Others), By Price Range (Economy/Budget, Mid-Range, Premium, Super-Premium, Ultra-Premium/Luxury), By Distribution Channel (Offline, Online/E-commerce), By Material Type (Synthetic Mesh, Knit Fabric, Leather, Rubber, Others), By End User (Men, Women, Kids/Youth, Unisex) |
| Regional Analysis | North America (US and Canada), Europe (Germany, France, The UK, Spain, Italy, and Rest of Europe), Asia Pacific (China, Japan, South Korea, India, Australia, and Rest of APAC), Latin America (Brazil, Mexico, and Rest of Latin America), Middle East and Africa (GCC, South Africa, and Rest of MEA) |
| Competitive Landscape | Nike, Inc., Adidas AG, Skechers U.S.A., Inc., New Balance Athletics, Inc., Puma SE, Deckers Brands, Anta Sports Products Ltd., ASICS Corporation, On Holding AG, Under Armour, Inc., Li-Ning Company Ltd., Brooks Sports, Inc. (Berkshire Hathaway), FILA Holdings Corp., Wolverine World Wide, Inc., Mizuno Corporation |
| Customization Scope | Customization for segments, region/country-level will be provided. Additional customization can be done based on requirements. |
| Purchase Options | We have three licenses to opt for: Single User License, Multi-User License (Up to 5 Users), Corporate Use License (Unlimited User and Printable PDF) |





































