


Report Overview
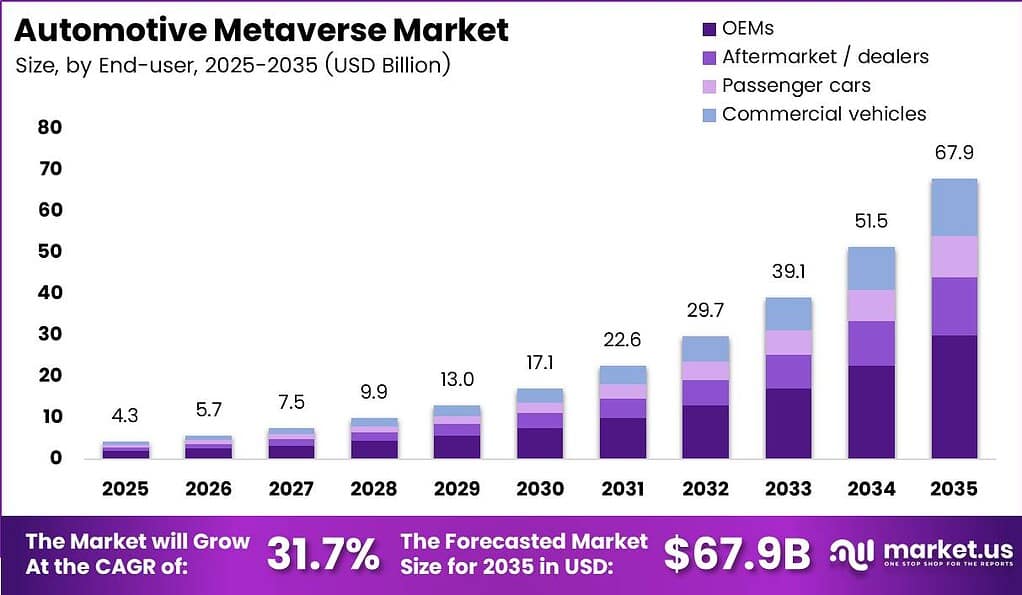
Global Automotive Metaverse Market size is expected to be worth around USD 67.9 Billion by 2035 from USD 5.7 Billion in 2025, growing at a CAGR of 31.7% during the forecast period 2026 to 2035.
The automotive metaverse market covers software platforms, hardware devices, and professional services that deliver immersive digital experiences across the vehicle lifecycle. Applications span virtual showrooms, engineering design, workforce training, simulation, testing, and in-vehicle entertainment. This market serves OEMs, aftermarket operators, dealers, and technology vendors building persistent virtual environments for automotive use cases.
Key Takeaways
- The global Automotive Metaverse Market is valued at USD 5.7 Billion in 2025 and is forecast to reach USD 67.9 Billion by 2035.
- The market expands at a CAGR of 31.7% from 2026 to 2035.
- By Component, Software dominates with a 40.1% share in 2025.
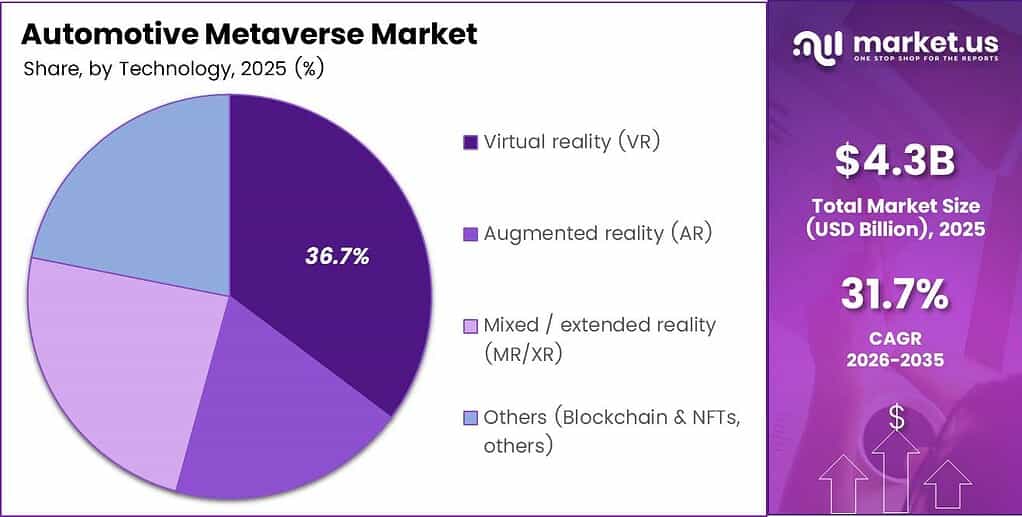
- By Technology, Virtual Reality holds the leading position with a 36.7% share.
- By Application, Virtual Showrooms and Dealerships leads with a 30.1% share.
- By End-user, OEMs hold the dominant position with a 41.1% share.
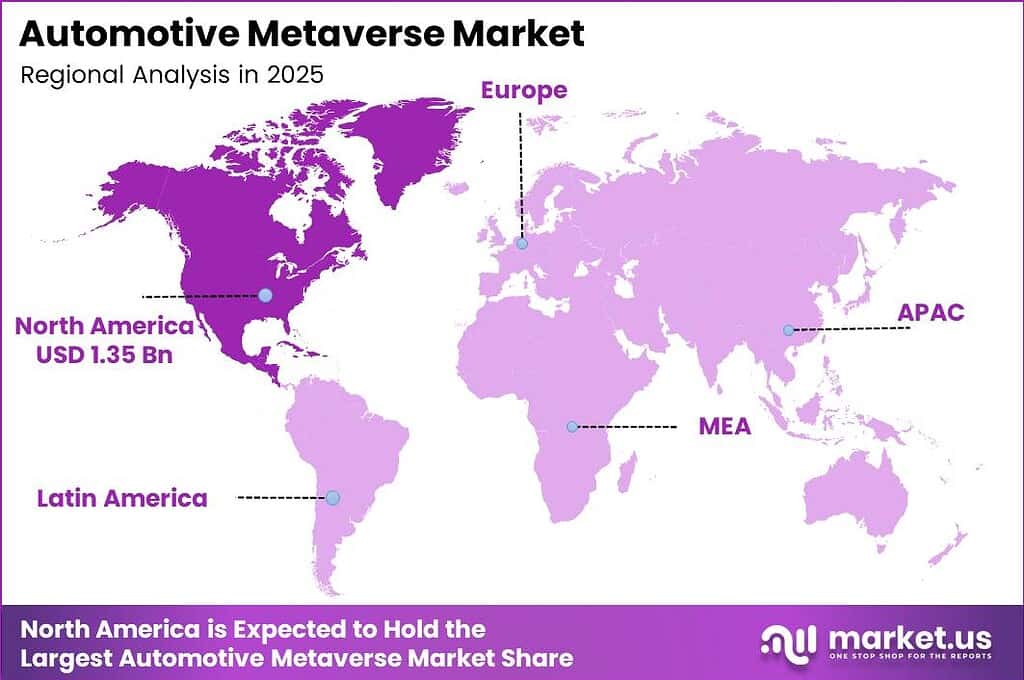
- North America is the dominant region with a 31.1% share, valued at USD 1.35 Billion in 2025.
- Asia Pacific is the fastest-growing regional market during the forecast period.
As per our research, world merchandise-trade volume grew 4.6% in 2025, reflecting an active global commercial environment that expanded procurement budgets for digital automotive tools. This trade expansion signals that OEM and supplier investment cycles remained healthy enough to fund metaverse platform pilots and broader rollouts. Vendors positioned in high-trade corridors across North America, Europe, and Asia Pacific stand to capture disproportionate share.
Meta Platforms reported $56.31 Billion in first-quarter 2026 revenue, a 33% year-over-year increase, signaling sustained enterprise commitment to immersive platform infrastructure. This revenue strength funds continued hardware and software investment that directly expands the toolset available to automotive metaverse developers. As per our research, global motor-vehicle production reached 96.4 Million units in 2025, a 3.9% increase, giving OEMs and suppliers a larger vehicle base across which to deploy digital-twin and immersive-experience programs.
In June 2026, Meta Platforms launched America’s Workforce Academy with an initial investment of $115 Million, reinforcing the business case for immersive training environments within industrial and automotive settings. This level of platform-side investment signals that the infrastructure for enterprise-grade metaverse applications is maturing. Automotive OEMs and their Tier 1 suppliers that move early on workforce training platforms will reduce onboarding costs while building proprietary data assets.
Component Analysis
Software dominates with 40.1% due to high platform licensing and integration demand.
In 2025, Software held a dominant market position in the By Component segment of the Automotive Metaverse Market, with a 40.1% share. OEMs and Tier 1 suppliers prioritize software because it enables recurring subscription models, faster feature updates, and cross-platform deployment without equivalent hardware capital expenditure. Nearly 22 Million electric cars were produced globally in 2025, more than 25% above the prior year, expanding the addressable base for software-enabled digital-twin and configuration tools tied to complex EV architectures.
Hardware captures the second-largest share of the component mix as headsets, spatial sensors, and edge-compute units become prerequisites for high-fidelity automotive metaverse deployments. Falling device costs and improved display resolution are lowering the barrier for dealer-level adoption. This shift creates a hardware refresh cycle that benefits specialist suppliers and opens cross-sell opportunities for bundled software and hardware packages.
Services represent the third component layer, covering implementation, content creation, system integration, and managed operations for automotive metaverse platforms. Automotive programs require deep customization, supplier data onboarding, and ongoing content maintenance, making services a structurally sticky revenue stream. Providers that lead on integration expertise will lock in longer contract terms and generate higher lifetime value per OEM relationship.
Technology Analysis
Virtual Reality (VR) dominates with 36.7% due to immersive design and training use-case fit.
In 2025, Virtual Reality (VR) held a dominant market position in the By Technology segment of the Automotive Metaverse Market, with a 36.7% share. VR delivers complete environmental immersion, making it the preferred technology for vehicle design reviews, factory layout simulation, and technician training programs. EU roads carried 6.2 Million trucks in 2024, a base that represents significant untapped demand for VR-based driver training and fleet management applications across commercial vehicle operators.
Augmented Reality (AR) captures the second technology tier by overlaying digital data onto physical environments, enabling real-time assembly guidance, quality inspection, and field-service support on production lines and in dealerships. AR’s lower hardware cost relative to full VR headsets accelerates adoption among dealer networks and aftermarket operators. This positions AR as the volume-growth technology segment even as VR maintains share leadership by revenue.
Mixed and Extended Reality (MR/XR) occupies the third technology position and is gaining traction in engineering environments where designers and engineers need simultaneous access to physical prototypes and digital overlays. MR/XR deployments typically command higher per-seat pricing due to platform complexity and bespoke integration requirements. As global growth was projected to slow from 2.9% in 2025 to 2.5% in 2026, MR/XR vendors targeting premium engineering accounts will face longer sales cycles, making outcome-linked pricing a competitive differentiator. Others, including Blockchain and NFTs, hold the remaining share collectively.
Application Analysis
Virtual Showrooms and Dealerships dominates with 30.1% due to immersive retail conversion demand.
In 2025, Virtual Showrooms and Dealerships held a dominant market position in the By Application segment of the Automotive Metaverse Market, with a 30.1% share. Automakers invest in virtual retail because immersive configuration experiences shorten decision cycles and reduce physical showroom overhead. EU roads carried 256 Million passenger cars in 2024, a 1.4% annual increase, confirming a large and active buyer population that virtual retail tools can engage before and after the physical purchase.
Training, Simulation and Testing represents the second application by share, serving OEM engineering teams, factory operators, and dealer technicians who require scalable and repeatable skill-building environments. Virtual training reduces reliance on physical rigs and live vehicles, cutting both cost and risk during new model launches. This application is directly tied to workforce investment trends, and Microsoft stated it was on track to invest $50 Billion by the end of the decade to expand AI access across Global South countries, a program that will expand the talent pool addressable by automotive metaverse training platforms.
Design and Prototyping and Engineering captures the third application position, enabling cross-functional teams to review and iterate on vehicle geometry, ergonomics, and subsystem integration without physical prototype commitments. Faster iteration cycles lower program costs and reduce time to production sign-off. In-Vehicle Experiences and Others, including Marketing, Advertising and Customer Engagement, hold the remaining share collectively.
End-user Analysis
OEMs dominate with 41.1% due to large-scale digital-twin and engineering investment.
In 2025, OEMs held a dominant market position in the By End-user segment of the Automotive Metaverse Market, with a 41.1% share. OEMs drive the largest budget allocations because automotive metaverse platforms address core engineering, production, and retail challenges at enterprise scale. Global motor-vehicle sales reached 99.8 Million units in 2025, a 4.7% increase, giving OEMs greater revenue to reinvest in digital platform infrastructure across design, manufacturing, and distribution channels.
Aftermarket operators and dealers form the second end-user group, using metaverse tools for virtual parts visualization, technician upskilling, and immersive customer engagement at the point of service. This segment benefits directly from the OEM digital investments that create compatible data assets and standardized platform interfaces. As dealer channel resistance remains a near-term friction point, vendors that reduce integration complexity for dealer management systems will capture aftermarket share faster.
Passenger Car and Commercial Vehicle end-users represent the consumer and fleet-facing side of the market, where in-vehicle experience platforms and fleet management command centers are the primary use cases. Electric-car sales exceeded 20 Million worldwide in 2025, up 20% year over year, with electric cars representing 25% of all new cars sold. This electrification wave creates a structurally new in-vehicle software environment that automotive metaverse platforms can populate with interactive services and dynamic content.
Key Market Segments
By Component
- Software
- Hardware
- Services
By Technology
- Virtual Reality (VR)
- Augmented Reality (AR)
- Mixed / Extended Reality (MR/XR)
- Others
- Blockchain & NFTs
- Others
By Application
- Virtual Showrooms & Dealerships
- Training, Simulation & Testing
- Design & Prototyping / Engineering
- In-Vehicle Experiences
- Others
- Marketing, Advertising & Customer Engagement
- Others
By End-user
- OEMs
- Aftermarket / Dealers
- Passenger Cars
- Commercial Vehicles
Regional Analysis
North America Dominates the Automotive Metaverse Market with a Market Share of 31.1%, Valued at USD 1.35 Billion
North America leads the global Automotive Metaverse Market with a 31.1% share valued at USD 1.35 Billion in 2025. The region’s position reflects concentrated OEM technology budgets, dense Tier 1 supplier networks, and mature cloud infrastructure that supports real-time rendering at scale. Average energy prices were forecast to increase 24% in 2026 due to oil and natural-gas supply shortfalls, adding cost pressure that makes virtual prototyping and remote collaboration tools more financially attractive for North American manufacturers.
Asia Pacific is the fastest-growing regional market, driven by China’s commanding role in global EV production and the region’s expanding OEM and supplier base. East Asia and Pacific economic growth was projected at 4.4% in 2026, while South Asia growth was projected at 6.2%, providing a favorable demand environment for automotive digital platform investment. Microsoft announced a USD 17.5 Billion four-year investment in Indian cloud and AI infrastructure for calendar years 2026 to 2029, directly expanding the compute base that automotive metaverse platforms in the region depend on.
Europe holds a structurally important position as home to leading OEM engineering programs and stringent regulatory requirements that incentivize virtual validation. European electric-car sales increased by more than 30% in 2025 and reached 28% of total car sales, expanding the EV-specific engineering and retail use cases for metaverse tools across the region. Europe and Central Asia growth was projected at 2.4% in 2026, signaling a measured but stable investment environment for automotive digital programs.
Key Regions and Countries
North America
- US
- Canada
Europe
- Germany
- France
- The UK
- Spain
- Italy
- Rest of Europe
Asia Pacific
- China
- Japan
- South Korea
- India
- Australia
- Rest of APAC
Latin America
- Brazil
- Mexico
- Rest of Latin America
Middle East and Africa
- GCC
- South Africa
- Rest of MEA
Drivers
Rising electronic-content density, battery-system complexity, and faster vehicle-refresh cycles are making physical prototype-heavy development less economical. Manufacturers and suppliers are shifting toward persistent virtual representations of vehicle architectures, production cells, and validation environments. Reducing one late-stage physical prototype loop by roughly 10% to 20% can avoid multi-month validation rework and improve program launch readiness.
This shift from project-based simulation spending toward recurring platform, compute, and digital-content subscriptions supports an estimated +4.2% incremental contribution to the 31.7% baseline CAGR. Immersive retail experiences, software-defined vehicle launches, and industrial metaverse workforce training each add further upside, with EV configuration complexity adding an additional +1.8%. Vendors that align product roadmaps to these compounding drivers will capture the most defensible contract positions.
| Driver | (~) % Impact on CAGR Forecast | Geographic Relevance | Impact Timeline |
|---|---|---|---|
| Digital-twin vehicle engineering | +4.2% | North America, Europe, China, Japan, South Korea | Short term (≤ 2 years) |
| Immersive retail conversion | +3.4% | North America, Western Europe, China, Gulf markets | Short term (≤ 2 years) |
| Software-defined vehicle launches | +3.1% | China, North America, Europe, Japan, South Korea | Medium term (2–4 years) |
| Industrial metaverse workforce training | +2.5% | Germany, United States, Japan, China, India | Short term (≤ 2 years) |
| Connected-car service ecosystems | +2.2% | China, North America, Europe, India | Medium term (2–4 years) |
| EV configuration complexity | +1.8% | Europe, China, North America, India | Short term (≤ 2 years) |
Restraints
The core restraint is the inability of many automotive metaverse deployments to demonstrate a repeatable revenue or cost-saving case at enterprise scale. Immersive retail experiences can raise engagement yet still depend on expensive content refreshes, device support, identity management, and integration with dealer-management, finance, and inventory systems. Where annualized platform and cloud-rendering costs consume roughly 1% to 3% of a digital-commercial budget without measurable conversion or retention benefit within 12 to 24 months, chief financial officers defer multi-site rollouts.
This monetization uncertainty creates the largest near-term deduction of approximately -3.8% from the 31.7% baseline CAGR. Automotive CapEx prioritization, consumer headset adoption limits, fragmented data-rights rules, and cybersecurity compliance burden each add further drag. Vendor pricing power contracts as a result, shifting procurement toward shorter contracts and outcome-linked fees.
| Restraint | (~) % Impact on CAGR Forecast | Geographic Relevance | Impact Timeline |
|---|---|---|---|
| Uncertain metaverse monetization | -3.8% | Global, especially mature automotive markets | Short term (≤ 2 years) |
| Automotive CapEx prioritization | -3.2% | Europe, North America, Japan, South Korea | Short term (≤ 2 years) |
| Consumer headset adoption limits | -2.7% | Global, especially price-sensitive markets | Medium term (2–4 years) |
| Fragmented data-rights rules | -2.4% | Europe, China, North America | Medium term (2–4 years) |
| Cybersecurity compliance burden | -2.1% | Europe, Japan, South Korea, United Kingdom | Short term (≤ 2 years) |
| Dealer channel resistance | -1.6% | North America, Europe, India | Short term (≤ 2 years) |
Challenges
Automotive metaverse applications depend on a continuous and trustworthy digital thread spanning design engineering, supplier part records, manufacturing execution, quality data, vehicle configuration, and after-sales service. These data sets commonly reside in incompatible product-lifecycle, enterprise-resource, manufacturing, and dealer systems. Even a low single-digit rate of stale or mismatched data can undermine simulation accuracy, force manual reconciliation, and lengthen deployment cycles by 6 to 18 months.
The resulting estimated -3.0% friction drag does not halt current visualization and training sales, but requires long-run investment in data governance, master-data ownership, APIs, and common ontologies. Real-time rendering latency and spatial-computing talent scarcity add further drag of -2.6% and -2.3% respectively. Firms that fail to address interoperability face recurring integration costs and weakened digital-twin credibility across future vehicle programs.
| Challenge | (~) % CAGR Friction Drag | Geographic Relevance | Mitigation Horizon |
|---|---|---|---|
| Interoperable digital-thread integration | -3.0% | Global manufacturing hubs | Long term (≥ 4 years) |
| Real-time rendering latency | -2.6% | Global, with rural-network exposure | Medium term (2–4 years) |
| Spatial-computing talent scarcity | -2.3% | North America, Europe, India, China, Japan | Medium term (2–4 years) |
| Legacy plant-system connectivity | -2.0% | Europe, North America, Japan, India | Long term (≥ 4 years) |
| High-fidelity content maintenance | -1.8% | Global | Medium term (2–4 years) |
| Cross-border cloud localization | -1.5% | China, Europe, India, Middle East | Long term (≥ 4 years) |
Opportunities
Fleet lifecycle command centers represent future white space because most immersive automotive deployments still focus on vehicle design, factory visualization, or consumer retail rather than monetizing operational digital twins across mixed fleets. A platform combining live vehicle telemetry, maintenance history, route context, repair workflows, and spatial visualization can shift value capture from one-time software implementation to recurring per-asset subscriptions. Avoiding even 5% to 10% of unplanned downtime can materially improve fleet unit economics.
Reusable fleet templates reduce customer onboarding cost per vehicle by an estimated 20% to 35%, while shared software layers could expand gross-margin potential by roughly 5 to 12 percentage points relative to bespoke projects. Successful execution could add approximately +4.0% to the baseline CAGR. Usage-based immersive commerce and virtual aftermarket diagnostics offer further upside of +3.3% and +2.8% respectively for early movers that price against measurable outcomes.
| Opportunity | (~) % Potential CAGR Upside | Geographic Relevance | Execution Window |
|---|---|---|---|
| Fleet lifecycle command centers | +4.0% | North America, Europe, China, India, Gulf markets | Medium term (2–4 years) |
| Usage-based immersive commerce | +3.3% | China, North America, Europe, India | Medium term (2–4 years) |
| Virtual aftermarket diagnostics | +2.8% | North America, Europe, China, India, Latin America | Medium term (2–4 years) |
| Cross-brand training platforms | +2.4% | Global manufacturing and service markets | Short term (≤ 2 years) |
| Mobility-insurance simulations | +2.0% | Europe, North America, Japan, South Korea | Long term (≥ 4 years) |
| Certified used-vehicle twins | +1.7% | North America, Europe, China, India | Medium term (2–4 years) |
Key Company Insights
NVIDIA Corporation reported fiscal-year 2026 automotive and robotics revenue of USD 2.3 Billion, up 39% year over year, with fourth-quarter automotive revenue alone reaching $604 Million. NVIDIA also expanded the DRIVE Hyperion ecosystem to include suppliers such as Bosch, Magna, and ZF Group. This positions NVIDIA as the dominant compute infrastructure provider for automotive metaverse engineering and autonomous-vehicle programs globally.
Microsoft Corporation generated USD 331.8 Billion in fiscal-year 2026 revenue, an 18% increase, with cloud revenue of USD 214.4 Billion, up 27%. This cloud scale gives Microsoft structural leverage to embed Azure-based metaverse rendering and AI services into OEM digital programs at enterprise contract size. China accounted for nearly 75% of electric cars produced globally in 2025, a market concentration that creates demand for cloud-based EV engineering and simulation platforms where Microsoft competes directly.
Key Players
- NVIDIA Corporation
- Microsoft Corporation
- Roblox Corporation
- Unity Technologies
- Meta Platforms, Inc.
- WayRay AG
- BMW Group
- Mercedes-Benz Group AG
- Toyota Motor Corporation
- Ford Motor Company
- General Motors Company (GM)
- Hyundai Motor Company / Hyundai Motor Group
- Volvo Car AB
- holoride GmbH
- Varjo Technologies Oy
- Others
Recent Developments
- February 2026 – NVIDIA Corporation expanded the NVIDIA DRIVE Hyperion ecosystem to include suppliers such as Aeva, AUMOVIO, Astemo, Arbe, Bosch, Hesai, Magna, Omnivision, Quanta, Sony, and ZF Group, alongside reporting fiscal-year 2026 automotive and robotics revenue of USD 2.3 Billion, up 39% year over year.
- January 2026 – Meta Platforms, Inc. launched AI Glasses Impact Grants totaling nearly USD 2 Million, consisting of 15 accelerator grants of USD 25,000, 10 grants of USD 50,000, and 5 catalyst grants to support immersive technology development.
- July 2025 – Meta Platforms, Inc. opened a USD 16 Million audio research lab in Cambridge, United Kingdom, expanding its spatial audio and immersive computing research capabilities.
- November 2023 – Microsoft Corporation committed GBP 2.5 Billion (approximately USD 3.2 Billion) over three years to UK next-generation AI datacentre infrastructure, including more than 20,000 advanced GPUs by 2026, strengthening the compute backbone for enterprise metaverse applications.
Report Scope
| Report Features | Description |
|---|---|
| Market Value (2025) | USD 5.7 Billion |
| Forecast Revenue (2035) | USD 67.9 Billion |
| CAGR (2026-2035) | 31.7% |
| Base Year for Estimation | 2025 |
| Historic Period | 2020-2024 |
| Forecast Period | 2026-2035 |
| Report Coverage | Revenue Forecast, Market Dynamics, Market Opportunity Analysis, Technology and Innovation Landscape, Competitive Landscape, Recent Developments |
| Segments Covered | By Component (Software, Hardware, Services), By Technology (Virtual Reality (VR), Augmented Reality (AR), Mixed / Extended Reality (MR/XR), Others including Blockchain & NFTs), By Application (Virtual Showrooms & Dealerships, Training, Simulation & Testing, Design & Prototyping / Engineering, In-Vehicle Experiences, Others), By End-user (OEMs, Aftermarket / Dealers, Passenger Cars, Commercial Vehicles) |
| Regional Analysis | North America (US and Canada), Europe (Germany, France, The UK, Spain, Italy, and Rest of Europe), Asia Pacific (China, Japan, South Korea, India, Australia, and Rest of APAC), Latin America (Brazil, Mexico, and Rest of Latin America), Middle East and Africa (GCC, South Africa, and Rest of MEA) |
| Competitive Landscape | NVIDIA Corporation, Microsoft Corporation, Roblox Corporation, Unity Technologies, Meta Platforms Inc., WayRay AG, BMW Group, Mercedes-Benz Group AG, Toyota Motor Corporation, Ford Motor Company, General Motors Company (GM), Hyundai Motor Company / Hyundai Motor Group, Volvo Car AB, holoride GmbH, Varjo Technologies Oy, Others |
| Customization Scope | Customization for segments, region/country-level will be provided. Additional customization can be done based on requirements. |
| Purchase Options | We have three licenses to opt for: Single User License, Multi-User License (Up to 5 Users), Corporate Use License (Unlimited User and Printable PDF) |





































