


Report Overview
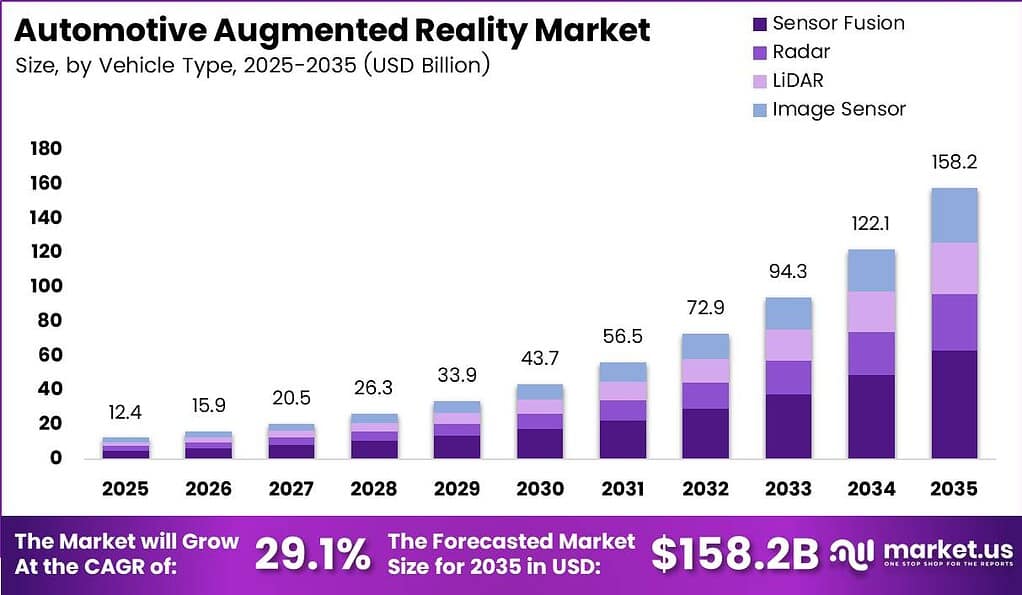
Global Automotive Augmented Reality Market size is expected to be worth around USD 158.2 Billion by 2035 from USD 12.4 Billion in 2025, growing at a CAGR of 29.1% during the forecast period 2026 to 2035.
The automotive augmented reality market covers hardware, software, and integration systems that project real-time data overlays onto vehicle windshields and combiner displays. These systems span heads-up display navigation, adaptive cruise control visualization, lane departure warnings, and sensor-fused safety interfaces. The market serves passenger car OEMs, commercial vehicle manufacturers, and Tier 1 automotive suppliers across global production platforms.
Key Takeaways
- The global automotive augmented reality market was valued at USD 12.4 Billion in 2025 and is forecast to reach USD 158.2 Billion by 2035.
- The market grows at a CAGR of 29.1% during the forecast period 2026 to 2035.
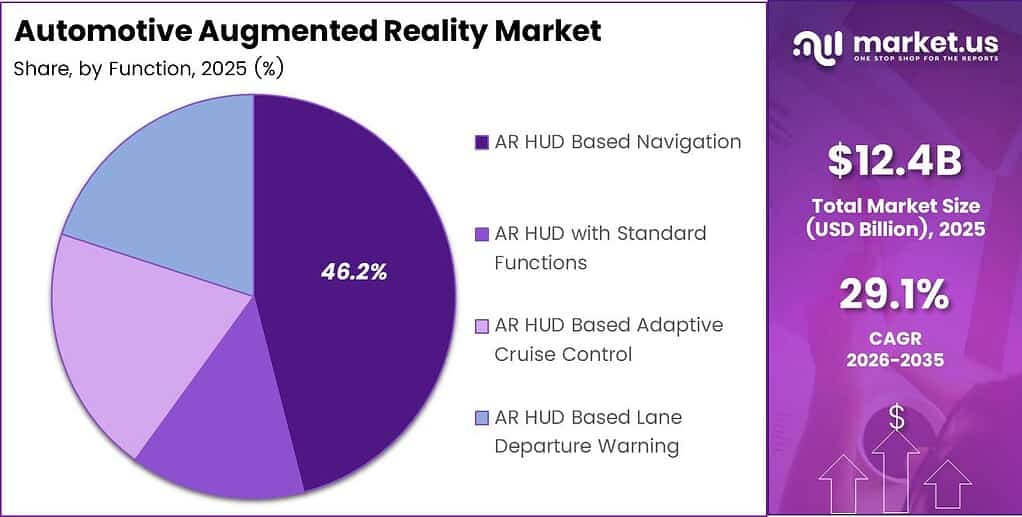
- By Function, AR HUD Based Navigation dominates with a 46.21% share in 2025.
- By Sensor Technology, Sensor Fusion holds the leading position with a 38.00% share.
- By Display Technology, Windshield display leads with a 57.21% share.
- By Vehicle Type, Passenger Cars account for 72.20% of total market share.
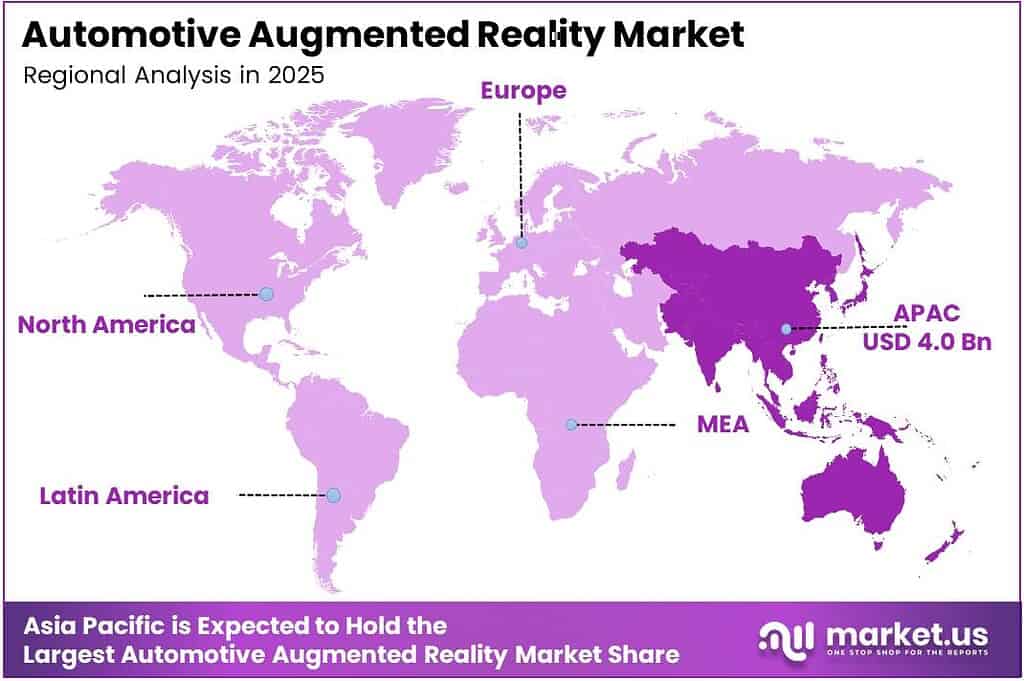
- Asia-Pacific is the dominant region with a 32.78% share, valued at USD 4.0 Billion in 2025.
EU safety rules extended mandatory assistance systems to all new vehicles on 7 July 2024, with the framework expected to prevent more than 25,000 deaths and at least 140,000 serious injuries by 2038. This regulatory shift moves AR HUD from a premium option to a standard safety interface. Suppliers who establish compliant AR platforms now will secure long-term design wins before the window closes.
According to the ACEA, global car production increased 4.2% to 78.7 million units in 2025. This volume expansion directly scales the addressable installation base for factory-fit AR systems. OEMs integrating AR at the platform level benefit from declining per-unit costs as output grows.
As reported by the IEA, global electric-car sales increased by more than 20% to 21 million units in 2025, representing 1 in 4 cars sold. Electric vehicle architectures favor AR integration through their software-defined cockpit designs and available compute headroom. This positions AR HUD adoption to accelerate alongside EV penetration across all major markets. In June 2025, Bosch announced plans to invest more than €2.5 Billion in artificial intelligence by the end of 2027, signaling that leading Tier 1 suppliers are aligning AI and AR development cycles.
Function Analysis
AR HUD Based Navigation dominates with 46.21% due to primary driver demand for real-time routing overlays.
In 2025, AR HUD Based Navigation held a dominant market position in the By Function segment of the Automotive Augmented Reality Market, with a 46.21% share. According to the WHO, approximately 1.16 million people die in road-traffic crashes annually. This fatality burden creates strong OEM and regulatory pressure to deploy navigation systems that keep driver attention on the road rather than on screen-based maps.
AR HUD Based Adaptive Cruise Control serves a distinct role by projecting following-distance and speed data directly into the driver’s forward line of sight. As per our research, NHTSA recommends individual off-road glances of no more than 2 seconds and cumulative off-road glances of no more than 12 seconds for in-vehicle tasks. AR-based cruise control displays eliminate the need for drivers to divert their gaze entirely, keeping interactions within these safety thresholds.
AR HUD Based Lane Departure Warning is the fastest-growing sub-segment within the By Function category. Data from IIHS shows lane-departure warning reduced relevant single-vehicle, sideswipe, and head-on crashes by 11% and injury crashes of those types by 21%. These documented safety outcomes give regulators and fleet buyers a clear performance baseline, accelerating procurement decisions in both passenger and commercial segments.
AR HUD with Standard Functions serves vehicles where full AR navigation or ADAS overlays are not yet configured. NHTSA data shows crashes involving distracted drivers killed 3,208 people and injured 315,167 people in the United States in 2024. Even standard-function HUDs reduce distraction risk by surfacing speed, fuel level, and alert data without requiring any screen interaction. In May 2025, Bosch Ventures launched a venture-capital fund worth approximately €250 Million, directing capital toward emerging cockpit and safety display technologies that will enter production across these entry-level function tiers.
Sensor Technology Analysis
Sensor Fusion dominates with 38.00% due to its ability to combine multiple data inputs for reliable overlays.
In 2025, Sensor Fusion held a dominant market position in the By Sensor Technology segment of the Automotive Augmented Reality Market, with a 38.00% share. DENSO research found that fusing LiDAR with an image classifier reduced false positives by a factor of 2 and processing time by a factor of 4. These combined efficiency gains make sensor fusion the preferred architecture for AR systems that require both speed and precision in object detection.
Radar-based systems remain integral to mid-tier AR platforms that require long-range detection without the cost premium of LiDAR. As per our research, Bosch automotive radar sensors provide detection ranges of up to 300 metres. DENSO’s millimetre-wave radar achieved a 205-metre detection distance and a ±18-degree detection radius within 35 metres, compared with 151 metres and ±10 degrees for its prior product. These advances extend usable detection geometry, allowing AR overlays to flag hazards earlier and with wider spatial coverage.
LiDAR is the fastest-growing sensor sub-segment, driven by its superior depth-mapping capability in complex traffic environments. The Luminar Iris LiDAR used in the Volvo EX90 can detect and classify objects at a maximum range of 600 metres, as reported by SAE. This range exceeds radar performance in object classification tasks, making LiDAR the preferred sensor for premium AR platforms targeting Level 3 and above automation. In July 2026, Mitsubishi Electric announced a $10 Million investment in satellite-radar developer Array Labs, extending its sensor technology portfolio into adjacent detection domains. By December 2024, Hesai had planned annual LiDAR production capacity exceeding 2 million units for 2025, reflecting rapid scaling across the LiDAR supply chain.
Image Sensor technology supports AR systems focused on visual lane recognition, sign detection, and camera-based object classification where cost constraints limit full sensor fusion deployment. These sensors hold the remaining share alongside Radar in vehicle programs where total system cost governs platform decisions rather than maximum sensor performance.
Display Technology Analysis
Windshield display dominates with 57.21% due to its large field of view and direct forward-projection advantage.
In 2025, Windshield display held a dominant market position in the By Display Technology segment of the Automotive Augmented Reality Market, with a 57.21% share. According to Panasonic Automotive Systems, it offers two principal HUD configurations: windshield HUD and combiner HUD. The windshield format provides a larger display area and integrates more naturally with full AR overlay requirements, making it the preferred choice for OEMs designing ADAS-integrated cockpits. In March 2024, Panasonic Automotive Systems supplied Mazda’s CX-70 with a full-display meter using a 12.3-inch display, demonstrating active adoption of large-format windshield display solutions.
Combiner display technology holds a durable position in the market by offering lower installation cost and less dependence on specialized windshield lamination. Combiner systems suit volume-market vehicles where full windshield AR integration remains cost-prohibitive, providing a viable path for AR adoption across mid-market and entry-level passenger car segments.
Waveguide display is the fastest-growing sub-segment within By Display Technology. As reported by Continental, its waveguide AR-HUD required approximately 10 litres of installation volume, compared with around 30 litres for a conventional mirror-based AR-HUD. This 67% reduction in packaging volume resolves one of the core engineering barriers to AR HUD adoption across compact and mid-size vehicle platforms. Visteon’s windshield AR-HUD produced a 10-degree by 4-degree image, nearly twice the size of HUD images used in production vehicles at the time, as noted by SAE. In February 2025, TCL CSOT unveiled a 3D AR-HUD with an 11-degree by 5.4-degree field of view and a 12-litre optical assembly, further compressing system volume while expanding visual coverage.
Vehicle Type Analysis
Passenger Cars dominate with 72.20% due to higher unit volumes and premium feature adoption rates.
In 2025, Passenger Cars held a dominant market position in the By Vehicle Type segment of the Automotive Augmented Reality Market, with a 72.20% share. As per our research, Indian passenger-vehicle sales reached a record 4.3 million units in FY2024–25, increasing 2% from the previous year. Rising sales volumes in high-growth markets like India expand the addressable platform base for factory-fit AR systems beyond traditional premium-car buyers.
Commercial Vehicles are the fastest-growing sub-segment within By Vehicle Type, as fleet operators increasingly recognize AR’s potential for reducing collision and lane-deviation incidents in professional driving environments. According to the ACEA, vans represent almost 80% of EU commercial-vehicle sales, while more than 7% of vans sold are electrically chargeable. The electrification of commercial fleets creates new software-defined cockpit architectures that are structurally compatible with AR HUD integration. In March 2026, Valeo broke ground on a $225 Million, 337,000-square-foot software-defined-vehicle technology plant in McAllen, Texas, targeting the commercial and passenger vehicle segments simultaneously and signaling Tier 1 investment in the infrastructure needed to scale AR at volume.
Key Market Segments
By Function
- AR HUD Based Navigation
- AR HUD with Standard Functions
- AR HUD Based Adaptive Cruise Control
- AR HUD Based Lane Departure Warning
By Sensor Technology
- Sensor Fusion
- Radar
- LiDAR
- Image Sensor
By Display Technology
- Combiner
- Windshield
- Wave-guide
By Vehicle Type
- Passenger Cars
- Commercial Vehicles
Regional Analysis
Asia-Pacific Dominates the Automotive Augmented Reality Market with a Market Share of 32.78%, Valued at USD 4.0 Billion
Asia-Pacific leads all regions with a 32.78% share of the automotive augmented reality market in 2025, valued at USD 4.0 Billion. Data from OICA shows Asia-Pacific vehicle production increased 7.6% to approximately 59.2 million units in 2025, accounting for more than 61% of global output. This production dominance gives regional OEMs and Tier 1 suppliers greater scale to integrate AR systems at lower per-unit cost than any other region. In March 2026, Toyota adopted Panasonic Automotive Systems’ infotainment platform with 12.9-inch and 10.5-inch display options for the 2026 RAV4, confirming active AR display integration across mainstream passenger vehicle platforms in the region.
Europe represents a critical demand center for automotive AR, driven by mandatory ADAS safety frameworks and strong OEM investment in premium cockpit technology. Figures from the ACEA show the EU passenger-car fleet increased 1.4% to approximately 256 million cars in 2024, providing a large and growing installed base that regulators are actively targeting with updated safety and HMI requirements. In April 2024, Hyundai Mobis announced a KRW 170 Billion investment in a 50,000-square-metre Spanish plant capable of producing 360,000 battery systems annually, reinforcing European production capacity tied to electrified platforms where AR integration is most viable.
North America’s market activity is anchored by federal safety regulations that directly create demand for AR-compatible display systems. As per our research, NHTSA final data show 39,254 people died in United States traffic crashes in 2024, and NHTSA projects that FMVSS No. 127 will save at least 360 lives and prevent at least 24,000 injuries annually. SIAM data shows Indian passenger-vehicle sales reached a record 4.3 million units in FY2024–25, reflecting South Asian market expansion that is beginning to attract AR system localization investment from global Tier 1 suppliers.
Key Regions and Countries
North America
- US
- Canada
Europe
- Germany
- France
- The UK
- Spain
- Italy
- Rest of Europe
Asia Pacific
- China
- Japan
- South Korea
- India
- Australia
- Rest of APAC
Latin America
- Brazil
- Mexico
- Rest of Latin America
Middle East and Africa
- GCC
- South Africa
- Rest of MEA
Market Dynamics
Market Opportunity Analysis - Underserved vehicle types, emerging markets, and post-sale software models offer entry points for new players
Commercial Vehicles hold the fastest-growing position within By Vehicle Type yet remain underrepresented in current AR system deployments relative to their crash exposure and fleet scale. Fleet operators in logistics and freight face sustained regulatory pressure on driver safety in the EU, North America, and China, but factory-fit AR for commercial platforms remains a developing segment. Suppliers who establish commercial-grade AR interfaces now face less incumbent competition than in the passenger car space.
The waveguide display sub-segment is the fastest-growing display technology but trails windshield displays in current deployment at 57.21% versus waveguide’s emerging share. Waveguide’s 67% packaging volume reduction versus conventional mirror-based systems removes the primary hardware barrier for compact vehicle platforms. New entrants with waveguide optical expertise can target the volume mid-market rather than competing on premium windshield programs dominated by established Tier 1 suppliers.
Emerging markets in India, Southeast Asia, and Latin America represent a further underpenetrated opportunity for localized AR guidance systems. Indian passenger-vehicle sales reached a record 4.3 million units in FY2024–25, yet factory-fit AR adoption in the market remains early-stage relative to Europe and China. Suppliers who develop cost-adapted AR systems for mid-market passenger vehicles in these regions gain a structural first-mover position before global Tier 1 incumbents standardize entry-level AR offerings.
The AR feature subscription model remains largely unrealized across current production vehicles. A post-sale software layer targeting an attach rate of 8–12% with software gross margins of 65–75% would generate recurring revenue that offsets hardware content cost and shortens platform payback by an estimated 18–24 months. This model suits new entrants and software-first players who lack the scale to compete on hardware alone but can build differentiated feature catalogs on existing AR-ready platforms.
Technology and Innovation Landscape - Sensor fusion, waveguide optics, and AI-driven AR processing define the next competitive edge
Sensor fusion is the dominant technology architecture for AR system accuracy, combining radar, LiDAR, and image sensor data into unified object overlays. DENSO research established that fusing LiDAR with an image classifier reduced false positives by a factor of 2 and processing time by a factor of 4. These gains directly reduce the computational load on in-vehicle processors and lower the latency risk that constrains real-time AR overlay performance.
Waveguide display technology is redefining the installation economics of AR HUD systems. Continental’s waveguide AR-HUD required approximately 10 litres of installation volume versus around 30 litres for a conventional mirror-based system. This compression in packaging volume eliminates a core engineering constraint that previously excluded compact and mid-size platforms from AR HUD integration, opening a substantially larger addressable platform base for waveguide-capable suppliers.
LiDAR production scaling is transforming sensor availability and cost curves across the AR supply chain. Hesai announced plans to double annual LiDAR output from 2 million to more than 4 million units during 2026, and RoboSense delivered 120,000 digital LiDAR units in a single month in October 2025. This volume growth accelerates cost reduction for LiDAR-enabled AR platforms and expands the addressable vehicle segments beyond premium and Level 3 autonomous programs.
Artificial intelligence integration is becoming a structural component of AR system development, particularly for real-time object classification and overlay rendering. Bosch committed more than €2.5 Billion in AI investment by the end of 2027, targeting ADAS and cockpit computing applications directly relevant to AR HUD performance. AI-enabled AR systems can adapt overlay content to road conditions, traffic density, and driver attention state, creating a differentiation layer that pure optical hardware cannot replicate.
Drivers
EU safety rules extended mandatory assistance systems to all new vehicles on 7 July 2024, with the framework projected to prevent more than 25,000 deaths and at least 140,000 serious injuries by 2038. The revised 2026 European safety-assessment protocols, announced in November 2025, added stronger scrutiny of driver monitoring, control clarity, and real-world HMI performance. This regulatory progression shifts AR HUD from a premium option to a required safety interface, creating durable platform-level demand across all new vehicle programs.
Against the baseline CAGR of 29.1%, ADAS visualization mandates contribute an estimated +1.6% by enabling reusable software licensing, shared sensor architectures, and lower engineering cost per vehicle program. Software-defined cockpit growth adds an estimated +1.2%, with demand concentrated in China, the EU, North America, and South Korea. Premium cockpit competition contributes +1.0%, particularly across China and global premium platforms where differentiation drives faster AR feature adoption.
| Driver | (~) % Impact on CAGR Forecast | Geographic Relevance | Impact Timeline |
|---|---|---|---|
| ADAS visualization mandates | +1.6% | EU-led, global export platforms | Short term (≤ 2 years) |
| Software-defined cockpit growth | +1.2% | China, EU, North America, Korea | Medium term (2–4 years) |
| Premium cockpit feature competition | +1.0% | China and premium global platforms | Short term (≤ 2 years) |
| High-precision map availability | +0.8% | North America, EU, China, Japan | Short term (≤ 2 years) |
| Asian vehicle production scale | +0.7% | Asia-Pacific led | Medium term (2–4 years) |
| Safety-oriented HMI demand | +0.6% | Global urban passenger vehicles | Medium term (2–4 years) |
Restraints
The structural cost barrier in automotive AR originates in the simultaneous requirement for long virtual-image distance, wide projection coverage, high luminance, automotive thermal tolerance, and compact dashboard packaging. Technical research recommends virtual-image distances above 10 metres and ideally beyond 20 metres, while an experimental varifocal system still occupied approximately 9.8 litres. These requirements multiply projector, coated-windshield, compute, cooling, tooling, and vehicle-specific engineering content, blocking price-sensitive programs from clearing internal take-rate and payback thresholds.
The modeled effect of high optical system cost is a -1.8% deduction from the 29.1% baseline CAGR, with premature volume launches potentially compressing vehicle-program gross margins by approximately 150–250 basis points or delaying tooling expenditure by one model cycle. Windshield redesign dependence adds a further -1.3% drag, and field-of-view approval limits in EU and UNECE markets subtract an additional -0.9% in the near term.
| Restraint | (~) % Impact on CAGR Forecast | Geographic Relevance | Impact Timeline |
|---|---|---|---|
| High optical system cost | -1.8% | Global volume-vehicle segments | Short term (≤ 2 years) |
| Windshield redesign dependence | -1.3% | Global vehicle platforms | Medium term (2–4 years) |
| Field-of-view approval limits | -0.9% | EU and UNECE markets | Short term (≤ 2 years) |
| Concentrated optical sourcing | -0.7% | East Asia and global platforms | Short term (≤ 2 years) |
| Retrofit incompatibility | -0.5% | Global installed vehicle fleet | Long term (≥ 4 years) |
| Repair and insurance economics | -0.4% | North America and EU | Short term (≤ 2 years) |
Challenges
AR graphics must remain spatially aligned while vehicle speed, road geometry, eye position, camera input, localization, and steering angle change simultaneously. Experimental work in 2026 used display latency below 66.6 milliseconds yet still identified task-dependent differences in visual search and cognitive workload. European on-road assessment expanded from a historical route of roughly 100 kilometres to more than 2,000 kilometres across at least 3 countries, using lidar, radar, and cameras to generate ground-truth observations.
Sensor-to-overlay latency control creates an estimated -1.4% friction drag on maximum CAGR and requires sustained investment in deterministic edge computing, time-synchronized sensor fusion, digital-twin calibration, and fail-operational rendering. Cross-variant optical calibration adds a further -1.1% drag across global multi-model platforms, and sunlight and thermal stability challenges subtract an additional -0.9%, particularly in hot-climate markets where optical performance degrades without specialized coatings.
| Challenge | (~) % CAGR Friction Drag | Geographic Relevance | Mitigation Horizon |
|---|---|---|---|
| Sensor-to-overlay latency control | -1.4% | Global automated-driving platforms | Medium term (2–4 years) |
| Cross-variant optical calibration | -1.1% | Global multi-model platforms | Medium term (2–4 years) |
| Sunlight and thermal stability | -0.9% | Global, especially hot climates | Medium term (2–4 years) |
| Automotive optical yield variability | -0.7% | East Asian manufacturing hubs | Medium term (2–4 years) |
| AR validation talent scarcity | -0.5% | Global engineering centres | Long term (≥ 4 years) |
| Cybersecure update orchestration | -0.4% | EU, North America, China | Medium term (2–4 years) |
Opportunities
Most installed AR systems bundle static navigation and warning functions into the original vehicle price, while the cross-industry interoperability work formalized in 2025 focused on enabling connected and edge-computing services rather than establishing paid AR catalogs. An executable AR subscription model would activate lane-level guidance, low-visibility enhancement, parking visualization, and performance overlays after purchase. This model targets an initial paid attach rate of 8–12% and annual revenue of approximately €30–€60 per subscribing vehicle, with software gross margins of 65–75%.
At scale, AR feature subscriptions could add approximately +1.2% above the 29.1% baseline CAGR and shorten platform payback by an estimated 18–24 months without relying solely on higher new-vehicle option prices. Factory-fit commercial safety AR adds an estimated +0.9% upside across the EU, North America, and China. Vehicle-to-everything hazard overlays represent a further +0.7% potential CAGR upside in connected-vehicle infrastructure markets where V2X communication is gaining regulatory support.
| Opportunity | (~) % Potential CAGR Upside | Geographic Relevance | Execution Window |
|---|---|---|---|
| AR feature subscriptions | +1.2% | Global connected-vehicle markets | Medium term (2–4 years) |
| Factory-fit commercial safety AR | +0.9% | EU, North America, China | Long term (≥ 4 years) |
| Vehicle-to-everything hazard overlays | +0.7% | China, EU, North America | Long term (≥ 4 years) |
| Holographic windshield platforms | +0.5% | Premium global platforms | Long term (≥ 4 years) |
| Localized emerging-market guidance | +0.3% | India, Southeast Asia, Latin America | Medium term (2–4 years) |
| Insurance-linked risk services | +0.2% | North America and EU | Medium term (2–4 years) |
Key Company Insights
Robert Bosch GmbH generated €91.0 Billion in sales and spent €7.9 Billion on research and development in 2025, giving it one of the largest R&D bases among global automotive Tier 1 suppliers. NHTSA final data show 39,254 people died in US traffic crashes in 2024, and FMVSS No. 127 is projected to save at least 360 lives annually. Bosch’s ADAS investment scale positions it to capture mandatory safety display contracts before competitors reach equivalent engineering depth. In April 2026, Bosch announced an investment of approximately €200 Million in Bosch Business Innovations over five years, extending its hardware-to-software pivot.
Continental AG reported €19.7 Billion in consolidated sales in 2025, down 2.0% from €20.1 Billion in 2024, reflecting revenue pressure as it repositions toward higher-margin software and display technology segments. Continental’s waveguide AR-HUD required approximately 10 litres of installation volume versus around 30 litres for conventional mirror-based systems, a structural packaging advantage that lowers integration cost for vehicle platform teams. This volume reduction enables adoption across compact car programs that previously could not accommodate AR HUD hardware. However, in July 2026, Continental agreed to sell ContiTech to an affiliate of Lone Star Funds for €4.0 Billion, signaling a sharper focus on its core automotive electronics and display business.
Key Players
- Robert Bosch GmbH
- Continental AG
- Denso Corporation
- Panasonic Corporation
- Visteon Corporation
- Valeo SA
- Nippon Seiki Co. Ltd.
- WayRay AG
- Hyundai Mobis
- Mojo Vision
- Mitsubishi Electric Corporation
- Yazaki Corporation
- Other Key Players
Recent Developments
- April 10, 2026 – Bosch and Qualcomm expanded their partnership to ADAS solutions after Bosch delivered more than 10 million Snapdragon-based cockpit computers.
- July 4, 2026 – Continental agreed to sell ContiTech to an affiliate of Lone Star Funds for €4.0 Billion, plus performance-based components of up to €250 Million.
- January 5, 2026 – Hesai announced plans to double its annual LiDAR production capacity from 2 million to more than 4 million units during 2026.
- July 29, 2025 – Aeva and LG Innotek formed a strategic 4D-LiDAR partnership supported by an LG Innotek investment of up to approximately $50 Million.
- February 18, 2025 – Visteon reported $6.1 Billion in new business wins during 2024, including $2.6 Billion in display-business wins.
- February 2025 – TCL CSOT unveiled a 3D AR-HUD with an 11-degree by 5.4-degree field of view and a 12-litre optical assembly.
- October 2025 – RoboSense delivered 120,000 digital LiDAR units in a single month, including its 120,000th unit to a major new-energy-vehicle manufacturer.
- September 9, 2024 – DENSO announced an approximately ¥69 Billion investment in a new 56,000-square-metre plant at its Zenmyo site.
- December 6, 2024 – Hesai secured an expected order exceeding 1.5 million LiDAR units for more than 10 Changan Automobile vehicle models.
- December 30, 2024 – Hesai delivered more than 100,000 LiDAR units during December 2024 and planned annual capacity exceeding 2 million units for 2025.
Report Scope
| Report Features | Description |
|---|---|
| Market Value (2025) | USD 12.4 Billion |
| Forecast Revenue (2035) | USD 158.2 Billion |
| CAGR (2026-2035) | 29.1% |
| Base Year for Estimation | 2025 |
| Historic Period | 2020-2024 |
| Forecast Period | 2026-2035 |
| Report Coverage | Revenue Forecast, Market Dynamics, Market Opportunity Analysis, Technology and Innovation Landscape, Competitive Landscape, Recent Developments |
| Segments Covered | By Function (AR HUD Based Navigation, AR HUD with Standard Functions, AR HUD Based Adaptive Cruise Control, AR HUD Based Lane Departure Warning), By Sensor Technology (Sensor Fusion, Radar, LiDAR, Image Sensor), By Display Technology (Combiner, Windshield, Wave-guide), By Vehicle Type (Passenger Cars, Commercial Vehicles) |
| Regional Analysis | North America (US and Canada), Europe (Germany, France, The UK, Spain, Italy, and Rest of Europe), Asia Pacific (China, Japan, South Korea, India, Australia, and Rest of APAC), Latin America (Brazil, Mexico, and Rest of Latin America), Middle East and Africa (GCC, South Africa, and Rest of MEA) |
| Competitive Landscape | Robert Bosch GmbH, Continental AG, Denso Corporation, Panasonic Corporation, Visteon Corporation, Valeo SA, Nippon Seiki Co. Ltd., WayRay AG, Hyundai Mobis, Mojo Vision, Mitsubishi Electric Corporation, Yazaki Corporation, Other Key Players |
| Customization Scope | Customization for segments, region/country-level will be provided. Additional customization can be done based on requirements. |
| Purchase Options | We have three licenses to opt for: Single User License, Multi-User License (Up to 5 Users), Corporate Use License (Unlimited User and Printable PDF) |





































