
Global Augmented Reality Hardware Market Size, Share Report Analysis By Device Type (Head-Mounted Displays, Heads-Up Displays (HUDs), Handheld Devices, Spatial Augmented Reality (SAR) Projectors), By Application (Enterprise & Industrial, Consumer, Healthcare, Automotive & Aerospace, Education & Training),By Technology (Marker-based AR, Markerless AR, Superimposition-based AR, Location-based AR), By Regional Analysis, Global Trends and Opportunity, Future Outlook By 2025-2034
- Published date: Dec. 2025
- Report ID: 167667
- Number of Pages: 271
- Format:
-
keyboard_arrow_up
Quick Navigation
Report Overview
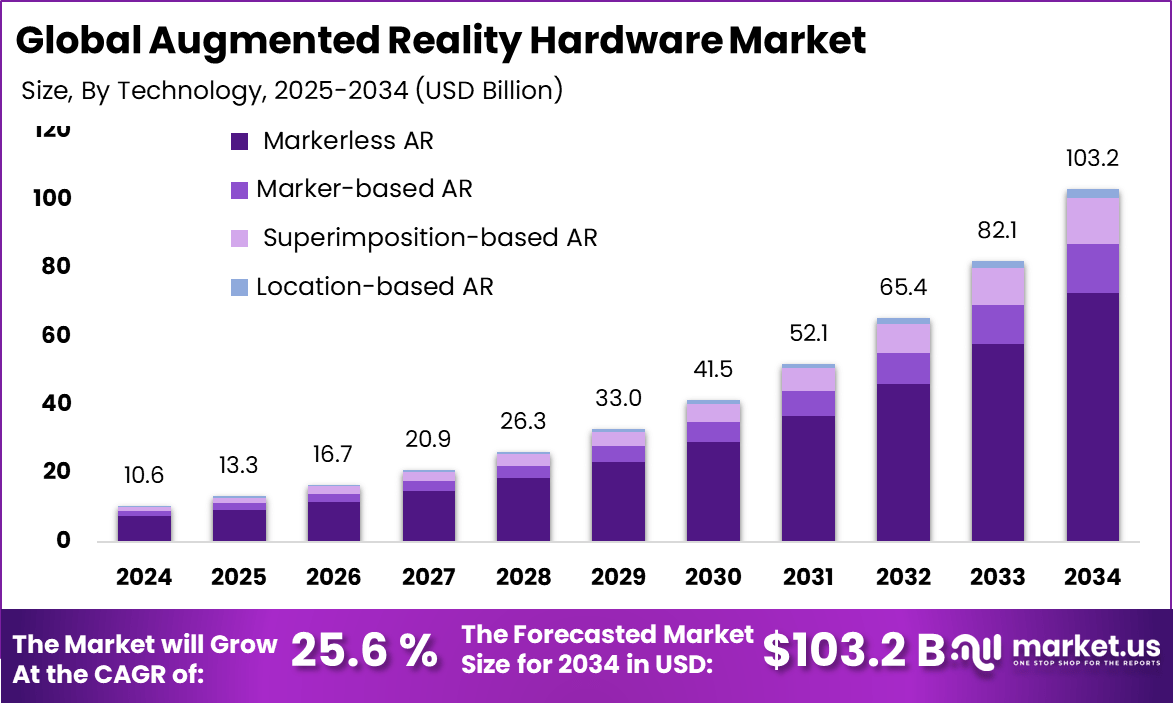
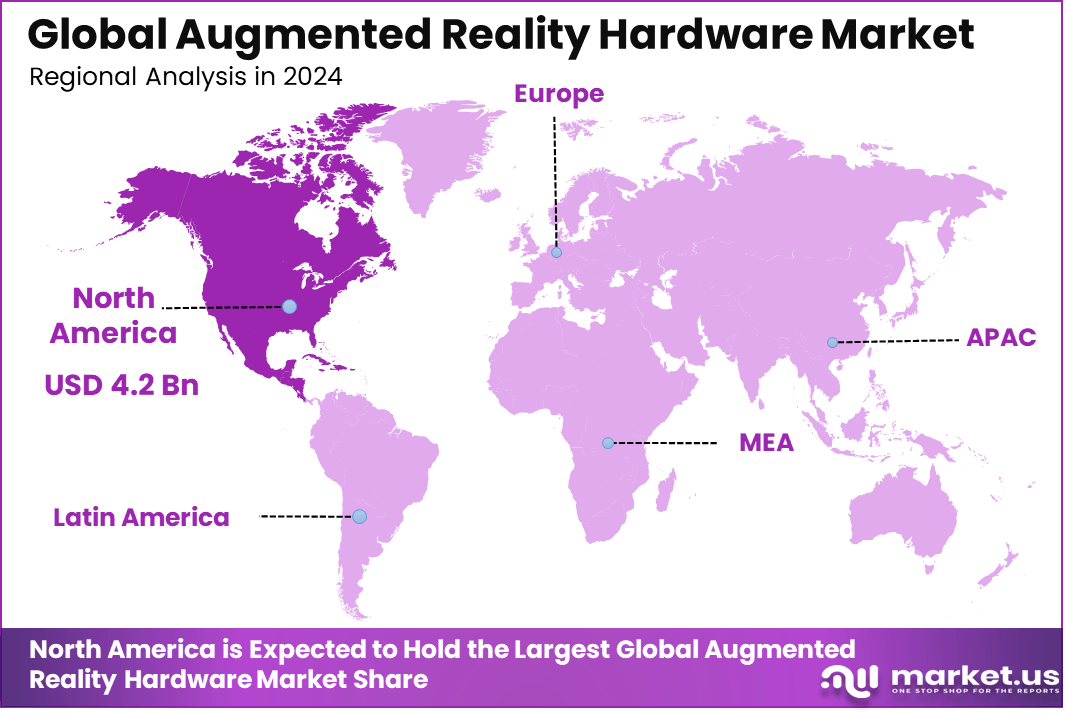
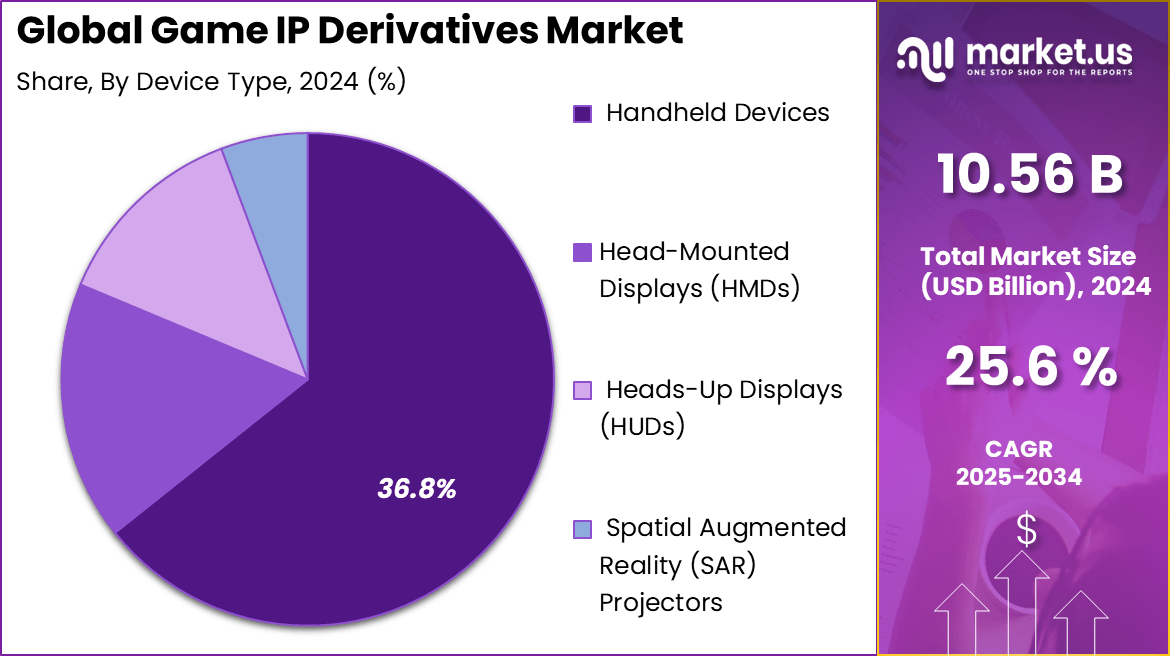
The Global Augmented Reality Hardware Market generated USD 10.56 Billion in 2024 and is predicted to register growth to about USD 103.2 Billion by 2034, recording a CAGR of 25.60% throughout the forecast span. In 2024, North America held a dominant market position, capturing more than a 40.7% share, holding USD 3.92 Billion revenue.
The augmented reality hardware market covers physical devices that project digital content into the real world, including head mounted displays, smart glasses, sensors, cameras, processors, and display components. These devices enable practical use of AR software across industries such as manufacturing and healthcare, where real time visual guidance improves accuracy and productivity.
AR hardware supports hands free interaction and spatial visualization by displaying instructions, data, and 3D models within the user’s environment. In industrial use, it enables remote support, maintenance, and training, while in healthcare it assists with surgical planning and medical education. Research shows that AR based visual guidance can reduce task errors by over 30%, underlining its operational impact.
Growth is driven by increasing demand for immersive and interactive technologies in enterprise environments. Organizations are investing in AR hardware to improve workforce efficiency and reduce training time. Advances in lightweight optics, battery efficiency, and processing power have improved device comfort and usability.
Rising adoption of Industry 4.0 practices and digital workplaces has also accelerated demand. Industry technology surveys indicate that more than 60% of enterprises piloting AR report measurable productivity improvements. Demand for AR hardware is increasing steadily as use cases move from pilot projects to scaled deployments.
Manufacturing and field service sectors show strong demand due to clear return on investment. Retail and logistics are adopting AR devices to improve picking accuracy and customer engagement. Consumer interest is also growing, driven by gaming and interactive media. Research indicates that over 70% of AR usage today is concentrated in professional and enterprise applications.
Key Takeaways
- Handheld devices dominate the augmented reality hardware market with a significant share of about 64.3%.
- The Enterprise and Industrial sector accounts for roughly 52.8% of the AR hardware applications, reflecting the technology’s growing acceptance in professional settings.
- Markerless AR leads technology usage in this market segment, capturing approximately 70.4%.
- North America holds a substantial 40.7% share of the global augmented reality hardware market.
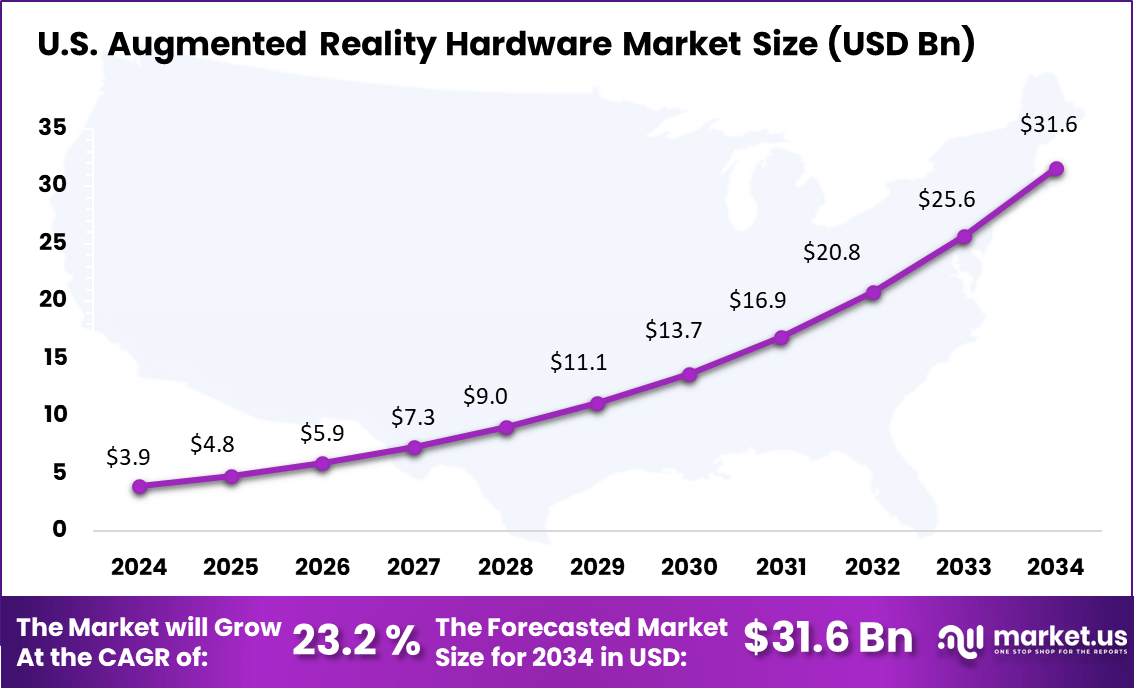
- The U.S. market accounts for about 23.2% share by value, representing a critical segment within North America.
U.S Market Size
The U.S. market accounts for about 23.2% share by value, representing a critical segment within North America. The U.S. AR hardware market is notably fueled by large-scale investments, innovative R&D, and a thriving ecosystem of AR device manufacturers and software developers. Government initiatives, particularly in defense and healthcare sectors, have contributed to the accelerated deployment of AR hardware solutions.
In the consumer space, there is increasing demand for handheld AR devices and wearable AR hardware that enhances gaming, entertainment, and retail experiences. The U.S. also leads in enterprise adoption, especially in industrial manufacturing and automotive sectors, where AR is used to improve efficiency, safety, and collaboration.
North America holds a substantial 40.7% share of the global augmented reality hardware market. This leadership position is supported by the region’s robust technological infrastructure, extensive adoption of AR-enabled devices, and significant investments from both government and private sectors.
North America’s AR market benefits from the strong presence of innovative startups and established technology companies, which propel continuous advancements and adoption. The use of AR technology spans multiple industries in North America, including healthcare, manufacturing, retail, and entertainment.
The region sees a growing trend of enterprises leveraging AR hardware to improve workforce training, enhance product visualization, and optimize operations.Additionally, North America’s consumers are increasingly adopting AR-enabled devices, fueling expanded usage and acceptance of augmented reality technologies.
By Device Type
Handheld devices lead with 64.3%, showing that smartphones and tablets remain the primary hardware used for augmented reality applications. These devices are widely available, easy to use, and capable of supporting AR features through built-in cameras and sensors.
Strong adoption of handheld devices is supported by their lower cost and high familiarity among users. Enterprises and consumers prefer handheld AR hardware because it allows quick deployment without additional equipment or training.
By Application
Enterprise and industrial applications account for 52.8%, reflecting strong use of AR hardware in manufacturing, maintenance, and training environments. AR devices help workers visualize instructions, inspect equipment, and improve task accuracy.
The growth of this segment is driven by the need for productivity improvement and error reduction. Enterprises use AR hardware to support remote assistance, streamline workflows, and enhance safety in complex operational settings.
By Technology
Markerless AR dominates with 70.4%, highlighting preference for systems that do not rely on physical markers. This technology uses sensors, cameras, and spatial mapping to place digital content directly into real world environments.
Markerless AR supports greater flexibility and ease of use across different locations. Its adoption is growing as it allows smoother interaction and faster setup, which is important for both enterprise and consumer AR applications.
Key Market Segments
- By Device Type
- Head-Mounted Displays (HMDs)
- Smart Glasses
- Helmet-Mounted Displays
- Heads-Up Displays (HUDs)
- Handheld Devices
- Spatial Augmented Reality (SAR) Projectors
- Head-Mounted Displays (HMDs)
- By Application
- Enterprise & Industrial
- Manufacturing & Assembly
- Logistics & Warehousing
- Field Service & Maintenance
- Design & Prototyping
- Consumer
- Gaming & Entertainment
- Retail & E-Commerce
- Healthcare
- Surgical Assistance
- Medical Training & Education
- Patient Care & Rehabilitation
- Automotive & Aerospace
- Heads-Up Displays (HUDs)
- Design, Manufacturing, and Maintenance
- Education & Training
- Enterprise & Industrial
- By Technology
- Marker-based AR
- Markerless AR
- Superimposition-based AR
- Location-based AR
Regional Analysis and Coverage
- North America
- US
- Canada
- Europe
- Germany
- France
- The UK
- Spain
- Italy
- Russia
- Netherlands
- Rest of Europe
- Asia Pacific
- China
- Japan
- South Korea
- India
- Australia
- Singapore
- Thailand
- Vietnam
- Rest of Latin America
- Latin America
- Brazil
- Mexico
- Rest of Latin America
- Middle East & Africa
- South Africa
- Saudi Arabia
- UAE
- Rest of MEA
Driver Analysis
Rising Demand for Immersive Gaming and Entertainment Experiences
The demand for immersive gaming and entertainment is a key driver of the augmented reality (AR) hardware market. AR devices such as head-mounted displays and smart glasses offer engaging, interactive experiences that enhance gaming and media consumption. These technologies allow users to blend virtual elements with the real world, creating new possibilities for entertainment that are more captivating than traditional screens.
This increasing consumer appetite for immersive content is prompting hardware manufacturers to innovate and improve AR devices’ optics, displays, and lightweight designs to keep users engaged for longer periods. The growth of AR gaming also encourages software developers to create more compatible applications, further expanding the demand for quality hardware.This driver is supported by rapid technological advancements and wider adoption beyond gaming into industries like education and manufacturing.
Restraint Analysis
High Cost and Technical Barriers
One significant restraint on the AR hardware market is the high cost associated with developing and purchasing advanced AR devices. The research and development for cutting-edge optics, sensors, and lightweight materials demands substantial investment, pushing retail prices higher than many potential users can afford. This expense limits accessibility for some consumer segments and small businesses, slowing widespread adoption despite growing interest.
Technical barriers also add to the challenge. AR hardware must overcome issues like motion sickness, limited battery life, and hardware failures, which can degrade the user experience. Moreover, some AR systems face difficulties in being easily reconfigured across different platforms, causing compatibility limitations.Addressing these cost and technical limitations remains crucial for unlocking broader use of augmented reality hardware worldwide.
Opportunity Analysis
Expansion in Enterprise and Industrial Applications
The augmented reality hardware market has substantial opportunity for growth through expanded use in enterprise and industrial sectors. AR devices enable improved workforce training, operational efficiency, and safety across industries such as healthcare, manufacturing, aerospace, and defense. Real-time data overlays and remote assistance features enhance worker productivity and reduce errors during complex tasks.
Investments in enterprise-grade AR hardware that supports demanding professional applications are rising, driven by companies seeking to digitize processes and improve outcomes. Innovation in lightweight, ergonomic headsets tailored for long-duration use further encourages adoption in these sectors.Moreover, the integration of AR with IoT and AI technologies opens new possibilities for monitoring and predictive maintenance.
Challenges
Privacy and Security Concerns
Represent a major challenge for the AR hardware market. AR devices continuously collect and process data about users and their environments, raising concerns about data protection and unauthorized access. As AR applications increase in sectors involving sensitive information, such as healthcare and enterprise operations, ensuring secure data handling becomes critical to maintaining user trust and meeting regulatory requirements.
Furthermore, the newer nature of AR technology means standards and best practices for privacy and cybersecurity are still evolving. Addressing potential vulnerabilities in hardware and software is essential to preventing breaches and misuse of AR data.Building robust security frameworks and transparent privacy policies will be key for AR hardware providers to overcome this challenge and enable broader acceptance.
Key Players Analysis
The augmented reality (AR) hardware market is dominated by a mix of technology giants and specialized innovators driving industry advancements. Companies like Microsoft Corporation have taken a leading role through their development of advanced AR headsets integrated with enterprise applications, especially in education and industrial training.
Google LLC and Apple Inc. are also significant contributors, leveraging their vast consumer ecosystems and R&D capabilities to advance AR glasses and head-mounted displays. Samsung Electronics and Sony Interactive Entertainment contribute notably with their hardware innovations aimed at both consumer and professional markets.
Mid-sized firms and specialized AR hardware manufacturers play an important role in complementing the efforts of major corporations. Magic Leap Inc. continues innovating with its head-mounted digital light field displays, focusing on enterprise applications requiring precise spatial computing.
Top Key Players in the Market
- Microsoft Corporation
- Apple Inc.
- Samsung Electronics Co. Ltd.
- Sony Interactive Entertainment LLC
- Meta
- Magic Leap Inc.
- Vuzix Corporation
- Epson
- Lenovo Group Limited
- NVIDIA Corporation
- Primax Technology
- Bose Corporation
- Deepon VR
- TCL Technology Group
- High Tech Computer Corporation
- Others
Recent Developments
- October, 2025 – Apple introduced an upgraded Apple Vision Pro featuring the new M5 chip, a more comfortable Dual Knit Band, and visionOS 26 with richer spatial widgets, more natural Personas and expanded Apple Intelligence support, positioning the headset more clearly as a daily spatial computer rather than a niche developer device.
- June, 2025 – At WWDC, Apple announced visionOS 26 for Vision Pro, adding deeper multitasking, improved hand‑ and eye‑tracking, and new collaborative spatial experiences, giving enterprise and creative users a stronger reason to standardize workflows around Vision Pro hardware.
- November, 2025 – Meta’s Quest 3 remained the dominant mixed/virtual reality headset in shipments, helped by its 2064 x 2208‑per‑eye displays, slim optics and strong mixed reality passthrough, reinforcing Meta’s position as the mass‑market hardware leader even as Apple pushes premium spatial computing.
Report Scope
Report Features Description Market Value (2024) USD 10.56 Bn Forecast Revenue (2034) USD 103.2 Bn CAGR(2025-2034) 25.60% Base Year for Estimation 2024 Historic Period 2020-2023 Forecast Period 2025-2034 Report Coverage Revenue forecast, AI impact on Market trends, Share Insights, Company ranking, competitive landscape, Recent Developments, Market Dynamics and Emerging Trends Segments Covered By Device Type (Head-Mounted Displays (Smart Glasses, Helmet-Mounted Displays), Heads-Up Displays (HUDs), Handheld Devices, Spatial Augmented Reality (SAR) Projectors), By Application (Enterprise & Industrial: Manufacturing & Assembly, Logistics & Warehousing, Field Service & Maintenance, Design & Prototyping; Consumer: Gaming & Entertainment, Retail & E-Commerce; Healthcare: Surgical Assistance, Medical Training & Education, Patient Care & Rehabilitation; Automotive & Aerospace: Heads-Up Displays (HUDs), Design Manufacturing and Maintenance; Education & Training), By Technology (Marker-based AR, Markerless AR, Superimposition-based AR, Location-based AR) Regional Analysis North America – US, Canada; Europe – Germany, France, The UK, Spain, Italy, Russia, Netherlands, Rest of Europe; Asia Pacific – China, Japan, South Korea, India, New Zealand, Singapore, Thailand, Vietnam, Rest of Latin America; Latin America – Brazil, Mexico, Rest of Latin America; Middle East & Africa – South Africa, Saudi Arabia, UAE, Rest of MEA Competitive Landscape Microsoft Corporation, Google, Apple Inc., Samsung Electronics Co. Ltd., Sony Interactive Entertainment LLC, Meta, Magic Leap Inc., Vuzix Corporation, Epson, Lenovo Group Limited, NVIDIA Corporation, Primax Technology, Bose Corporation, Deepon VR, TCL Technology Group, High Tech Computer Corporation, Others Customization Scope Customization for segments, region/country-level will be provided. Moreover, additional customization can be done based on the requirements. Purchase Options We have three license to opt for: Single User License, Multi-User License (Up to 5 Users), Corporate Use License (Unlimited User and Printable PDF)  Augmented Reality Hardware MarketPublished date: Dec. 2025add_shopping_cartBuy Now get_appDownload Sample
 -
-
- Microsoft Corporation
- Apple Inc.
- Samsung Electronics Co. Ltd.
- Sony Interactive Entertainment LLC
- Meta
- Magic Leap Inc.
- Vuzix Corporation
- Epson
- Lenovo Group Limited
- NVIDIA Corporation
- Primax Technology
- Bose Corporation
- Deepon VR
- TCL Technology Group
- High Tech Computer Corporation
- Others
Our Clients
- 167667
- Dec. 2025


