


Report Overview
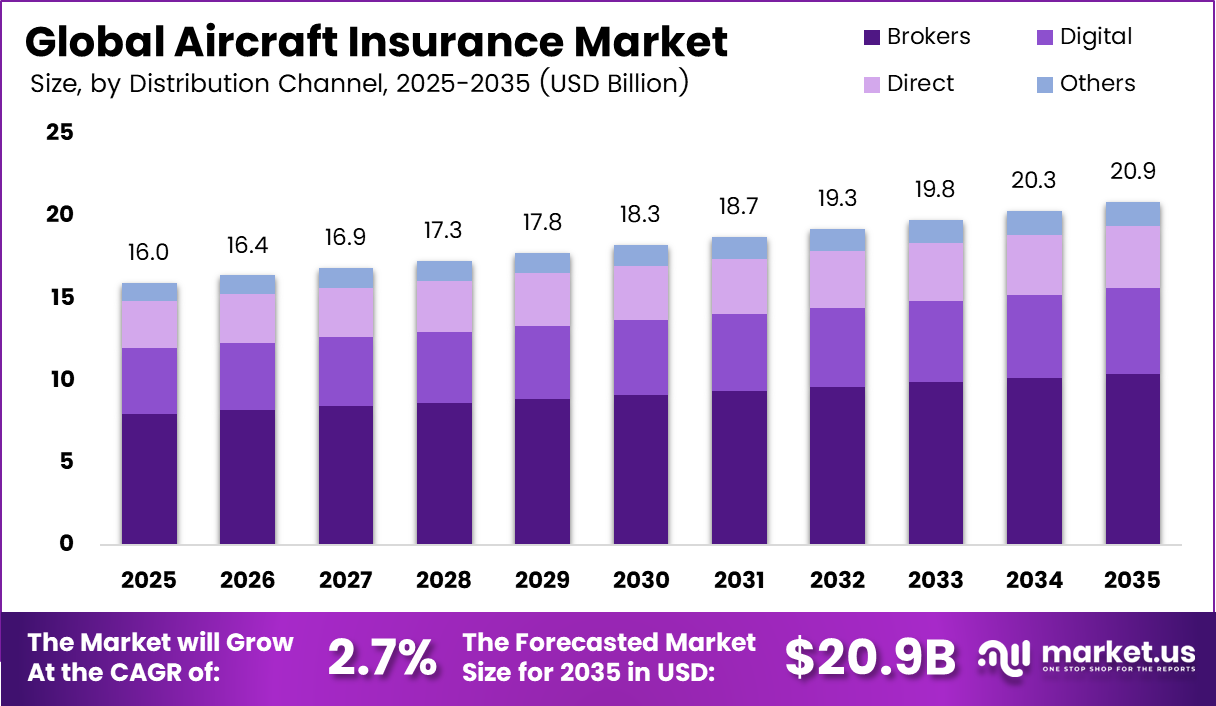
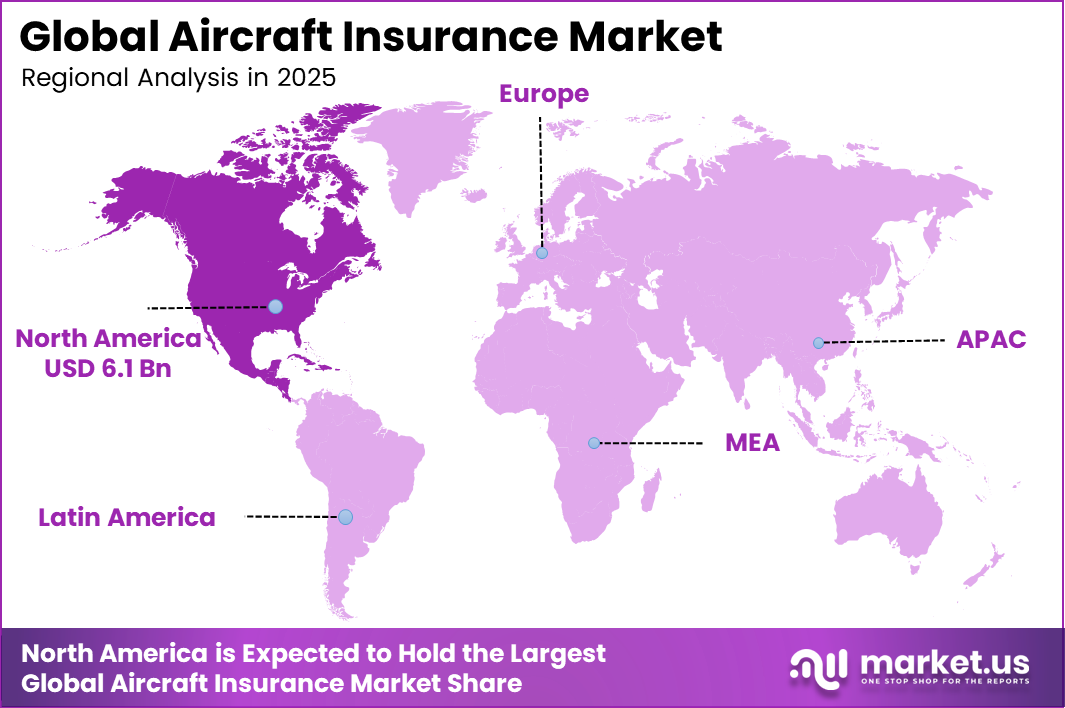
The Global Aircraft Insurance Market size is expected to be worth around USD 20.9 billion by 2035, from USD 16.0 billion in 2025, growing at a CAGR of 2.7% during the forecast period from 2026 to 2035. In 2025, North America held a dominant market position, capturing around a 38.2% share, holding USD 6.10 billion in revenue.
The growth of the aircraft insurance market is primarily driven by the continuous expansion of the global aviation industry. According to the International Civil Aviation Organization (ICAO) and Airports Council International (ACI World), global passenger traffic reached 9.5 billion in 2024, exceeding pre-pandemic levels for the first time, and is expected to increase to 9.8 billion in 2025, reflecting a 3.7% annual growth.
The International Air Transport Association (IATA) reported that passenger demand, measured in Revenue Passenger Kilometers (RPK), increased by 5.3% in 2025, while international load factors reached a record 83.6%. Rising passenger traffic is increasing aircraft utilization, creating higher demand for hull, liability, and third-party insurance. IATA data shows the global commercial aircraft fleet reached 35,550 aircraft by June 2025, including 30,300 active aircraft.
Oliver Wyman projects the fleet will expand to 38,300 aircraft by 2035, representing 32% growth at a 2.8% CAGR. The Air Transport Action Group (ATAG) estimates that aviation supports 86.5 million jobs worldwide and contributes 3.9% to global GDP, reinforcing the need for comprehensive insurance protection across the industry. Regulatory requirements and the expansion of new aviation segments are further supporting market growth.
In the European Union, Regulation (EC) No. 785/2004 requires liability coverage of at least €250,000 per passenger, while third-party liability ranges from €750,000 to over €700 million, depending on aircraft size. In the United States, the FAA and Department of Transportation require commercial operators to maintain liability insurance, with some large jet operators carrying policies of USD 10 million or more per occurrence.
The U.S. has approximately 220,000 registered civil aircraft, with over 90% classified as general aviation aircraft. Growing adoption of drones, private jets, and expanding air cargo operations is creating additional insurance opportunities. IATA reported global air cargo demand increased by 3.4% in 2025, while Airbus forecasts the global aircraft fleet will grow from 23,210 aircraft in 2025 to 45,550 by 2045, supporting long-term demand for aircraft insurance.
Key Takeaways
- The global aircraft insurance market is projected to reach USD 20.9 billion by 2035, up from USD 16.0 billion in 2025.
- The market is expected to expand at a CAGR of 2.7% during the 2026 to 2035 forecast period.
- By insurance type, Combined Single Limit (CSL) led the market with a 30.1% share in 2025, while Passenger Liability Insurance is projected to be the fastest-growing segment.
- By application, Commercial Aviation held the largest market share of 65.7% in 2025, whereas General & Business Aviation is expected to record the fastest growth during the forecast period.
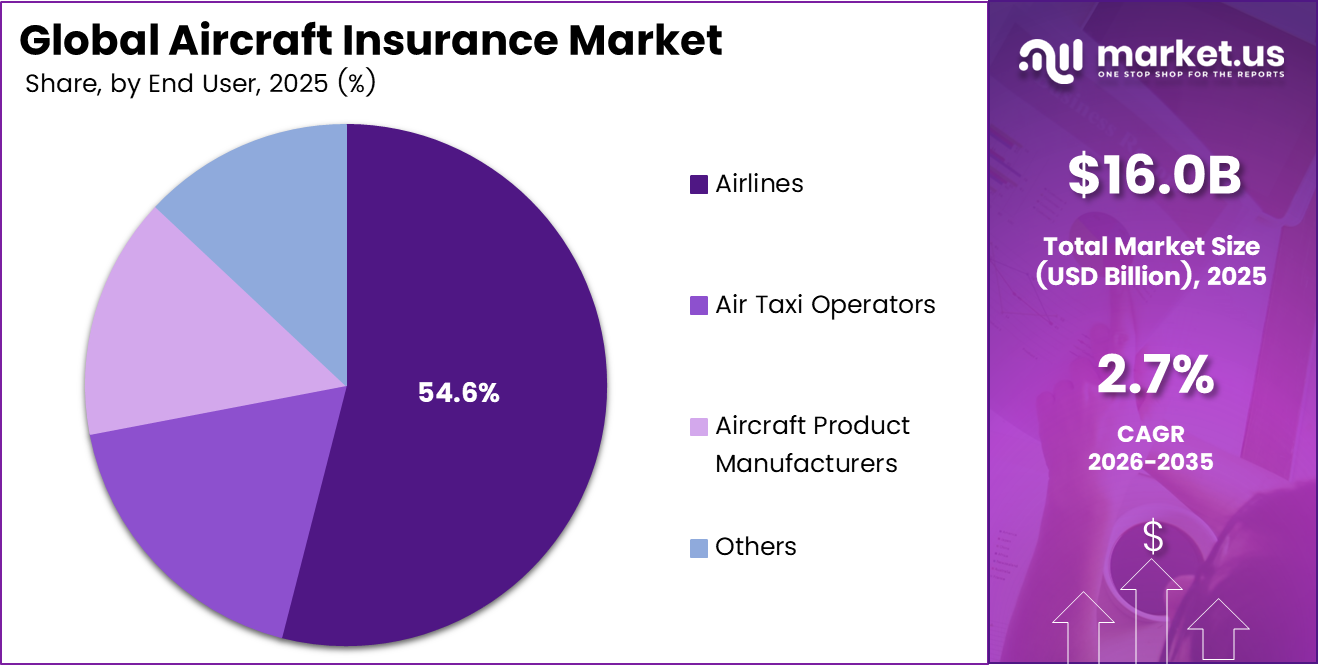
- By end user, Airlines accounted for the leading 54.6% market share in 2025. Air Taxi Operators are anticipated to be the fastest-growing end-user segment.
- By distribution channel, Brokers remained the leading channel with a 50.1% share in 2025, while Digital distribution is expected to witness the fastest growth.
- North America dominated the global market in 2025, accounting for 38.2% of the total market and generating USD 6.10 billion in revenue.
- Asia-Pacific is projected to be the fastest-growing regional market throughout the forecast period.
By Insurance Type
Combined Single Limit (CSL) insurance held the leading position in the aircraft insurance market, accounting for 30.1% of the market share in 2025. Its dominance is driven by the ability to cover third-party liability, passenger bodily injury, and property damage under a single coverage limit for each incident. This simplifies risk management for aircraft owners, charter operators, leasing companies, and general aviation fleets.
The large installed aviation base further supports demand. According to the U.S. Federal Aviation Administration (FAA), the U.S. has more than 220,000 registered civil aircraft, while North America accounts for around 54.2% of the global general aviation fleet, creating strong demand for comprehensive CSL policies.
Passenger Liability Insurance is expected to register the fastest growth during the forecast period. Growth is supported by rising global air travel and higher mandatory passenger compensation limits. According to the International Air Transport Association (IATA), global passenger traffic is projected to reach 5.2 billion passengers in 2026, increasing by 4.4% year over year, while airline industry revenue is expected to exceed USD 1.053 trillion.
In addition, from 28 December 2024, the International Civil Aviation Organization (ICAO) increased the Montreal Convention liability limit for passenger death or injury from 128,821 SDRs to 151,880 SDRs (around USD 202,500) per passenger. Higher liability limits and record passenger load factors of 83.8% in 2026 are encouraging airlines to increase passenger liability coverage, supporting strong growth in this insurance segment.
By Application
Commercial Aviation dominated the aircraft insurance market in 2025, accounting for 65.7% of the total market share. This leadership is driven by the industry’s high-value aircraft and mandatory insurance requirements. According to the International Air Transport Association (IATA), global airline industry revenue exceeded USD 1.008 trillion in 2025, with passenger revenue reaching USD 768 billion. The Air Transport Action Group (ATAG) reports that 1,138 airlines operate a fleet of 29,039 commercial aircraft worldwide.
Most commercial aircraft are valued between USD 50 million and USD 200 million, creating significant demand for hull and liability insurance. In addition, regulations under ICAO and EU Regulation 785/2004 require commercial airlines to maintain minimum insurance coverage, ensuring consistent demand for aircraft insurance. General & Business Aviation is expected to register the fastest growth during the forecast period.
According to the General Aviation Manufacturers Association (GAMA), global general aviation aircraft deliveries reached 3,230 units in 2025, an increase of 2.2% from 2024, while delivery value rose 16.1% to USD 31.0 billion. Business jet deliveries also increased 11.8% to 854 units. A PwC study commissioned by the National Business Aviation Association (NBAA) found that U.S. general aviation supports 1.33 million jobs and contributes USD 339.2 billion in economic output.
By End User
Airlines accounted for the largest share of the aircraft insurance market, capturing 54.6% in 2025. Their dominance is driven by the large number of commercial flights, high aircraft values, and mandatory insurance requirements. According to OAG, airlines operated about 39.8 million scheduled flights in 2025, exceeding the pre-pandemic record of 38.9 million flights in 2019. Every flight requires hull, passenger liability, cargo, and third-party liability insurance, creating consistent demand for coverage.
Additionally, IATA reported a backlog of 5,352 undelivered aircraft at the end of 2024, compared with annual production of around 2,000 aircraft, indicating continued fleet expansion and renewal. Commercial aircraft values ranging from USD 50–100 million for narrow-body models and USD 150–300 million for wide-body aircraft further increase insurance premiums and strengthen airlines’ market leadership.
Air Taxi Operators are expected to register the fastest growth during the forecast period. Growth is supported by new regulations enabling commercial eVTOL operations and increasing investment in advanced air mobility. The FAA introduced its final powered-lift aircraft rule, creating the regulatory framework for commercial air taxi operations. According to PwC, the global Advanced Air Mobility (AAM) market is projected to grow from USD 11.4 billion in 2024 to USD 87.8 billion by 2034.
By Distribution Channel
Brokers dominated the aircraft insurance market, accounting for 50.1% of the market share in 2025. Their leadership is driven by the complex nature of aviation insurance, where policies require specialized risk assessment, aircraft valuation, regulatory compliance, and reinsurance expertise. The UK wholesale market retained a 45% global share of marine and aviation specialty insurance, while the London Market wrote £57.9 billion in gross written premiums across specialty lines in 2025.
In addition, the International Underwriting Association (IUA) reported £49.3 billion in premium income during 2024, with most aviation business placed through registered brokers. This long-established broker-led structure continues to support the segment’s dominant position. Digital distribution is projected to register the fastest CAGR during the forecast period. According to the OECD, global non-life insurance premiums increased by 8.2% in 2024, supported by wider technology adoption across the sector.
A 2025 FinTech Global survey found that 74% of insurers identified digital transformation as their top strategic priority. Rising demand from UAV operators, eVTOL companies, and general aviation fleets for instant online quotations and faster policy issuance is expected to further accelerate the adoption of digital distribution channels.
Key Market Segments
By Insurance Type
- Combined Single Limit (CSL)
- In-Flight Insurance
- Passenger Liability Insurance
- Public Liability Insurance
- Umbrella Insurance
- Others
By Application
- Commercial Aviation
- General & Business Aviation
By End User
- Airlines
- Air Taxi Operators
- Aircraft Product Manufacturers
- Others
By Distribution Channel
- Brokers
- Digital
- Direct
- Others
Regional Analysis
North America accounted for the largest share of 38.2% of the aircraft insurance market in 2025, valued at USD 6.1 billion. The region leads due to its large commercial aviation industry and high-value aircraft fleet. According to Airlines for America (A4A), U.S. commercial aviation contributes USD 1.54 trillion to GDP, equal to 5% of the national economy, while airlines operate more than 28,000 flights daily.
The U.S. Bureau of Transportation Statistics (BTS) reported 80.4 million passengers carried by U.S. airlines in April 2026, highlighting continuous aircraft operations that require active insurance coverage. Additionally, the Air Transport Action Group (ATAG) estimates that aviation supports 8.4 million jobs and USD 1.4 trillion in economic activity across North America. High aircraft values, often USD 150–300 million for wide-body jets, along with strict U.S. liability regulations, continue to support the region’s leadership.
Asia Pacific is projected to register the fastest CAGR during the forecast period. Growth is supported by rapid passenger traffic expansion and large-scale fleet additions. According to IATA, Asia-Pacific recorded 10.9% growth in international passenger traffic in 2025, the highest among all regions, with a record 84.4% load factor. IATA also forecasts the region to lead global passenger traffic growth in 2026 with 7.3% growth in Revenue Passenger Kilometers (RPK).
Airbus estimates that Asia-Pacific will require 19,560 new commercial aircraft over the next 20 years, representing 46% of global demand for 42,520 aircraft. IATA also projects the region will handle more than 4 billion passengers by 2044, contributing around 41% of global aviation growth. As every new aircraft requires mandatory hull and liability insurance, this large fleet expansion will continue to drive strong demand for aircraft insurance across the region.
Key Regions and Countries
North America
- US
- Canada
Europe
- Germany
- France
- The UK
- Spain
- Italy
- Rest of Europe
Asia Pacific
- China
- Japan
- South Korea
- India
- Australia
- Rest of APAC
Latin America
- Brazil
- Mexico
- Rest of Latin America
Middle East & Africa
- GCC
- South Africa
- Rest of MEA
Market Dynamics
Drivers
| Driver | (~) % CAGR | Geographic Relevance | Impact Timeline |
|---|---|---|---|
| Post-pandemic traffic recovery and fleet utilization | +3.0% | North America, Europe, Asia Pacific | Short term (≤ 2 years) |
| Accelerating new aircraft deliveries | +1.8% | Global OEM backlogs | Medium term (2 to 4 years) |
| War and geopolitical risk pricing reset | +1.5% | Europe, Middle East, selected corridors | Short term (≤ 2 years) |
| Growth in business jets and charter operations | +1.2% | North America, Middle East, Asia Pacific | Medium term (2 to 4 years) |
| Expansion of aviation activity in emerging markets | +1.0% | Asia Pacific, Africa, Latin America | Long term (≥ 4 years) |
| Increased regulatory requirements for liability cover | +0.8% | Global, with regional variations | Medium term (2 to 4 years) |
Post-pandemic traffic recovery and fleet utilization
Passenger traffic has returned to roughly 95 to 105% of pre 2019 levels on many major routes, with IATA and airline disclosures for 2023 and 2024 showing record load factors above 80%, and this directly lifts hull and liability exposures priced into aircraft insurance premiums today by sustaining higher flight cycles per airframe and increased revenue seat kilometres under cover.
Higher utilization, often an extra 500–800 block hours per aircraft per year compared with the trough in 2020 and 2021, shifts insurers’ earned premium per aircraft upward even when rate increases moderate, supporting the incremental +3.0% contribution to the baseline CAGR as carriers retain comprehensive cover to satisfy leasing covenants and regulatory mandates.
Strategically, this recovery forces insurers to refine rating models from pandemic-driven attritional loss ratios back toward normalized combined ratios in the low to mid 90% range, which enables more disciplined capacity deployment and allows aircraft owners, leasing companies, and airlines to secure multi-year cover structures that stabilize cash flows and reduce capital volatility from unplanned coverage gaps.
Restraints
| Restraint | (~) % CAGR | Geographic Relevance | Impact Timeline |
|---|---|---|---|
| High interest rates and capital cost for insurers | -2.2% | North America, Europe, global reinsurance hubs | Short term (≤ 2 years) |
| Tight underwriting capacity for war and political risks | -1.5% | Europe, Middle East, parts of Asia | Short term (≤ 2 years) |
| Regulatory capital and solvency constraints | -1.3% | Global, stronger in EU and UK regimes | Medium term (2 to 4 years) |
| Stringent distribution and bancassurance rules | -1.0% | Selected Asian and emerging markets | Medium term (2 to 4 years) |
| Litigation risk and large claim volatility | -0.9% | US, Europe | Short term (≤ 2 years) |
| Credit risk from financially stressed airlines | -0.8% | Global, more acute in weaker carriers | Medium term (2 to 4 years) |
High interest rates and capital cost for insurers
Elevated policy rates set by major central banks since 2022 have pushed insurers’ weighted average cost of capital up by an estimated 150–250 basis points, forcing aviation and aircraft underwriters to target higher risk-adjusted returns and thereby restraining capacity growth and pricing flexibility despite underlying demand.
With aviation gross written premiums projected around a multi-decade high exceeding US$8 billion in 2024, capital-intensive lines such as hull, liability, and war risk now require thicker solvency buffers, often an extra 2–3 percentage points of regulatory capital relative to pre-tightening norms, which compresses margins when combined ratios drift above 95% because of rising repair costs and attritional claims.
Strategically, this capital cost restraint delays new product launches, reduces willingness to write multi-year guaranteed rate policies, and encourages insurers to prune marginal accounts, creating a near-term drag of roughly -2.2% on the baseline CAGR as some aircraft operators face higher premiums, stricter deductibles, or reduced limits that suppress achievable top-line premium expansion.
Challenges
| Challenge | (~) % CAGR | Geographic Relevance | Mitigation Horizon |
|---|---|---|---|
| Escalating repair and parts inflation | -2.0% | Global MRO and OEM networks | Medium term (2 to 4 years) |
| Complex cross-border risk location rules | -1.6% | Global, multi-jurisdiction placements | Long term (≥ 4 years) |
| Data and cyber risk in connected aircraft | -1.4% | North America, Europe, advanced fleets | Long term (≥ 4 years) |
| Talent shortage in specialist underwriting | -1.2% | Global specialty markets | Medium term (2 to 4 years) |
| Operational disruption from supply chain bottlenecks | -1.0% | Global aircraft and engine supply chains | Short term (≤ 2 years) |
| Climate-related weather and catastrophe volatility | -0.8% | Global, particularly weather-exposed regions | Long term (≥ 4 years) |
Escalating repair and parts inflation
Industry claims analyses show that aviation repair and replacement costs have risen by roughly 20–30% over 2022 to 2024, driven by labour shortages in maintenance, repair, and overhaul facilities, material cost inflation for composites and avionics, and longer lead times on critical components, which together raise the severity of hull claims without a proportional premium response.
Typical repair cycles for significant airframe or engine events that previously closed within 60–90 days now frequently extend beyond 120 days, increasing loss adjustment expenses and pushing constructive total loss thresholds to be reached sooner, as noted in recent aviation risk and claims outlooks where attritional events such as hard landings and ground incidents are trending higher.
This structural cost friction forces insurers to reassess deductibles, sub limits, and premium adequacy on a line-by-line basis, depressing the market’s maximum attainable CAGR by an estimated -2.0% as underwriters tighten terms rather than aggressively expand capacity, while aircraft operators confront higher operational expenditure per insured incident that weakens their appetite for additional optional covers and product extensions.
Opportunities
| Opportunity | (~) % CAGR | Geographic Relevance | Execution Window |
|---|---|---|---|
| Specialized cover for advanced aircraft technologies | +2.3% | North America, Europe, Asia Pacific | Medium term (2 to 4 years) |
| Parametric and usage-based insurance models | +1.9% | Global early adopters | Medium term (2 to 4 years) |
| Expansion into emerging market fleet growth | +1.7% | Asia Pacific, Africa, Latin America | Long term (≥ 4 years) |
| Integrated cyber and data risk solutions | +1.5% | Global connected fleets | Medium term (2 to 4 years) |
| Climate-linked resilience and sustainability products | +1.3% | Global, with regulatory-driven demand | Long term (≥ 4 years) |
| Multi-jurisdiction program optimisation and captive solutions | +1.1% | Global multinational operators | Medium term (2 to 4 years) |
Specialized cover for advanced aircraft technologies
New propulsion systems, enhanced avionics, and increasingly software-defined aircraft architectures expected to roll through certification and early deployment between roughly 2024 and 2028 create an emerging need for dedicated insurance products that separate traditional hull and liability risks from technology-specific exposures such as sensor failures, software bugs, and novel component degradation profiles, which are not yet fully priced into standard wordings.
Early industry trend mapping indicates more than 20 distinct technological shifts, from electrified regional aircraft concepts to advanced flight control systems, that could each support new endorsements or standalone policies with differentiated rating factors, enabling insurers to charge risk-reflective premiums while offering operators clearer coverage and potentially improving combined ratios by 3–5% through better risk segmentation.
The white space around these advanced technology covers represents an incremental upside of about +2.3% to the baseline CAGR, as carriers and OEMs seek insurance partners who can underwrite complex technology risks in exchange for multi-year program-level relationships, supporting margin expansion via higher average premium per insured unit and lower acquisition cost per contract when embedded into broader fleet and program arrangements.
Key Players Analysis
The aircraft insurance market is highly consolidated, with a limited number of global insurers, reinsurers, and specialist brokers controlling most underwriting capacity and premium placement. Allianz Commercial (formerly AGCS) remains one of the leading aviation insurers, supported by €18 billion in gross premiums across commercial and specialty insurance in 2024, with aviation representing a key business segment.
Munich Re, the world’s largest reinsurer, reported a record net profit of €6.1 billion in 2025 and maintains an AA (S&P) financial strength rating, making it a major provider of airline hull, liability, and war-risk reinsurance worldwide. USAIG, a subsidiary of General Re (Berkshire Hathaway), is the largest aviation underwriting pool in the U.S., while Global Aerospace specializes exclusively in aviation hull and liability insurance through Lloyd’s and other major insurance markets.
The brokerage market is also dominated by a few global firms. Marsh McLennan generated USD 24.5 billion in revenue in 2024, while its Marsh brokerage business contributed USD 12.5 billion, maintaining a leading position in commercial airline insurance placements. Willis Towers Watson (WTW) reported USD 9.93 billion in total revenue in 2024, with its Risk & Broking division generating USD 4.56 billion, supported by a strong aviation client portfolio.
Arthur J. Gallagher & Co. recorded USD 11.55 billion in revenue in 2024, growing 14.7% year over year, and continues to strengthen its aviation insurance business through acquisitions. Other important participants, including Tokio Marine HCC, Starr Aviation, and AIG, focus on niche areas such as general aviation, drones, and defense aviation, while specialist agencies such as BWI Aviation, Travers & Associates, and ACE Holding serve regional and private aviation markets with customized insurance solutions.
Top Key Players in the Market
- ACE Holding W.L.L.
- Allianz
- American International Group, Inc.
- ARTHUR J. GALLAGHER & CO.
- BWI Aviation Insurance
- EAA Company Ltd
- Global Aerospace
- Marsh LLC
- Munich RE
- Starr Aviation Insurance
- Tokio Marine HCC
- Travers & Associates Aviation Insurance Agency, LLC
- USAIG
- Willis Towers Watson
Recent Developments
- In January–April 2026, WTW and Arthur J. Gallagher Report Hardening Aviation Insurance Market. Willis Towers Watson (WTW) reported that airline hull and liability insurance rates increased by 10%–15% for well-performing airlines and 15%+ for higher-risk accounts during Q1 2026. The trend is expected to influence annual policy renewals for more than 1,100 commercial airlines worldwide.
- In May 2026, FAA Finalizes eVTOL Pilot Certification Rule. The U.S. Federal Aviation Administration (FAA) introduced a final regulatory framework for powered-lift (eVTOL) aircraft, establishing pilot training, certification, and type-rating requirements under a 10-year Special Federal Aviation Regulation (SFAR). The rule creates a formal pathway for commercial eVTOL operations and is expected to accelerate demand for mandatory hull and liability insurance as the air taxi industry expands toward an estimated USD 90 billion market by 2050.
- In January 2025, Core Specialty Acquires London Aviation Underwriters. Core Specialty Insurance Holdings completed the acquisition of London Aviation Underwriters (LAU), a specialist aviation insurer managing approximately USD 56 million in annual premiums. The acquisition established Core Specialty’s dedicated Aviation & Aerospace Division, strengthening its presence in general aviation, airport liability, and non-owned aircraft insurance across the U.S.
- In June 2025, the UK High Court Issues Landmark Russia Aircraft Insurance Ruling. The UK High Court delivered its judgment in the largest aviation insurance dispute on record, involving 147 aircraft, 16 aircraft engines, and insured assets valued at more than USD 4.5 billion. The ruling confirmed coverage under hull war insurance policies, with approximately USD 3 billion in claims resolved through the judgment after settlements. The decision is expected to influence global war-risk underwriting and policy terms.
- In 2025, Global Aviation Insurance Premiums Exceed USD 8 Billion. According to Allianz Commercial, global aviation insurance gross written premiums (GWP) remained above USD 8 billion, the highest level in over 20 years, supported by a 10.4% increase in global air traffic, higher aircraft values, and rising repair and labor costs. Airlines represented approximately 35% of total premiums, while general aviation accounted for 47%. Analysis of 32,000 claims worth USD 15 billion over five years showed that aircraft collisions and crashes contributed 63% of total claims value, reinforcing upward pressure on insurance pricing.
Report Scope
| Report Features | Description |
|---|---|
| Market Value (2025) | USD 16.0 Billion |
| Forecast Revenue (2035) | USD 20.9 Billion |
| CAGR (2026-2035) | 2.7% |
| Base Year for Estimation | 2025 |
| Historic Period | 2020-2024 |
| Forecast Period | 2026-2035 |
| Report Coverage | Revenue Forecast, Market Dynamics, Competitive Landscape, Recent Developments |
| Segments Covered | By Insurance Type [Combined Single Limit (CSL), In-Flight Insurance, Passenger Liability Insurance, Public Liability Insurance, Umbrella Insurance and Others] By Application [Commercial Aviation and General & Business Aviation] By End User [Airlines, Air Taxi, Operators, Aircraft Product Manufacturers and Others] By Distribution Channel [Brokers, Digital, Direct and Others] |
| Regional Analysis | North America – US, Canada; Europe – Germany, France, The UK, Spain, Italy, Rest of Europe; Asia Pacific – China, Japan, South Korea, India, Australia, Singapore, Rest of APAC; Latin America – Brazil, Mexico, Rest of Latin America; Middle East & Africa – GCC, South Africa, Rest of MEA |
| Competitive Landscape | ACE Holding W.L.L., Allianz, American International Group, Inc., Arthur J. Gallagher & Co., BWI Aviation Insurance, EAA Company Ltd., Global Aerospace, Marsh LLC, Munich Re, Starr Aviation Insurance, Tokio Marine HCC, Travers & Associates Aviation Insurance Agency, LLC, USAIG, Willis Towers Watson, Other Key Players. |
| Customization Scope | Customization for segments and region/country-level will be provided. Moreover, additional customization can be done based on the requirements. |
| Purchase Options | We have three licenses to opt for: Single User License, Multi-User License (Up to 5 Users), Corporate Use License (Unlimited Users and Printable PDF) |





































