


Report Overview
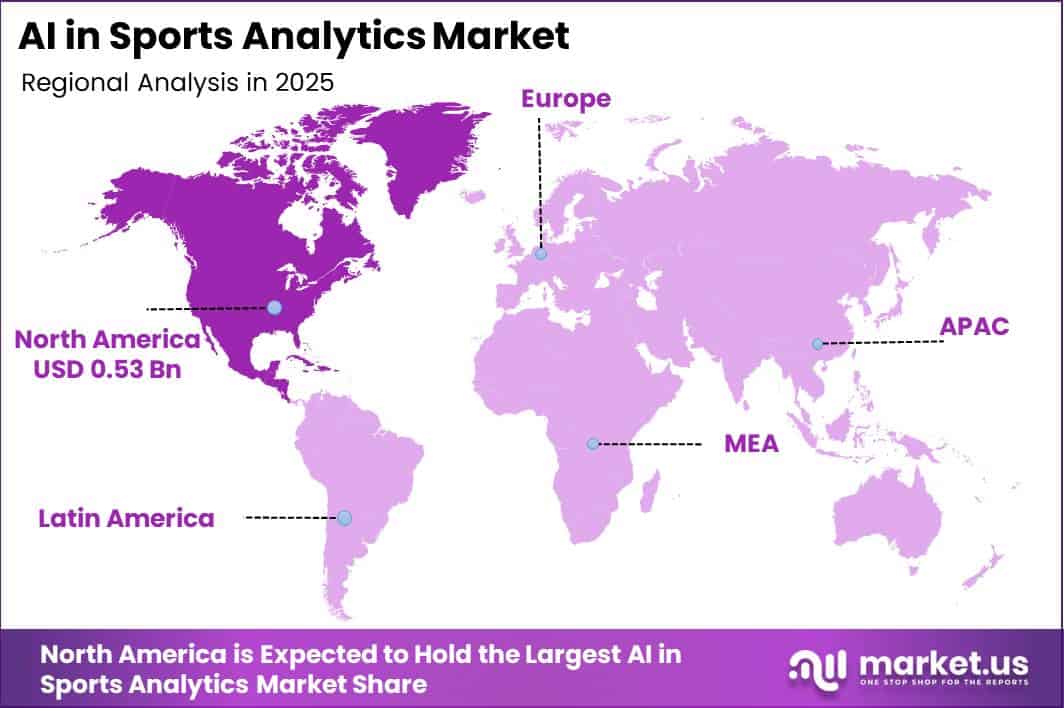
In 2025, the Global AI In Sports Analytics Market was valued at USD 1.6 billion. The market is projected to grow at a CAGR of 33.0% during 2026–2035, reaching approximately USD 27.6 billion by 2035. North America dominated the global market in 2025, accounting for more than 38.0% of the total market share and generating approximately USD 0.5 billion in revenue.
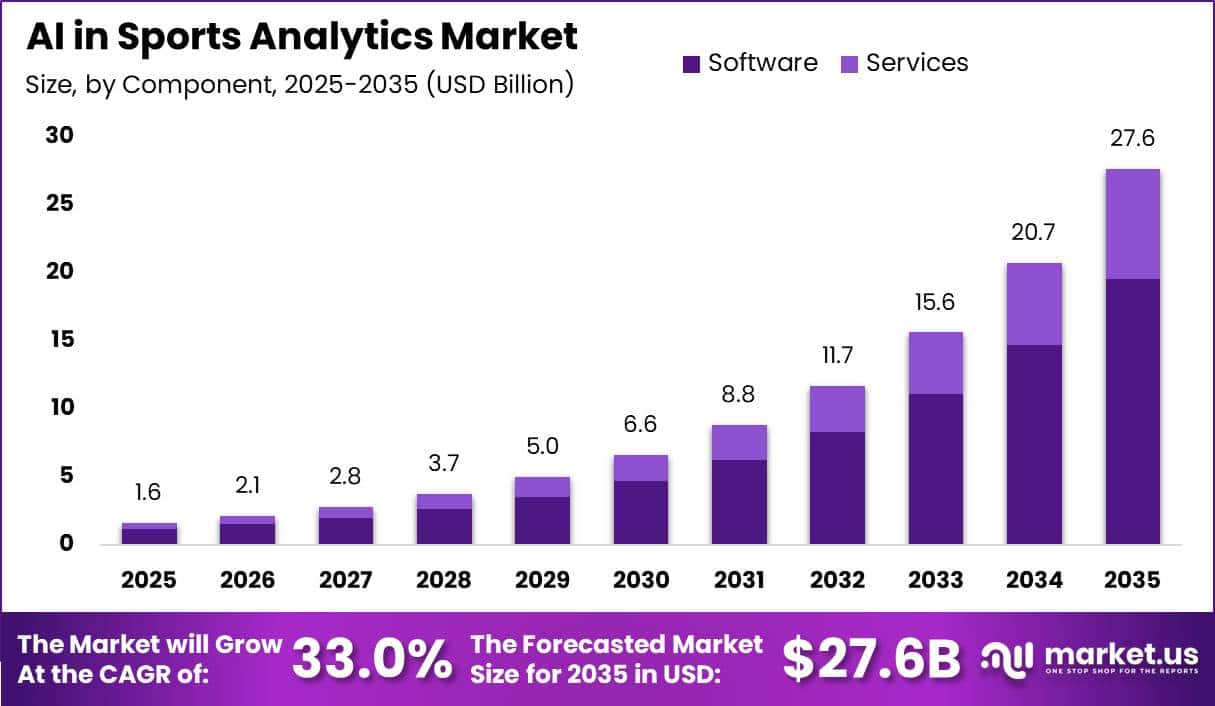
This growth is supported by the continued expansion of the global sports industry and the increasing use of digital technologies for performance monitoring, injury management, and fan engagement. Global sports revenues are expected to reach around USD 417 billion in 2025 and grow by nearly 5% annually, encouraging leagues, teams, venues, and broadcasters to increase spending on data-based technologies.
In addition, global wearable device shipments reached approximately 611.5 million units in 2025, representing a 9.1% year-on-year increase. These devices generate large volumes of biometric, fitness, and movement data that can be converted into useful insights through AI-powered analytics platforms.
The North America region benefits from a well-established sports industry, strong technology infrastructure, and high spending by professional and collegiate organizations. The broader global sports industry was estimated at nearly USD 495 billion in 2025 and is forecast to exceed USD 650 billion by 2030.
Key Takeaway
- The market was valued at USD 1.6 billion in 2025 and is projected to reach USD 27.6 billion by 2035, growing at a CAGR of 33.0%.
- Software accounted for approximately 70.8% of the market, driven by demand for analytics platforms and cloud dashboards.
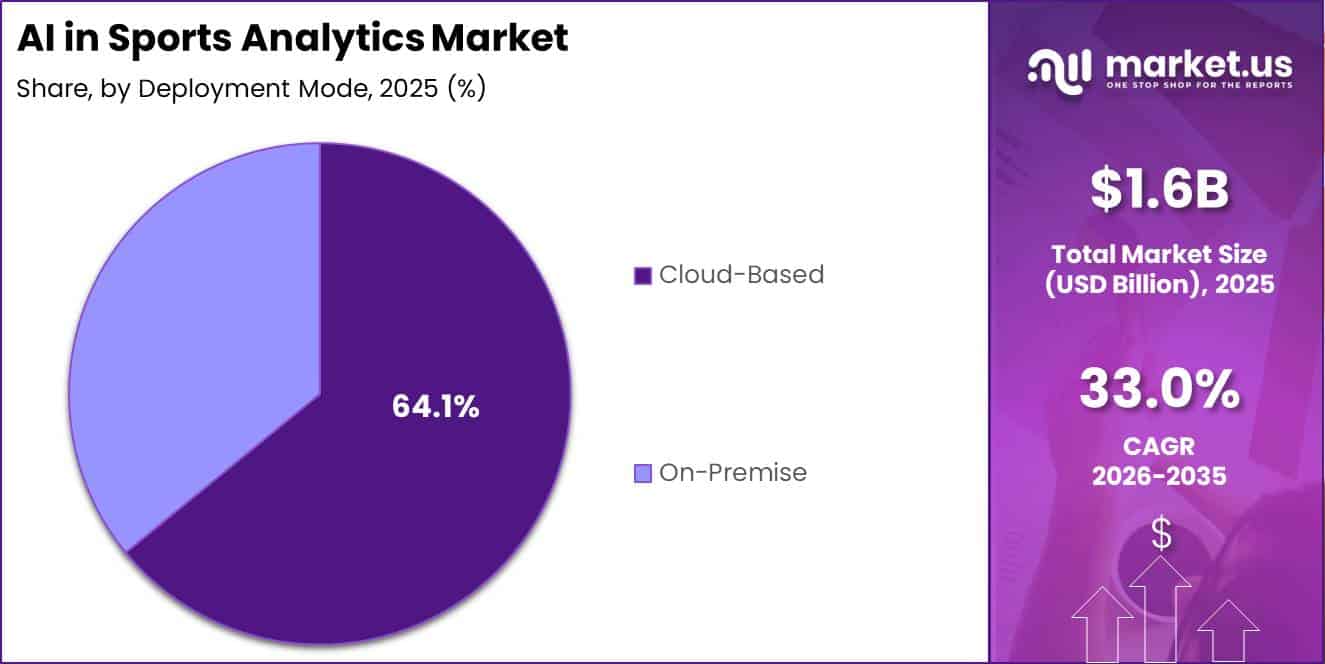
- Cloud-based deployment held a leading 64.1% share due to the need for scalable, high-speed data infrastructure.
- Football was the top sport type with a 20.5% share, supported by its large audience and data-intensive matches.
- North America led the market in 2025 with more than 38.0% share and around USD 0.5 billion in revenue.
By Component
Software accounted for about 70.8% of the AI in sports analytics market, as most of the value in modern sports analytics comes from algorithms, cloud platforms, dashboards, and automated decision-making tools.
Global software-as-a-service revenue is projected to reach around USD 390–490 billion during 2025–2026, showing the growing preference for subscription-based software across industries. Sports clubs and leagues are increasingly following this model for performance analysis, scouting, scheduling, injury management, and fan engagement.
Cameras, sensors, and wearable devices can generate millions of data points during a single match. However, this information provides limited value until AI-powered software processes it into player-tracking results, injury-risk scores, tactical recommendations, and performance forecasts.
By Deployment Mode
Cloud-based deployment held a leading 64.1% share of the AI in sports analytics market, mainly because sports organizations increasingly need flexible infrastructure to manage large, fast-moving datasets.
Global public cloud services are expected to generate more than USD 700 billion in revenue in 2025 and surpass USD 1 trillion around 2026, showing a clear shift from local servers toward scalable cloud platforms. The broader sports technology industry is also estimated at approximately USD 23 billion in 2025, while the industry cloud market is projected to reach nearly USD 1.4 trillion by 2027.
Professional leagues can generate millions of positional, video, and biometric data points from each match across dozens of teams and hundreds of games every season. Processing this information requires high-speed data transfer, petabyte-scale storage, and advanced GPU computing, which can be deployed more quickly and economically through cloud systems than through on-premises infrastructure.
By Sport Type
Football held a leading 20.5% share of the AI in sports analytics market, supported by its large global audience, strong commercial revenues, and highly data-intensive match format. According to FIFA, football-related revenue reached USD 7.6 billion during the 2019–2022 cycle, while the organization is targeting USD 11 billion for 2023–2026.
In 2023 alone, FIFA generated USD 267 million from broadcasting and USD 80 million from ticketing and hospitality. Major tournaments also attract billions of television impressions and more than 1.4 billion digital video views, creating significant volumes of performance, positional, and fan-engagement data.
A standard football match includes 22 players competing for 90 minutes in a continuous playing environment. Each match produces thousands of trackable events, including passes, runs, pressing actions, player positioning, and defensive formations.
Key Market Segments
By Component
- Software
- Services
By Deployment Mode
- Cloud-Based
- On-Premise
By Sport Type
- Football
- Basketball
- Cricket
- Baseball
- Tennis
- Rugby
- Other
Geopolitical Impact Analysis
Geopolitical tensions are increasing the cost and delivery risks of AI in sports analytics systems, which depend on GPUs, high-performance servers, networking equipment, cameras, and cloud data centres. According to the WTO–IMF Tariff Tracker, average tariffs on information and communication technology equipment increased by approximately 3–7 percentage points in several major economies after 2022.
WTO data also showed that global merchandise trade volume declined by about 1.2% in 2023, while tariffs on non-agricultural manufactured goods remained in the mid-single-digit range. These conditions raise the cost of imported chips, cameras, edge servers, and stadium networking systems. A 5% tariff on essential hardware can directly increase capital expenditure for sports clubs, venues, and technology providers, while also contributing to higher cloud subscription and analytics service prices.
Shipping disruptions are creating further pressure on project schedules and logistics costs. UNCTAD reported that Red Sea security concerns and vessel diversions away from the Suez Canal increased Asia–Europe transit times by around 10–15 days. Container freight rates on some routes also rose by more than 200% in early 2024 compared with 2023 levels. A delay of approximately 2 weeks in receiving servers, storage systems, or specialist cameras can force clubs to postpone installations until the next competition period.
When tariffs, freight charges, insurance premiums, and supply shortages are combined, imported AI analytics hardware may cost around 10–20% more than pre-2022 levels. These pressures are encouraging cloud-based deployment and multi-supplier procurement, but they may still slow technology adoption and create more volatile pricing across the AI in sports analytics market.
Regional Analysis
North America held a dominant position in the AI in sports analytics market, accounting for approximately 38.0% of global revenue and generating around USD 0.5 billion in 2025. This leadership is supported by the early adoption of AI technologies across major professional leagues, including the NFL, NBA, MLB, NHL, and MLS, along with a large collegiate sports network.
Thousands of teams, training facilities, and stadiums across the region invest in player tracking, injury analysis, tactical planning, video analytics, and personalized fan engagement. Strong sports media revenues, advanced cloud infrastructure, and high technology spending allow leading clubs and franchises to allocate 6-figure and 7-figure annual budgets to analytics platforms. These factors support recurring demand for AI software, data services, and cloud-based sports solutions.
Asia Pacific is expected to be the fastest-growing regional market, registering growth rates in the low-to-mid 20% range. China, India, Japan, South Korea, and Australia are expanding smart stadiums, AI-supported training facilities, digital broadcasting systems, and 5G-enabled fan engagement platforms.
Growth in domestic sports leagues, sponsorship income, media rights, and government-backed digital infrastructure is further supporting adoption. Starting from a smaller revenue base, Asia Pacific could account for more than 20% of global AI in sports analytics spending over the next decade.
Key Regions and Countries
- North America
- US
- Canada
- Europe
- Germany
- France
- The UK
- Spain
- Italy
- Rest of Europe
- Asia Pacific
- China
- Japan
- South Korea
- India
- Australia
- Rest of APAC
- Latin America
- Brazil
- Mexico
- Rest of Latin America
- Middle East & Africa
- GCC
- South Africa
- Rest of MEA
Market Dynamics
Drivers
| Driver | (~) % CAGR | Geographic Relevance | Impact Timeline |
|---|---|---|---|
| Rapid adoption of player tracking & performance analytics | +4.0% | North America, Europe, Asia Pacific | Short term (<= 2 years) |
| Expansion of smart stadium infrastructure | +3.0% | Global tier-1 & tier-2 leagues | Medium term (2 to 4 years) |
| Growth in sports media & betting data monetization | +2.5% | North America, Europe | Short term (<= 2 years) |
| Institutional investment in cloud & AI platforms | +2.0% | Global | Medium term (2 to 4 years) |
| Wearable device penetration in professional sports | +1.5% | Global elite & semi-pro teams | Short term (<= 2 years) |
Rapid adoption of player tracking & performance analytics
Rapid adoption of player tracking and performance analytics is estimated to add around 4.0% to the market’s baseline CAGR. More than 80% of top-tier football teams now use optical or wearable tracking systems, compared with less than 30% a decade ago. These tools capture tens of thousands of movement, biometric, and event data points per match, allowing clubs to improve coaching, injury management, player selection, and contract decisions.
Tracking-camera and sensor deployments have increased by approximately 15–20% annually since 2023, while analytics team headcount has risen by nearly 30% in some leagues. Sports media and sponsorship revenues are growing at mid-single-digit rates, enabling clubs to allocate an estimated 5–10% of additional income to performance technology. This shift from one-time hardware purchases toward recurring AI software, cloud processing, and analytics subscriptions supports the market’s strong projected CAGR of 33.0%.
Restraints
| Restraint | (~) % CAGR | Geographic Relevance | Impact Timeline |
|---|---|---|---|
| High upfront cost of AI infrastructure for mid-tier clubs | -3.5% | Global | Short term (<= 2 years) |
| Data privacy & biometric regulation constraints | -2.5% | Europe, North America | Medium term (2 to 4 years) |
| Persistent high interest rate environment | -2.0% | Global | Short term (<= 2 years) |
| Uneven digital infrastructure in emerging leagues | -1.5% | Asia Pacific, Latin America, Africa | Long term (>= 4 years) |
| Conservative procurement cultures in federations | -1.0% | Global | Medium term (2 to 4 years) |
High upfront cost of AI infrastructure for mid-tier clubs
High upfront infrastructure costs could reduce the market’s effective growth rate by around 3.5%, particularly among mid-tier clubs. Benchmark interest rates remained near 4–5% during 2024–2025, while borrowing costs for club and stadium projects often reached the high-single-digit range.
A stadium-scale tracking and computing installation can require CapEx equal to approximately 5–10% of a mid-tier club’s annual operating budget, with payback periods extending beyond 5 seasons in lower-revenue leagues.
Many clubs also operate with margins below 10%, limiting available funds for technology upgrades. As a result, buyers may delay projects or choose lower-cost, software-only solutions, restraining near-term growth below the market’s projected 33.0% CAGR.
Challenges
| Challenge | (~) % CAGR | Geographic Relevance | Mitigation Horizon |
|---|---|---|---|
| Specialized AI talent shortage | -3.0% | Global | Long term (>= 4 years) |
| Integration complexity with legacy systems | -2.5% | Global professional leagues | Medium term (2 to 4 years) |
| Variable data quality across competitions | -2.0% | Global | Medium term (2 to 4 years) |
| Cybersecurity & data breach risk | -1.8% | Global | Long term (>= 4 years) |
| Operational change-management in clubs | -1.5% | Global | Medium term (2 to 4 years) |
Specialized AI talent shortage
The shortage of specialized AI and sports data talent drags the realizable CAGR by roughly 3.0% as clubs struggle to turn deployed tools into sustained competitive advantage. According to OECD and LinkedIn workforce analytics, global demand for data scientists and machine-learning engineers grew by more than 20% annually between 2023 and 2025, while supply increased at only around 10% per year, creating a widening skills gap.
Strategically, this friction slows the rollout of advanced use cases such as real-time tactical optimization and individualized injury-risk prediction, elongates project timelines by 6–12 months in some deployments, and pushes clubs to prioritize simpler, pre-configured analytics over custom solutions, lowering the ceiling on potential growth without halting current sales.
Opportunities
| Opportunity | (~) % CAGR | Geographic Relevance | Execution Window |
|---|---|---|---|
| Direct-to-fan AI personalization & monetization | +3.5% | Global | Medium term (2 to 4 years) |
| Expansion into amateur & youth sports ecosystems | +3.0% | Global | Long term (>= 4 years) |
| AI-enabled injury prevention & health analytics services | +2.5% | Global | Medium term (2 to 4 years) |
| Cross-vertical licensing of sports AI engines | +2.0% | Global | Long term (>= 4 years) |
| Regulatory-driven data commercialization frameworks | +1.5% | Europe, North America | Medium term (2 to 4 years) |
Direct-to-fan AI personalization & monetization
Direct-to-fan AI personalization and monetization could add around 3.5% above the market’s baseline CAGR. Digital followers and streaming audiences increased by approximately 10–15% annually between 2023 and 2025, while average digital revenue per fan remained in the low-single-digit range. This creates opportunities for personalized content, dynamic ticket pricing, targeted merchandise, and micro-subscription services.
Digital microtransactions are growing by more than 20% annually in several markets. Clubs using AI recommendation engines and dynamic pricing tools have reported conversion improvements of around 15–30%, while profit margins can increase by 5–10 percentage points.
As current AI sports analytics systems mainly support coaching and performance, reusing the same data for fan services could strengthen revenue without matching increases in hardware or cloud costs. This opportunity could lift market growth above the projected 33.0% CAGR.
Key Players Analysis
Tier-1 participants in AI sports analytics are large enterprise software and cloud providers that integrate sports applications into broader AI, data, and infrastructure portfolios. IBM generated USD 67.5 billion in revenue in 2025, including USD 29.9 billion from software and USD 7.7 billion from automation. It also invested USD 8.3 billion in R&D, equal to about 12.3% of revenue, supporting hybrid-cloud, computer-vision, and analytics capabilities.
IBM is positioned among the top 3 vendors, with a low-teens share of global spending. SAP SE reported €36.8 billion, or approximately USD 40 billion, in 2025 revenue, with €21.0 billion, or about 57%, coming from cloud services. Microsoft’s FY2025 Intelligent Cloud revenue increased 19%, Azure and other cloud services grew 31%, and AI services expanded 157%.
IBM, SAP, and Microsoft may each capture around 10–15% of the broader AI sports analytics technology stack. Salesforce and SAS Institute also compete through CRM, fan personalization, predictive analytics, and injury-risk modelling.
Tier-2 companies are smaller but more focused on sports-specific technologies. Catapult generated approximately £86.6 million, or around USD 110 million, in 2025 revenue, rising 16.5% year on year. KINEXON, Second Spectrum, ChyronHego, Exasol, and Stats Perform specialize in tracking, live graphics, high-speed databases, automated content, and sports data services.
Stats Perform is often viewed as a top-5 sports data provider with a mid-to-high-single-digit share of outsourced sports data and analytics revenue. These specialists concentrate investment on computer vision, low-latency tracking, and automated highlights, while Tier-1 vendors lead the cloud, data, and integration layers.
Top Key Players in the Market
- IBM Corporation
- SAP SE
- SAS Institute Inc.
- Catapult
- Stats Perform
- Salesforce, Inc.
- Microsoft Corporation
- Exasol
- KINEXON
- Second Spectrum
- ChyronHego
Recent Developments
- In May 2026, SportAI acquired Padelytics to create an integrated AI and video-analysis platform for padel, tennis, and pickleball. The combined solution brings together computer vision, biomechanical analysis, automated highlights, and coaching insights. The acquisition targets a market of more than 35 million active padel players, with registered membership rising 42% year on year.
- In November 2025, IBM and Agassi Sports Entertainment Corporation announced a multi-year partnership to develop an AI-powered racket-sports platform. Andre Agassi, an 8-time Grand Slam champion, is contributing to the coaching methodology.
- In January 2026, IBM and the All England Lawn Tennis Club renewed their 36-year partnership through a new multi-year agreement covering AI, cloud, and digital transformation for Wimbledon. During the 2025 Championships, IBM-supported features contributed to a 16% increase in digital engagement and 19% growth in mobile app usage. More than 20 million fans used Wimbledon’s digital platforms, while the app maintained a 4.9-star rating.
Report Scope
| Report Features | Description |
|---|---|
| Market Value (2025) | USD 1.6 Billion |
| Forecast Revenue (2035) | USD 27.6 Billion |
| CAGR (2026-2035) | 33.0% |
| Base Year for Estimation | 2025 |
| Historic Period | 2020-2024 |
| Forecast Period | 2026-2035 |
| Report Coverage | Revenue Forecast, Market Dynamics, Competitive Landscape, Recent Developments |
| Segments Covered | By Component (Software, Services); By Deployment Mode (Cloud-Based, On-Premise); By Sport Type (Football, Basketball, Cricket, Baseball, Tennis, Rugby, Other) |
| Regional Analysis | North America – US, Canada; Europe – Germany, France, The UK, Spain, Italy, Rest of Europe; Asia Pacific – China, Japan, South Korea, India, Australia, Singapore, Rest of APAC; Latin America – Brazil, Mexico, Rest of Latin America; Middle East & Africa – GCC, South Africa, Rest of MEA |
| Competitive Landscape | IBM Corporation, SAP SE, SAS Institute Inc., Catapult, Stats Perform, Salesforce, Inc., Microsoft Corporation, Exasol, KINEXON, Second Spectrum, ChyronHego |
| Customization Scope | Customization for segments, region/country-level will be provided. Moreover, additional customization can be done based on the requirements. |
| Purchase Options | We have three licenses to opt for: Single User License, Multi-User License (Up to 5 Users), Corporate Use License (Unlimited Users and Printable PDF) |





























