


Report Overview
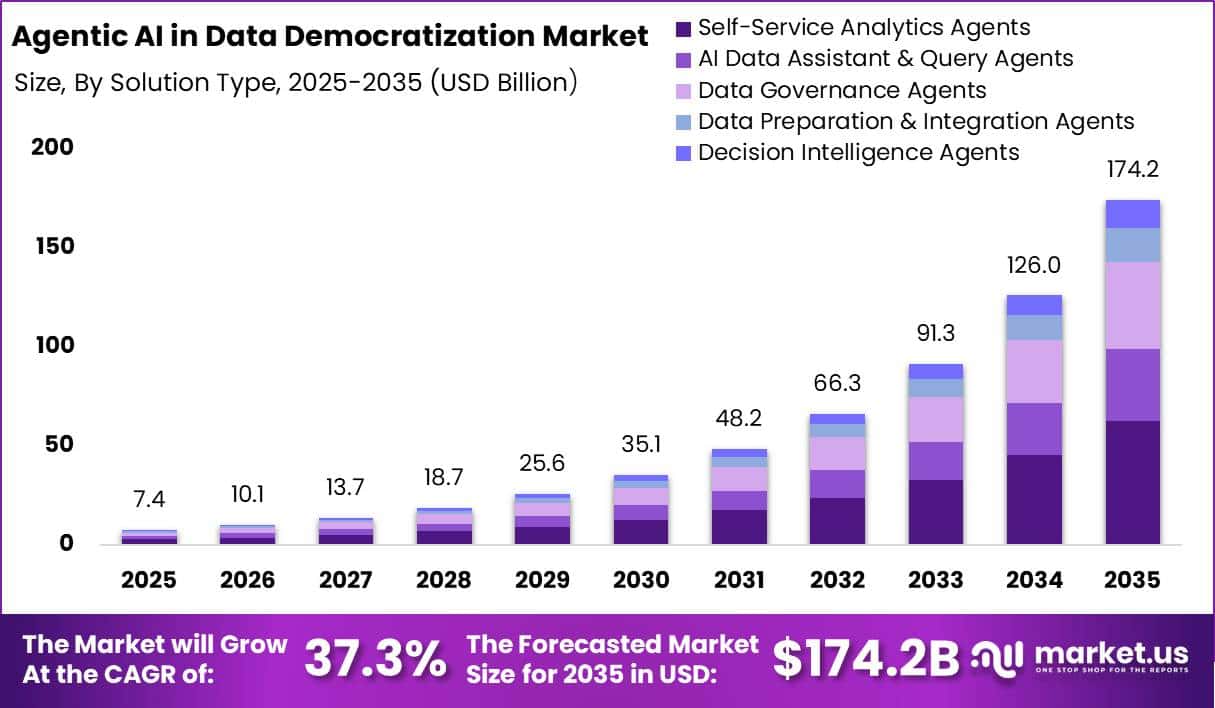
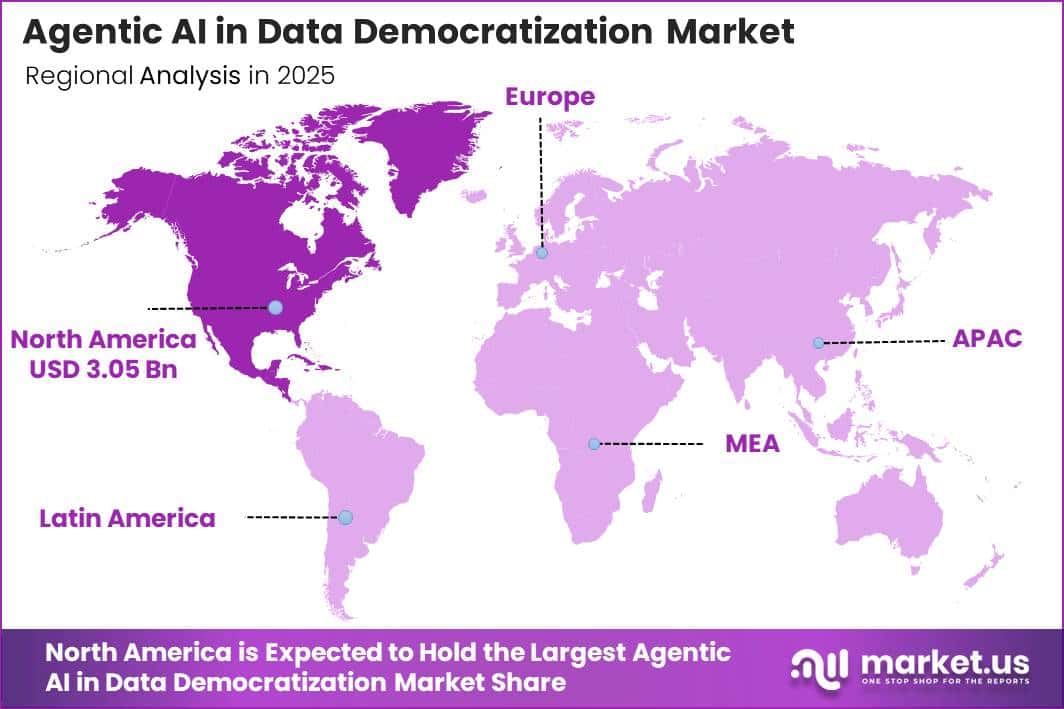
In 2025, the Global Agentic AI in Data Democratization Market was valued at USD 7.4 billion. The market is projected to grow at a CAGR of 37.3% during 2026–2035, reaching approximately USD 174.2 billion by 2035. North America dominated the global market in 2025, accounting for more than 41.3% of the total market share and generating approximately USD 3.05 billion in revenue.
According to the U.S. Bureau of Economic Analysis, the U.S. digital economy generated USD 2.6 trillion in 2022, representing 10.0% of national GDP. It expanded at an average annual rate of 7.1%, compared with 1.9% growth in the overall U.S. economy. Similarly, the OECD reported that the ICT sector across 27 member countries grew by 7.6% in 2023, nearly 3 times faster than their combined economic growth.
Rising internet traffic is also strengthening market demand. The International Telecommunication Union reported that global fixed-broadband traffic increased from 6.2 zettabytes in 2024 to 7.3 zettabytes in 2025. Mobile broadband traffic also rose from 1 zettabyte in 2023 to 1.5 zettabytes in 2025, reflecting annual growth of nearly 19%.
Key Takeaway
- The market was valued at USD 7.4 billion in 2025 and is projected to reach USD 174.2 billion by 2035 at a CAGR of 37.3%.
- Self-Service Analytics Agents held the leading solution type share at 35.9%, while AI Data Assistant & Query Agents is the fastest-growing segment.
- Machine Learning & Predictive Analytics led the technology segment with a 33.8% share, while Agentic AI & Autonomous Data Agents is the fastest-growing technology.
- Cloud-Based Deployment dominated with a 68.5% share, while Hybrid Deployment is the fastest-growing mode.
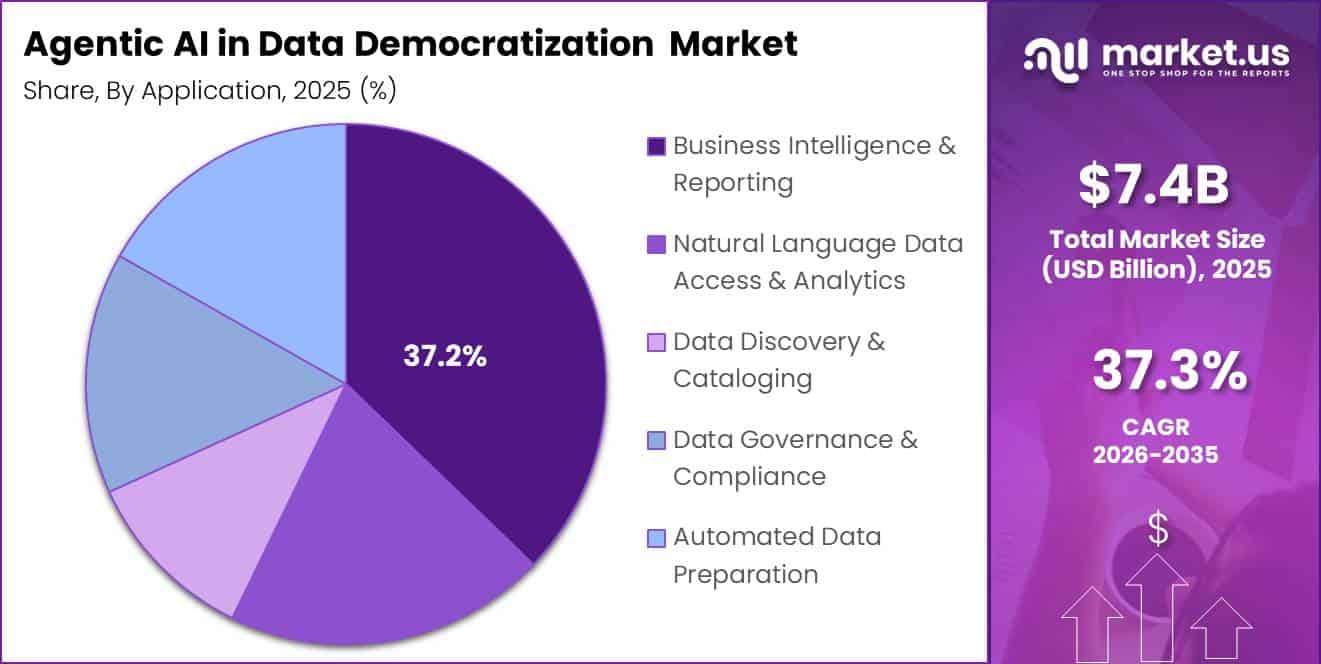
- Business Intelligence & Reporting led applications with a 37.2% share, while Natural Language Data Access & Analytics is the fastest-growing application.
- Large Enterprises held a 61.8% share by organization size, while Small & Medium Enterprises is the fastest-growing segment.
- Structured Enterprise Data led with a 52.6% share, while Unstructured Data is the fastest-growing data type.
- BFSI held the leading end-user industry share at 24.7%, while Healthcare & Life Sciences is the fastest-growing sector.
- Data Access and Insights Generation led by function with a 39.4% share, while Autonomous Decision Support is the fastest-growing function.
- North America led the global market with more than 41.3% share and USD 3.05 billion in revenue in 2025.
By Solution Type
Self-Service Analytics Agents held a leading 35.9% market share, supported by the growing shortage of skilled data professionals. The U.S. Bureau of Labor Statistics projects data scientist employment to increase by 34% between 2024 and 2034, with around 23,400 job openings expected each year. However, this supply remains insufficient compared with the rapidly rising data-processing needs of large enterprises.
Employment in computer systems design is also forecast to grow by 19.5% through 2033, increasing competition for workers with analytics and technology skills. Self-service analytics agents address this gap by automatically building queries, cleaning datasets, and creating visual reports. These capabilities allow non-technical employees to access business insights without depending on dedicated analysts.
By Technology
Machine Learning and Predictive Analytics held a leading 33.8% market share because these technologies remain the most established foundation for enterprise AI systems. According to the USPTO’s 2025 AI Strategy report, AI-related patent applications increased by 33% since 2018 and were recorded across 60% of all technology subclasses.
Agentic AI and Autonomous Data Agents are expected to be the fastest-growing technology segment as investment shifts toward systems that can operate with limited human involvement. UNCTAD’s Technology and Innovation Report 2025 stated that global AI investment was expected to double to USD 200 billion between 2022 and 2025, reaching nearly 3 times the level of global climate-related spending.
By Deployment Mode
Cloud-Based Deployment held a leading 68.5% market share as cloud infrastructure became the preferred IT model across major economies. Eurostat reported that 52.7% of EU enterprises used paid cloud computing services in 2025, representing an increase of 7.4 percentage points from 2023. Cloud adoption reached 79.2% in Finland during the same year.
In the United States, the GSA’s FedRAMP program authorized 114 cloud services in fiscal year 2025, more than 2 times the previous year’s total. Agentic AI systems require flexible computing power to support continuous queries, real-time data access, and automated tasks across departments. Cloud platforms can expand these resources more efficiently than fixed on-premises servers.
Hybrid Deployment is expected to be the fastest-growing mode because regulated industries require cloud scalability while maintaining greater control over sensitive information. U.S. federal agencies increased their use of FedRAMP-authorized cloud services from 1,029 in fiscal year 2019 to 3,612 in fiscal year 2022, representing growth of 251%.
By Application
Business Intelligence and Reporting held a leading 37.2% market share because companies must continuously prepare financial, operational, and compliance reports. The SEC’s EDGAR system processes XBRL-tagged disclosures from U.S. public companies every quarter, including income statements, balance sheets, and cash-flow information submitted through Form 10-K and Form 10-Q filings.
This creates a steady flow of structured data that businesses must review and convert into clear reports. The U.S. Census Bureau also projected 29,741 new business formations in June 2026, increasing demand for reporting systems among newly established companies. Agentic AI tools can automatically organize data, prepare dashboards, and deliver timely insights to managers.
By Organization Size
Large Enterprises held a leading 61.8% market share because their complex operations generate large volumes of financial, customer, and operational data. According to the U.S. Small Business Administration, small businesses contribute 43.5% of U.S. GDP despite representing 99.9% of all firms, while larger companies with 500 or more employees account for a substantial share of the remaining economic output.
Small and Medium Enterprises are expected to be the fastest-growing segment because falling software costs are opening access to a large underserved customer base. The SBA reported 36.2 million small businesses in the United States, employing 62.3 million people, equal to 45.9% of private-sector workers. Small businesses also generated 88.9% of the country’s net employment increase during the latest measured year. However, many SMEs cannot afford dedicated data scientists or analytics teams.
By Data Type
Structured Enterprise Data held a leading 52.6% market share because it remains the main format used for financial, administrative, and regulatory records. The U.S. National Archives manages more than 33 billion electronic records, representing nearly 1 petabyte of digital information. Enterprise databases, spreadsheets, and transaction systems commonly store information in structured formats because these records are easier to search, verify, and audit.
Unstructured Data is expected to be the fastest-growing segment as documents, images, and sensor information expand rapidly. NASA’s Earth Observing System increased its cloud archive to 44.25 petabytes and adds around 91.64 terabytes of satellite and sensor data each day. The U.S. National Archives also accessioned 463 terabytes of electronic records in 2024, including information stored in different digital formats.
By End User Industry
BFSI held a leading 24.7% market share because financial institutions generate large volumes of continuously updated transaction data. The FDIC’s Fourth Quarter 2025 Quarterly Banking Profile covered thousands of insured institutions and tracked assets, deposits, loan performance, and earnings. The Federal Reserve also regularly publishes detailed balance-sheet data through its H.8 statistical release.
Healthcare and Life Sciences is expected to be the fastest-growing end-user segment because rising healthcare expenditure is producing more clinical, billing, and administrative data. CMS projected that U.S. national health expenditure would reach USD 5.7 trillion in 2025, increasing by 7.3% from 2024, and approach USD 9 trillion by 2034.
Healthcare spending is expected to grow faster than the projected average GDP growth rate of 4.3% during the same period. Higher spending creates more patient visits, insurance claims, laboratory results, and diagnostic records.
By Function
Data Access and Insights Generation held a leading 39.4% market share because it supports the basic need to convert raw business data into useful information. According to the U.S. Bureau of Labor Statistics, management occupations offer a median annual wage of USD 122,090, with around 1.1 million job openings projected each year through 2034.
Autonomous Decision Support is expected to be the fastest-growing function as organizations move from passive data reporting toward AI-supported action. An OECD review published in 2025 examined more than 200 government AI use cases and found that 45% supported decision-making, forecasting, or sense-making.
Key Market Segments
By Solution Type
- Self-Service Analytics Agents
- AI Data Assistant & Query Agents
- Data Governance Agents
- Data Preparation & Integration Agents
- Decision Intelligence Agents
By Technology
- Machine Learning & Predictive Analytics
- Agentic AI & Autonomous Data Agents
- Natural Language Processing (NLP)
- Generative AI & Large Language Models (LLMs)
By Deployment Mode
- Cloud-Based Business Intelligence and Reporting
- On-Premises
- Hybrid Deployment
By Application
- Business Intelligence & Reporting
- Natural Language Data Access & Analytics
- Data Discovery & Cataloging
- Data Governance & Compliance
- Automated Data Preparation
By Organization Size
- Large Enterprises
- Small & Medium Enterprises (SMEs)
By Data Type
- Structured Enterprise Data
- Unstructured Data
- Semi-Structured Data
By End User Industry
- BFSI
- Healthcare & Life Sciences
- Retail & E-commerce
- IT & Telecommunications
- Manufacturing
- Government & Public Sector
By Function
- Data Access & Insights Generation
- Autonomous Decision Support
- Data Literacy Enablement
- Collaboration & Knowledge Sharing
Geopolitical Impact Analysis
Geopolitical tensions are creating cost and supply risks for the Agentic AI in Data Democratization Market because the sector depends heavily on advanced processors, semiconductor equipment, and cloud infrastructure. In January 2026, the White House imposed a 25% tariff on certain AI chips manufactured overseas and re-exported to China, affecting advanced processors supplied by companies such as Nvidia and AMD.
The United States had imported nearly USD 45 billion of semiconductor chips in the previous year, mainly from Taiwan and Malaysia. Export restrictions also limited China’s advanced chip production capacity to around 1–2% of U.S. capacity in 2026.
This creates compliance and procurement challenges for AI vendors operating across Chinese and Western cloud markets. Enforcement also became stricter, as shown by the USD 252 million penalty imposed on Applied Materials in February 2026 for unlawful equipment exports.
Rising electricity demand is adding further pressure to the market’s operating costs. The International Energy Agency expects global data-center electricity consumption to nearly double by 2030, while power use from AI-focused facilities could triple over the same period. Global electricity demand increased by 3% in 2025, with data centers contributing nearly 50% of total U.S. electricity-demand growth.
This trend may raise cloud-computing costs, particularly in regions with limited grid capacity. Semiconductor equipment availability is another concern, as ASML’s sales exposure to China is projected to decline from 33% to 20% in 2026 amid tighter export controls. Reduced access to advanced chipmaking tools could delay processor supply, increase infrastructure expenses, and slow the deployment of agentic AI platforms.
Regional Analysis
North America held a leading 41.3% market share and generated approximately USD 3.05 billion in revenue in 2025. This position was supported by strong investment in cloud computing, data centers, and enterprise digital systems. According to the U.S. Bureau of Economic Analysis, real U.S. GDP increased at an annualized rate of 4.4% in the third quarter of 2025.
Information services and professional, scientific and technical services were among the major contributors to this growth. These industries are important users of agentic AI platforms for automated data access, analysis and decision support. The BEA also began separately measuring business investment in data centers in 2025, reflecting the growing economic importance of AI and cloud infrastructure.
Asia-Pacific is expected to be the fastest-growing region as digital activity expands across Southeast and South Asia. The e-Conomy SEA 2025 report projected that Southeast Asia’s digital economy would exceed USD 300 billion in gross merchandise value in 2025, representing a 7.4-times increase over the previous decade.
Regional data-center capacity is projected to rise by 180%, compared with 120% across the wider Asia-Pacific region. UN ESCAP reported that digitally deliverable services trade reached nearly USD 958 billion, accounting for 52% of regional service exports. More than 680 AI startups have also attracted over USD 2.3 billion in funding, supporting rising demand for agentic AI solutions.
Key Regions and Countries
North America
- US
- Canada
Europe
- Germany
- France
- The UK
- Spain
- Italy
- Rest of Europe
Asia Pacific
- China
- Japan
- South Korea
- India
- Australia
- Rest of APAC
Latin America
- Brazil
- Mexico
- Rest of Latin America
Middle East & Africa
- GCC
- South Africa
- Rest of MEA
Market Dynamics
Drivers
| Driver | (~) % CAGR | Geographic Relevance | Impact Timeline |
|---|---|---|---|
| End-to-end agentic analytics workflows | +6.0% | North America, Europe, East Asia | Short term (≤ 2 years) |
| Enterprise adoption of AI agents for data operations | +5.0% | Global large enterprises | Short term (≤ 2 years) |
| Rapid uptake of vector-capable data platforms | +4.0% | Global cloud-centric markets | Medium term (2–4 years) |
| Integration of agentic AI into BI & analytics tools | +3.5% | North America, Europe | Medium term (2–4 years) |
| AI agents in vertical data workflows (finance, health, supply chain) | +3.0% | OECD economies | Long term (≥ 4 years) |
| Cloud hyperscaler native agent frameworks for data | +2.5% | Global | Medium term (2–4 years) |
End-to-end agentic analytics workflows
End-to-end agentic analytics workflows are becoming a major growth engine by turning manual processes such as data ingestion, transformation, querying, insight generation, and action triggering into largely autonomous, closed-loop systems. These workflows can reduce decision times from weeks to hours or even minutes in enterprises managing thousands of data assets.
The key shift over the past 2 years has been the combination of reliable foundation models with production-grade orchestration frameworks. This allows AI agents to connect 10–20 separate data tasks with success rates above 90% on well-structured internal datasets. Early adopters have reported reductions of roughly 30–50% in analytics cost per decision across areas such as customer support and supply chain optimization.
Commercially, this trend supports a move from seat-based BI licensing toward consumption- or outcome-based contracts. Over the next 3–4 years, the share of analytics budgets allocated to agentic AI data stacks could rise from low single digits to the mid-teens of total spending. This shift may add around +6.0 percentage points to the baseline CAGR by moving demand away from static reporting tools toward continuously operating AI agents.
Restraints
| Restraint | (~) % CAGR | Geographic Relevance | Impact Timeline |
|---|---|---|---|
| Compliance exposure under emerging AI governance regimes | -4.5% | EU, UK, increasingly global | Short term (≤ 2 years) |
| High-quality proprietary data access barriers | -3.5% | Global regulated industries | Medium term (2–4 years) |
| Compute and storage cost inflation for always-on agents | -3.0% | Global cloud users | Short term (≤ 2 years) |
| Organizational risk aversion to autonomous decisions | -2.5% | Conservative enterprise segments | Medium term (2–4 years) |
| Data residency and cross-border transfer constraints | -2.0% | EU, Middle East, parts of APAC | Long term (≥ 4 years) |
| Vendor lock-in concerns in agent orchestration stacks | -1.5% | Large global enterprises | Medium term (2–4 years) |
Compliance exposure under emerging AI governance regimes
Compliance exposure under emerging AI governance regimes is the most immediate restraint because it can directly delay or freeze deployments of agentic AI systems that process sensitive enterprise data, particularly in jurisdictions where risk-based AI legislation has already entered into force with phased applicability over the next 2 years.
For example, the EU AI Act’s high-risk system obligations around technical documentation, risk management, human oversight, and transparency—backed by potential fines of up to 35 million euros or 7% of global annual turnover for the most serious infringements—force enterprises to reroute 10–20% of planned AI implementation budgets toward compliance engineering, auditing, and legal review instead of net-new agentic AI in data deployments.
Quantitatively, this translates into multi-quarter delays in go-live dates for cross-border analytics agents handling customer or operational data, deferral of contracts in regulated sectors, and a material increase in non-revenue-generating OpEx as companies build internal AI governance, effectively shaving an estimated 3–5 percentage points from the otherwise achievable growth trajectory during the initial enforcement window.
Challenges
| Challenge | (~) % CAGR | Geographic Relevance | Mitigation Horizon |
|---|---|---|---|
| Agentic data quality assurance | -4.0% | Global | Medium term (2–4 years) |
| Shortage of agentic AI data engineers | -3.5% | North America, Europe, APAC | Long term (≥ 4 years) |
| Complex integration with legacy data estates | -3.0% | Incumbent-heavy sectors | Long term (≥ 4 years) |
| Evaluation and monitoring of autonomous agents | -2.5% | Global | Medium term (2–4 years) |
| Fragmented tooling across orchestration, vector, and BI | -2.0% | Global mid-market | Medium term (2–4 years) |
| Unclear ROI benchmarks for agentic analytics | -1.5% | Emerging adopters | Short term (≤ 2 years) |
Agentic data quality assurance
Agentic data quality assurance is a structurally limiting challenge because autonomous agents amplify both clean and dirty data at machine speed, and most enterprises still report that 20–40% of their key data entities contain material quality issues that manual processes only partially detect.
When AI agents are allowed to autonomously join 10+ tables, enrich with external sources, and trigger downstream actions, even a 2–3% undetected error rate in master data or event streams can cascade into thousands of incorrect operational decisions per month in large organizations, forcing conservative guardrails that cap the degree of autonomy and thus the achievable ROI.
To navigate this, vendors and enterprises must invest in embedded schema validation, statistical anomaly detection, and continuous evaluation pipelines, often adding 10–20% to initial implementation costs and several months to rollout timelines, which slows expansion across business units even as the core technology matures.
Opportunities
| Opportunity | (~) % CAGR | Geographic Relevance | Execution Window |
|---|---|---|---|
| Agentic data copilots for non-technical business users | +5.5% | Global | Medium term (2–4 years) |
| Verticalized agentic data platforms for regulated sectors | +4.5% | Finance, healthcare, public sector | Long term (≥ 4 years) |
| Monetization of agentic data automation via outcome-based pricing | +3.5% | North America, Europe | Medium term (2–4 years) |
| Expansion into vector-native data infrastructure bundles | +3.0% | Cloud-centric enterprises | Long-term (≥ 4 years) |
| Cross-system autonomous optimization (supply chain, finance, CX) | +2.5% | Global multinationals | Long-term (≥ 4 years) |
| SMB-focused managed agentic data services | +2.0% | Global mid-market and SMB | Medium-term (2–4 years) |
Agentic data copilots for non-technical business users
Agentic data copilots for non-technical business users represent a major untapped opportunity. They can move agentic AI beyond specialist data teams and embed it into the daily work of sales representatives, finance managers, and operations leaders.
From a commercial perspective, successful copilots could support per-user price premiums of around 20–30% compared with standard analytics licenses. They may also reduce support requests and ad hoc analyst workloads by double-digit percentages. Over the next 2–4 years, adoption among even 10–15% of global knowledge workers could unlock significant unmet demand and potentially add mid-single-digit percentage points to the market’s baseline CAGR.
Key Players Analysis
Tier-1 companies lead the competitive landscape through large cloud platforms, strong research spending, and deeply connected AI ecosystems. Microsoft generated USD 168.9 billion in Microsoft Cloud revenue during FY2025, while Azure expanded by 34% and Intelligent Cloud revenue reached USD 106.3 billion. This scale supports wider adoption of Copilot and Azure AI Foundry for enterprise data access.
Alphabet recorded USD 402.8 billion in FY2025 revenue and invested USD 61.1 billion in research and development, supporting Gemini-based agents across BigQuery and Looker. Oracle reported USD 67.4 billion in FY2026 revenue and USD 10.3 billion in R&D spending, using its database expertise to add autonomous agents to Oracle Fusion applications. IBM generated USD 67.5 billion in revenue and invested USD 8.3 billion in R&D, strengthening watsonx adoption in regulated industries.
Tier-2 competitors mainly differentiate through specialized platforms and industry-focused tools. Salesforce reported USD 41.5 billion in FY2026 revenue and USD 6.0 billion in R&D spending, supporting the expansion of Agentforce. SAP generated USD 36.8 billion in revenue and invested USD 6.6 billion in R&D to embed Joule AI within S/4HANA.
Snowflake recorded USD 4.7 billion in revenue and allocated USD 2.0 billion to R&D, equal to around 42% of revenue, showing strong investment in Cortex AI agents. Databricks, Qlik, ThoughtSpot, Alteryx, Informatica, Collibra, Dataiku, and Tableau compete through data governance, cataloging, and self-service analytics, while larger Tier-1 vendors retain an advantage in platform-wide agentic AI deployment.
Top Key Players in the Market
- Microsoft
- IBM
- Salesforce
- Oracle
- SAP
- Databricks
- Snowflake
- Tableau
- Qlik
- ThoughtSpot
- Alteryx
- Informatica
- Collibra
- Dataiku
Recent Developments
- In November 2025, Salesforce completed its acquisition of Informatica, following the definitive agreement announced in May 2025 at approximately USD 8 billion in equity value and USD 25 per share. The acquisition strengthens Salesforce’s data integration, quality, governance, and metadata capabilities, providing Agentforce with more reliable and unified enterprise data for autonomous decision-making.
- In May 2026, Snowflake signed a 5-year strategic agreement with AWS and committed USD 6 billion to AWS computing and AI infrastructure. The partnership focuses on Graviton processors, governed enterprise data, and large-scale agentic AI deployment. Snowflake has also exceeded USD 7 billion in lifetime AWS Marketplace sales, including more than USD 2 billion during calendar year 2025.
Report Scope
| Report Features | Description |
|---|---|
| Market Value (2025) | USD 7.4 Billion |
| Forecast Revenue (2035) | USD 174.2 Billion |
| CAGR (2026-2035) | 37.3% |
| Base Year for Estimation | 2025 |
| Historic Period | 2020-2024 |
| Forecast Period | 2026-2035 |
| Report Coverage | Revenue Forecast, Market Dynamics, Competitive Landscape, Recent Developments |
| Segments Covered | By Solution Type (Self-Service Analytics Agents, AI Data Assistant & Query Agents, Data Governance Agents, Data Preparation & Integration Agents, Decision Intelligence Agents); By Technology (Machine Learning & Predictive Analytics, Agentic AI & Autonomous Data Agents, Natural Language Processing (NLP), Generative AI & Large Language Models (LLMs)); By Deployment Mode (Cloud-Based, On-Premises, Hybrid Deployment); By Application (Business Intelligence & Reporting, Natural Language Data Access & Analytics, Data Discovery & Cataloging, Data Governance & Compliance, Automated Data Preparation); By Organization Size (Large Enterprises, Small & Medium Enterprises (SMEs)); By Data Type (Structured Enterprise Data, Unstructured Data, Semi-Structured Data); By End User Industry (BFSI, Healthcare & Life Sciences, Retail & E-commerce, IT & Telecommunications, Manufacturing, Government & Public Sector); By Function (Data Access & Insights Generation, Autonomous Decision Support, Data Literacy Enablement, Collaboration & Knowledge Sharing) |
| Regional Analysis | North America – US, Canada; Europe – Germany, France, The UK, Spain, Italy, Rest of Europe; Asia Pacific – China, Japan, South Korea, India, Australia, Singapore, Rest of APAC; Latin America – Brazil, Mexico, Rest of Latin America; Middle East & Africa – GCC, South Africa, Rest of MEA |
| Competitive Landscape | Microsoft, Google, IBM, Salesforce, Oracle, SAP, Databricks, Snowflake, Tableau, Qlik, ThoughtSpot, Alteryx, Informatica, Collibra, Dataiku |
| Customization Scope | Customization for segments, region/country-level will be provided. Moreover, additional customization can be done based on the requirements. |
| Purchase Options | We have three licenses to opt for: Single User License, Multi-User License (Up to 5 Users), Corporate Use License (Unlimited Users and Printable PDF) |





























