


Report Overview
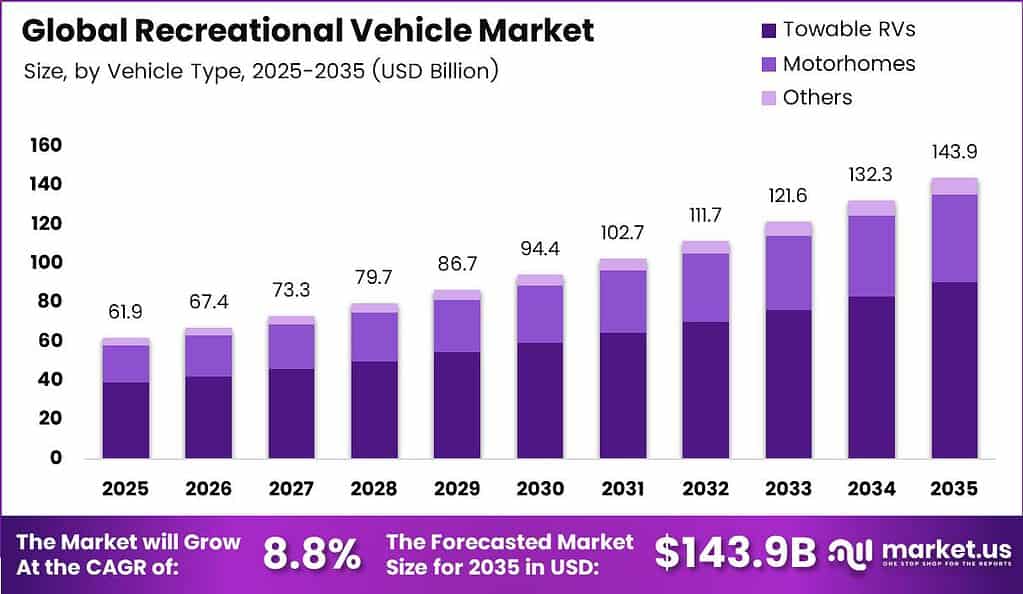
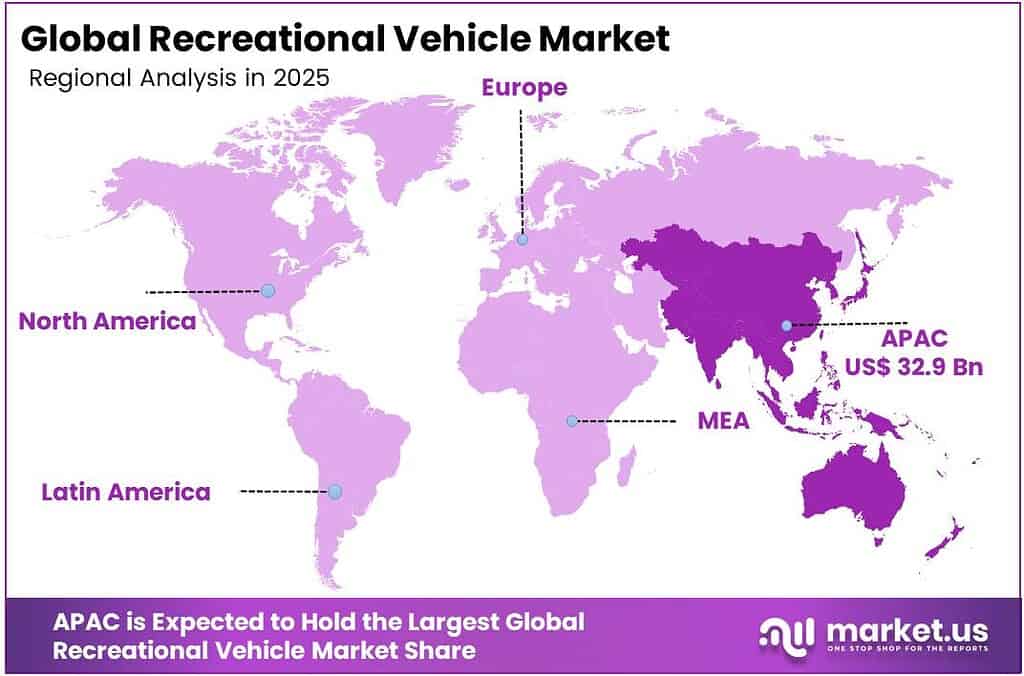
Global Recreational Vehicle (RV) Market forecast shows promising growth with an expected valuation increase from USD 61.9 billion in 2025 to USD 143.9 billion by 2035 while holding an impressive CAGR rate of 8.80%. Asia Pacific held a dominant market position, capturing more than a 53.2% share, holding USD 32.9 million in revenue.
Several factors are driving the growth of the Recreational Vehicle market on a worldwide scale. Normalization of work from home and flexible working hours has made RVs mobile office spaces for the current generation of nomadic entrepreneurs. Technological innovations in batteries and solar panels have increased energy efficiency and reduced costs, attracting eco-conscious customers.
Also, there has been a change in the consumer demographic for RVs with more millennials and Gen Z taking to an adventurous lifestyle that includes camping and exploring new places in RVs. There have been improvements in infrastructure to support and promote the usage of RVs and help them grow throughout the forecast period until 2035.
Key Takeaways
- The global recreational vehicle market is valued at USD 61.9 billion in 2025 and is projected to hit USD 143.9 billion by 2035.
- The industry is set to expand at a steady CAGR of 8.80% during the forecast period from 2025 to 2035.
- Towable RVs dominate the vehicle type segment, accounting for a substantial 62.9% of the total market share.
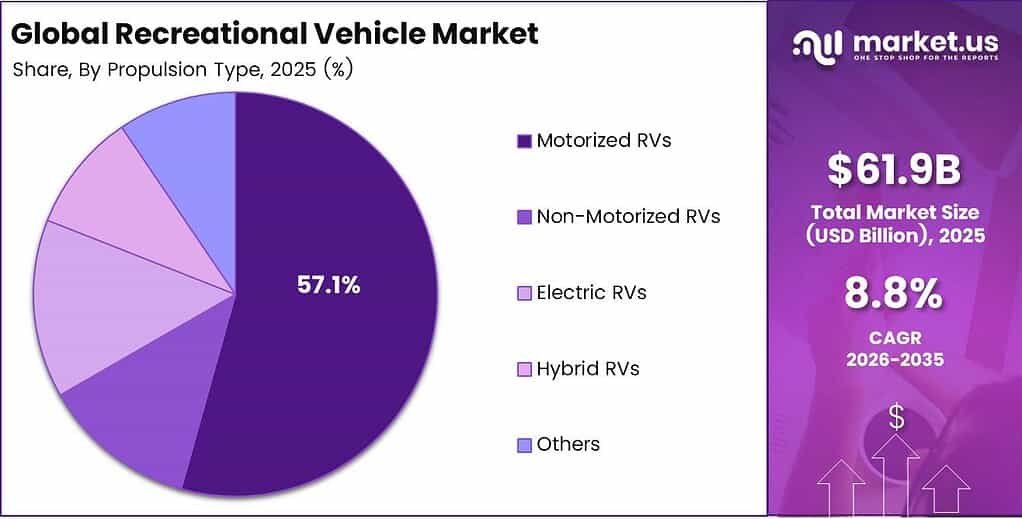
- Motorized RVs lead propulsion types at 57.1%, while Electric RVs emerge as the fastest-growing sub-segment at 6.7%.
- The Personal Use segment maintains the highest application share at 51.1%, driven by a rise in nomadic lifestyles.
- Individual Consumers represent the primary end-user group, capturing 61.1% of the global market revenue.
- Dealership Networks remain the top distribution channel, facilitating 47.9% of all recreational vehicle sales.
- Asia-Pacific stands as the largest regional market, contributing a massive 53.2% to the global industry.
Global Recreational Vehicle Market Scope
Vehicle Type Analysis
Towable RVs Dominated the Global Recreational Vehicle Market Due to Affordability and Flexible Utility
The dominant segment in this industry is Towable RV with an impressive 62.9% Recreational Vehicle market share, owing mainly to its comparatively low price and ease of removal for trips in the immediate vicinity. Among these, Travel Trailers and Fifth Wheels continue to be popular among families and frugal millennials. On the other hand, Motorhomes have a market share of 31.2%, mostly driven by the fast-growing trend of Class B camper vans among the Van Life community.
Among the primary reasons for this trend is economic sensibility, with interest rates making cheap towables more attractive. Another major driving force has been the evolution of technology within this sector, particularly in the form of higher efficiency solar and lithium power in motorized vehicles.
Propulsion Type Analysis
Motorized RVs Dominated the Market Due to Convenience, Integrated Mobility, and Expanding Long-Distance Travel Demand
Motorized RV leads the market due to its strong market share of 57.1%. Such a commanding market position is attributed to the unit value of this market segment because of premium Class A and Class C motor homes that retail at a price point of between $150,000 and more than $400,000. The motorized RVs provide a hassle-free and integrated travel experience without the requirement of a separate towing vehicle, hence attracting many long-distance travelers and those living in RVs.
An increase in consumer preferences for integration of facilities, navigation capabilities, and luxury in their RVs is also responsible for the dominance of the motorized segment. Furthermore, the Asia Pacific is a major contributor to the growth of motorized RVs in view of its dominance in the overall RV market with a market share of 53.2%.
The Electric RV (6.7%) and Hybrid RV (2.8%) are currently growing at an alarming pace due to a 15.9% CAGR expected until 2035. Contributing factors to this trend include government incentives of $7,500 tax credit in North America and increased demand for solar-powered systems (by 32%). On the other hand, the dominance of the Motorized RV market is under threat due to high fuel costs and high-interest rates, forcing manufacturers to shift towards Class B Campervans.
Application Type Analysis
Personal Use Dominated the Recreational Vehicles Market Because of Increasing Interest in Flexible and Experiential Travel
The Personal Use segment will continue to remain the core of the RVs market, capturing 51.1% revenue market share in 2026. This will be driven primarily by the fact that there will be a major shift in travel habits amongst the current generation of buyers, with Millennials and Gen Z comprising about 25% of all RV sales. The reason behind the success of the Personal Use segment is the tendency of younger generations to go camping in remote locations while enjoying convenience at the same time.
The growth in the trend of remote working opportunities is also contributing towards extended use of RVs for long durations by the consumers as they turn these into places of work. Moreover, the popularity of health tourism and eco-friendly travel options has also made the ownership of personal RVs an aspirational lifestyle decision for everyone.
Tourism & Camping is the leading segment, comprising 26.7% of total volume, attributed to increased outdoor activities. The Commercial Use segment holds 12.4%, whereas the Mobile Business/Food Trucks segment holds 6.4%. Others make up 3.4% of total volume.
End-User Analysis
Individual Consumers Dominate Recreational Vehicle Industry Owing to Emerging Travel and Outdoor Trends
Individual Consumers will continue to be the clear market leader, accounting for a 61.1% share. This will be attributed to a number of reasons, including the emergence of a “generational shift,” which brings Millennials and Gen Z up to par with Boomers in buying power, and they now account for one-quarter of all sales. The main contributing factors to market dominance are an increase in telecommuting, making RVs a mobile office, and growing trends in eco-tourism among younger generations.
As for market growth, even though ownership will continue to dominate, the Rental Service (17.9%) and Fleet (11.1%) segments will see the fastest growth, growing at a 6.4% CAGR. Growth in these segments can be attributed to interest rate sensitivity, as the average interest rate in 2026 is projected to be 6%–9%, and the costs associated with RV maintenance. Hence, these segments will favor solar-energized and advanced technology units until 2035.
Distribution Channel Analysis
Dealership Networks Dominated the Recreational Vehicle Market Due to Strong After-Sales Support and Wider Product Availability
Dealerships will continue to dominate the RV sales channel with 47.9% of the market share in 2026. This market leadership is attributed to the so-called “90-day rule,” where dealerships deliver the necessary on-lot stock, competitive financing, and after-sales support that direct-to-consumer channels can’t compete with yet. Drivers in this market channel include established OEM partnerships and the consumer’s preference for side-by-side comparisons of luxury RVs.
As dealerships dominate in terms of volume, Online Sales (8.1%) and Direct Sales (25.7%) will be growing at a faster pace because of the increasing preference for online information from the digitally savvy Millennials and custom factory-built RVs. Inventory holding cost and high-interest rates are some factors driving these market channels today, pushing for the shift towards high turnover used RV inventory and online sales channels up to 2035.
Key Market Segments
By Vehicle Type
- Towable RVs
- Motorhomes
- Others
By Propulsion Type
- Motorized RVs
- Non-Motorized RVs
- Electric RVs
- Hybrid RVs
- Others
By Application Type
- Personal Use
- Tourism & Camping
- Commercial Use
- Mobile Business / Food Trucks
- Others
By End-User
- Individual Consumers
- Rental Service Providers
- Fleet Operators
- Corporate Users
- Others
By Distribution Channel
- Dealership Networks
- Direct Sales
- Rental & Leasing Providers
- Online Sales
- Others
Market Drivers
| Driver | (~) % Impact on CAGR Forecast | Geographic Relevance | Impact Timeline |
|---|---|---|---|
| Experiential outdoor travel demand | +2.1% | North America, Europe, Australia, Asia-Pacific | Short term (≤ 2 years) |
| Flexible-work mobile living adoption | +1.6% | North America, Europe, Australia | Medium term (2–4 years) |
| Peer-to-peer rental platform expansion | +1.3% | North America, Europe, Asia-Pacific | Medium term (2–4 years) |
| Towable RV affordability preference | +0.9% | North America, Europe, Asia-Pacific | Short term (≤ 2 years) |
| Connected vehicle feature adoption | +0.6% | North America, Europe, East Asia | Medium term (2–4 years) |
Experiential outdoor travel demand
Consumer preference for road-based leisure, camping, national-park travel and self-contained accommodation is sustaining RV demand across motorized and towable categories. Digital reservation systems have lowered trip-planning friction: Recreation.gov offers reservations and trip-planning access across more than 3,600 outdoor recreation facilities, reinforcing the usability of campground-based travel.
In the United States, total RV shipments reached 342,220 units in 2025, up 2.5% from 2024, demonstrating continued underlying demand despite affordability and financing pressure. This travel preference changes manufacturer economics by raising demand for self-contained power, water, connectivity and storage features, enabling premium-option content worth an estimated 10–20% of vehicle transaction value. The resulting mix of leisure mobility and feature enrichment contributes an estimated +2.1% to the 8.8% baseline CAGR.
Market Restraints
| Restraint | (~) % Impact on CAGR Forecast | Geographic Relevance | Impact Timeline |
|---|---|---|---|
| High financing and purchase costs | -1.7% | North America, Europe, Australia | Short term (≤ 2 years) |
| Fuel-price operating cost exposure | -1.2% | Global motorized RV markets | Short term (≤ 2 years) |
| Campground capacity constraints | -0.9% | North America, Europe, Australia | Medium term (2–4 years) |
| Urban parking and storage barriers | -0.6% | Europe, East Asia, dense North American cities | Short term (≤ 2 years) |
| Seasonal dealer inventory pressure | -0.4% | North America, Europe | Short term (≤ 2 years) |
High financing and purchase costs
RVs are discretionary, high-ticket purchases often dependent on consumer credit, making retail demand highly sensitive to borrowing costs, monthly-payment affordability and used-vehicle valuations. The effect is strongest for motorhomes and premium fifth-wheel products, where a modest interest-rate increase can significantly raise the monthly payment and defer purchase decisions.
A financing-rate increase of approximately 200 basis points can raise monthly ownership cost by an estimated 10–15% for a typical multi-year loan, while elevated insurance, registration and maintenance expenses further reduce approval rates. Manufacturers and dealers respond with promotional financing, discounting and floorplan support, but these actions can reduce realized gross margins by roughly 150–300 basis points. This affordability hard stop delays orders and produces an estimated -1.7% deduction from the baseline CAGR.
Market Challenges
| Challenge | (~) % CAGR Friction Drag | Geographic Relevance | Mitigation Horizon |
|---|---|---|---|
| Skilled RV service technician shortages | -1.1% | North America, Europe, Australia | Long term (≥ 4 years) |
| Complex electrical system reliability | -0.9% | Global | Medium term (2–4 years) |
| Volatile chassis component sourcing | -0.7% | North America, Europe, Asia-Pacific | Medium term (2–4 years) |
| Water intrusion quality control | -0.5% | Global | Long term (≥ 4 years) |
| Seasonal production capacity balancing | -0.4% | North America, Europe | Medium term (2–4 years) |
Skilled RV service technician shortages
Modern RVs combine automotive chassis systems with residential-style plumbing, propane, appliances, solar equipment, lithium batteries, inverters, slide-out mechanisms and connected electronics, requiring technicians with cross-disciplinary diagnostic skills. The shortage of trained personnel extends repair cycle times, constrains dealer throughput and weakens customer confidence in increasingly complex vehicle configurations.
The impact is commercial rather than a direct sales freeze: service delays can extend from several days to multiple weeks during peak travel periods, while warranty labor, travel reimbursement and mobile-service support can raise manufacturer aftersales cost by an estimated 5–10%. The technical complexity is widely recognized as a growth constraint, alongside high maintenance costs associated with electrical and plumbing systems. Manufacturers must invest in technician academies, remote diagnostics, modular components and dealer training networks, creating an estimated -1.1% drag on maximum market growth.
Market Opportunities
| Opportunity | (~) % Potential CAGR Upside | Geographic Relevance | Execution Window |
|---|---|---|---|
| RV-as-a-service fleet platforms | +1.8% | North America, Europe, Australia, Asia-Pacific | Medium term (2–4 years) |
| Electric and hybrid RV ecosystems | +1.3% | Europe, North America, East Asia | Long term (≥ 4 years) |
| Predictive maintenance subscriptions | +1.0% | North America, Europe, Australia | Medium term (2–4 years) |
| Compact urban-friendly camper models | +0.8% | Europe, East Asia, Latin America | Medium term (2–4 years) |
| Off-grid energy management packages | +0.6% | North America, Europe, Australia | Medium term (2–4 years) |
RV-as-a-service fleet platforms
RV-as-a-service platforms remain an underexploited opportunity because most manufacturers still depend on one-time retail sales through dealer networks, while a sizable group of travel-oriented consumers prefers episodic access over ownership, storage, insurance and maintenance obligations. Integrated manufacturer-backed fleets can combine short-term rentals, subscriptions, insurance, trip planning, maintenance and certified resale, creating recurring revenue across the vehicle lifecycle.
A shared fleet can generate multiple revenue events from one asset each year, while centralized maintenance and dynamic pricing can increase utilization by an estimated 20–35% relative to fragmented private-rental activity. This shifts unit economics from volatile wholesale deliveries toward recurring service and data revenue, with potential gross-margin expansion of roughly 200–400 basis points once fleet utilization reaches scale. The model requires capital, residual-value controls and service coverage, but could add an estimated +1.8% above the 8.8% baseline CAGR.
Geopolitical Impact Analysis
Trade Barriers, Tariffs, and Logistics Disruptions Changing Cost Structure in the Global RV Market
As of 2026, the worldwide RV industry is functioning in a “new normal” in which the policy on international commerce and logistical constraints have emerged as major drivers of expense. The Avalara and Wiley Rein report that the situation changed drastically in February 2026 when Section 122 “Temporary Import Surcharge” came into effect and imposed a 10% global tariff on all goods to balance out international payment discrepancies. Although some auto parts had been excluded from the regulation, the impact of Section 232 metal tariffs, levying a 50% charge on the entire value of any product manufactured from steel and aluminum, has increased the minimum production cost of the chassis and other specific parts used in the manufacture of RVs. The financial burden has been further worsened by the 6.49%–35.99% interest rate.
Moreover, chokepoints have begun to alter supply chains beyond policy considerations. According to Marsh and ING Think, even though major shipping companies such as Maersk had resumed “cautiously” operating in the Red Sea from early 2026, shipping prices still hover more than 20% above historical averages owing to ongoing “war-risk” premiums, in addition to the challenges of routing shipments through the Cape of Good Hope. These changes significantly affect European countries, where “Section 301” investigation of excessive production by China has resulted in a 20% decline in exports to the US. This has made it imperative for the industry to move toward a more resilient approach of regionalization rather than global optimization.
Regional Analysis
Asia-Pacific Emerges as the Main Growth Driver for the Global Recreational Vehicle Market Because of Infrastructure Development, Positive Policies, and Electric Vehicle Adoption
The global recreational vehicle market is experiencing a significant regional realignment, with the Asia-Pacific region firmly established as the primary growth engine, commanding an impressive 53.2% market share. This leadership position is driven by robust government-backed infrastructure investments, rapidly expanding RV park networks, and progressive regulatory reforms across key markets including China, Japan, and Australia.
China’s introduction of the C6 recreational vehicle driving license category has been a landmark policy change, dramatically broadening the eligible driver base and stimulating both domestic manufacturing and consumer demand. Japan and Australia have similarly invested in roadside amenities and tourism incentives that position RV travel as an aspirational mainstream activity.
The area is ahead in terms of Electric and Hybrid RVs due to the existence of local battery supplies allowing to make the products cheap enough to attract eco-friendly Millennials. Moreover, the trend of remote work has made Class B models necessary to the growing middle class wishing to escape expensive urban life. Although the situation in North America and in Europe has come to a standstill due to the interest rates between 6.49% and 35.99%, the mixture of government and technological support in Asia-Pacific allows making it the leader and fast-growing sector of the market.
Key Regions
North America
- US
- Canada
Europe
- Germany
- France
- The UK
- Spain
- Italy
- Rest of Europe
Asia Pacific
- China
- Japan
- South Korea
- India
- Australia
- Rest of APAC
Latin America
- Brazil
- Mexico
- Rest of Latin America
Middle East & Africa
- South Africa
- Saudi Arabia
- UAE
- Rest of MEA
The international RV industry is highly concentrated with “The Big Three” – Thor Industries, Forest River, and Winnebago – accounting for about 80% of the total North American registration sales. Thor Industries leads the world in the RV industry, generating $2.13 billion in revenue in Q2 2026 and leading with a 41% share of travel trailers and above 50% in Class A and Class C motorhomes. As per RVDA and Global Market Insights, the big players are now sailing through a “cyclical reset,” where they are switching their focus from volume production to pricing and inventory management.
One notable trend for the 2026 year among these key players includes the push toward premium technology and lightweight variants. The diversified strategy of Winnebago Industries has been successful, as its Barletta line now holds a third-place spot within the marine industry. In addition, Grand Design continues to lead as a premier brand within towables, with 62.9% of the market share. However, at the same time, companies like Trigano SA and Swift Group have found success in the Rental Service segment with its 17.9% share, with innovations such as the 2026 Swift Trekker targeting digital nomads. Together, these trends will enable these key players to capitalize on the market’s predicted value of USD 143.9 billion by 2035.
Market Key Players
- ALINER (Columbia Northwest, Inc.)
- Dethleffs GmbH & Co. KG
- Forest River Inc.
- Gulf Stream Coach, Inc.
- Hymer GmbH & Co. KG
- Northwood Manufacturing
- REV Recreation Group
- Swift Group Limited
- Thor Industries Inc.
- Trigona SA
- Winnebago Industries Inc.
Recent Developments
- In January 2026, Thor Industries launched the world’s first range-extended electric Class A motorhome, the Entegra Coach Embark, to lead the market in sustainable eMobility solutions.
- In March 2026, Winnebago Industries reported a 6% revenue increase to $657.4 million, driven by strong performance in its Grand Design and Barletta brand segments.
- In May 2026, Hymer (Erwin Hymer Group) debuted the GT-S premium motorhome at CMT 2026, featuring a Mercedes-Benz chassis and advanced “Smart-Home” digital connectivity systems.
Report Scope
| Report Features | Description |
|---|---|
| Market Value (2025) | US$ 61.5 Bn |
| Forecast Revenue (2035) | US$ 143.9 Bn |
| CAGR (2026-2035) | 8.8% |
| Base Year for Estimation | 2025 |
| Historic Period | 2020-2024 |
| Forecast Period | 2026-2035 |
| Report Coverage | Revenue Forecast, Market Dynamics, Competitive Landscape, Recent Developments |
| Segments Covered | By Vehicle Type (Motorhomes, Towable RVs), By Propulsion Type (Motorized RVs, Non-Motorized RVs, Electric RVs, Hybrid RVs), By Application Type (Personal Use, Tourism & Camping, Commercial Use, Mobile Business / Food Trucks), By End-User (Individual Consumers, Rental Service Providers, Fleet Operators, Corporate Users), By Distribution Channel (Dealership Networks, Direct Sales, Rental & Leasing Providers, Online Sales) |
| Regional Analysis | North America – US, Canada; Europe – Germany, France, The UK, Spain, Italy, Rest of Europe; Asia Pacific – China, Japan, South Korea, India, Australia, Singapore, Rest of APAC; Latin America – Brazil, Mexico, Rest of Latin America; Middle East & Africa – South Africa, Saudi Arabia, UAE, Rest of MEA |
| Competitive Landscape | Thor Industries Inc., Forest River Inc., Winnebago Industries Inc., REV Recreation Group, Hymer GmbH & Co. KG, Gulf Stream Coach Inc., Dethleffs GmbH & Co. KG, Trigano SA, Swift Group Limited, and Northwood Manufacturing |
| Customization Scope | Customization for segments, region/country-level will be provided. Moreover, additional customization can be done based on the requirements. |
| Purchase Options | We have three licenses to opt for: Single User License, Multi-User License (Up to 5 Users), Corporate Use License (Unlimited Users and Printable PDF) |





































