


Report Overview
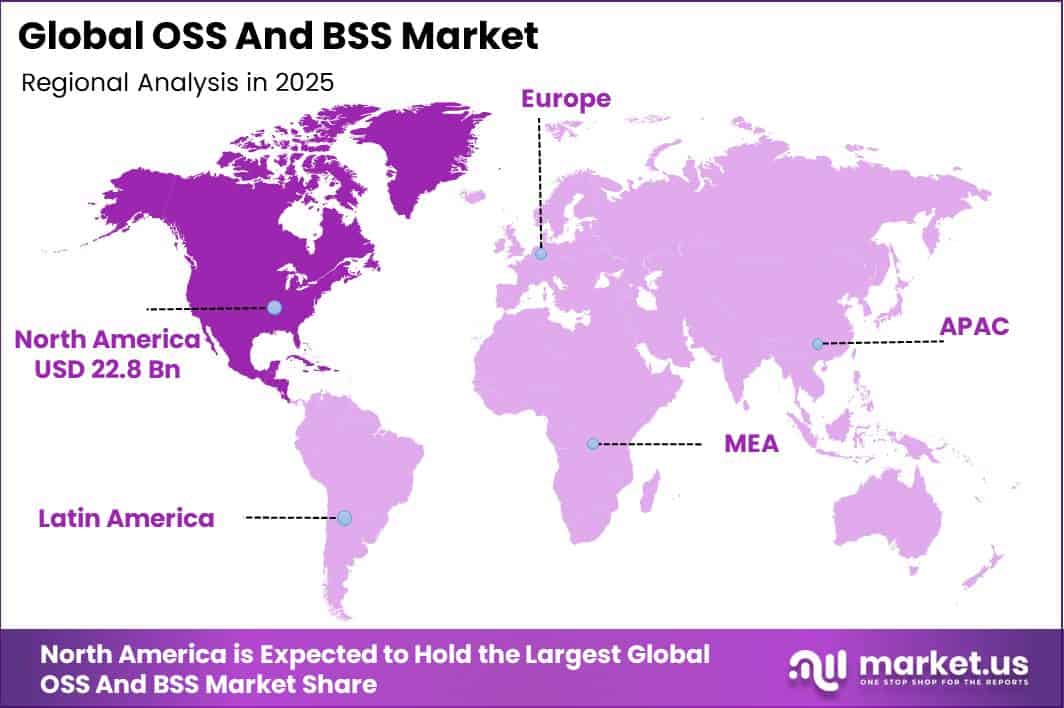
In 2025, the Global OSS And BSS Market was valued at USD 70.0 billion. The market is projected to grow at a CAGR of 11.9% during 2026–2035, reaching approximately USD 215.5 billion by 2035. North America dominated the global market in 2025, accounting for more than 32.6% of the total market share and generating approximately USD 22.8 billion in revenue.
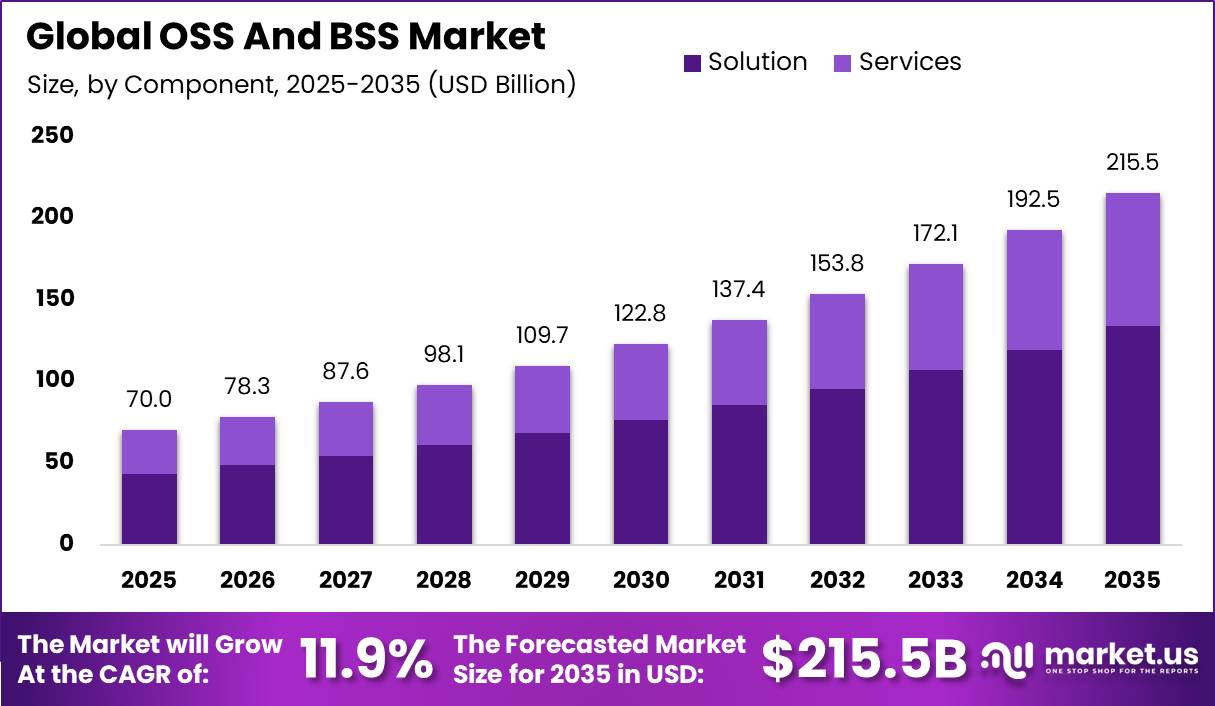
Market growth is strongly supported by the rapid expansion of telecom connections and digital services worldwide. According to the International Telecommunication Union (ITU), global mobile-cellular subscriptions reached 9.2 billion in 2025, equal to 112 subscriptions per 100 people. At the same time, global 5G subscriptions crossed approximately 3 billion, accounting for nearly one-third of all mobile broadband connections.
Internet users also increased to 6 billion, or 74% of the global population, compared with 5.8 billion in 2024. These rising connections create higher demand for automated billing, network monitoring, service activation, customer management, and revenue tracking, making OSS/BSS platforms essential for telecom operators.
The region benefits from advanced telecom infrastructure and early adoption of 5G and fiber networks. GSMA Intelligence reported that global 5G connections exceeded 2.7 billion by the end of 2025, while 5G technologies are expected to contribute nearly USD 1 trillion to the global economy by 2030. Growing adoption of IoT, enterprise 5G, network slicing, and cloud services is further increasing OSS/BSS requirements across North America.
Key Takeaway
- The OSS and BSS Market was valued at USD 70.0 billion in 2025 and is projected to reach USD 215.5 billion by 2035, growing at a CAGR of 11.9%.
- Global mobile-cellular subscriptions reached 9.2 billion in 2025, while 5G subscriptions crossed approximately 3 billion.
- The Solution segment held a leading 62.1% share of the market, driven by rising mobile data traffic and telecom infrastructure investment.
- The On-premises segment led deployment with a 58.2% share, supported by operators’ need for control over critical systems.
- Large Enterprises accounted for 66.7% of the market, driven by large-scale subscriber and network management needs.
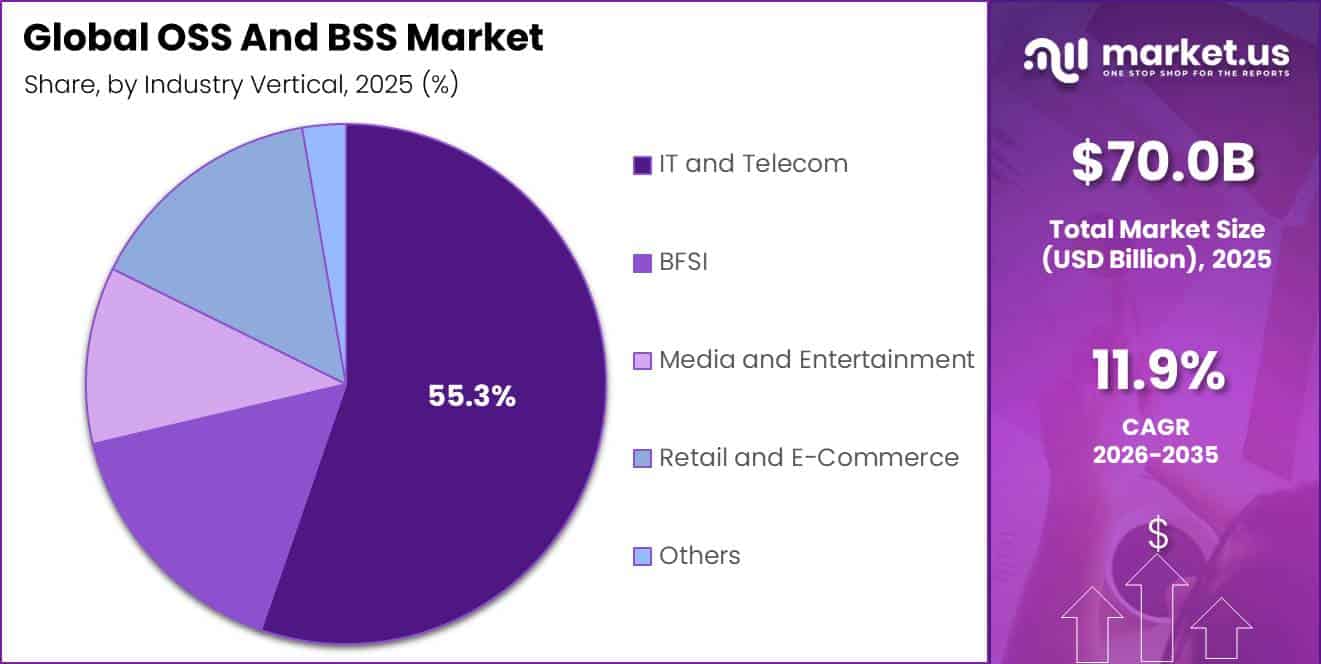
- The IT and Telecom vertical held a dominant 55.3% share, reflecting the central role of OSS/BSS in daily telecom operations.
- North America led the market in 2025 with a 32.6% share and approximately USD 22.8 billion in revenue.
Market Statistics and Data Insights
- Global subscriber scale is increasing OSS/BSS transaction volumes. ITU reported 9.2 billion mobile-cellular subscriptions in 2025, equal to 112 subscriptions per 100 people. Penetration reached 142 per 100 people in high-income economies, compared with 70 per 100 people in low-income economies, highlighting the scale of accounts, billing records, service activations, and network events operators must manage.
- Mobile usage is shifting rapidly toward data-based services. ITU recorded 99 mobile-broadband subscriptions per 100 people in 2025, with mobile broadband accounting for 89% of all mobile subscriptions, compared with less than 50% in 2015.
- 5G network complexity is expanding the requirement for orchestration and charging platforms. ITU reported that 5G covered more than 50% of the global population and accounted for 36% of mobile-broadband subscriptions in 2025. Ericsson subsequently reported 3.1 billion 5G subscriptions in Q1 2026, after 162 million were added during the quarter.
- Telecom reliability requirements are strengthening service-assurance demand. ENISA received reports of 188 major telecom incidents in 2024, up 20.5% from 156 incidents in 2023. System failures accounted for 113 incidents, or 60%, and produced around 548 million user-hours of disruption.
- Cybersecurity staffing and compliance requirements raise transformation costs. ENISA’s 2025 NIS Investments survey covered 1,080 professionals across critical EU sectors. Cybersecurity represented around 9% of total IT budgets, while cybersecurity employees accounted for only 10.6% of total IT FTEs. The median organization reported 6 cybersecurity FTEs, compared with 58 IT FTEs, demonstrating constrained specialist resources for secure OSS/BSS migration.
- Network APIs are creating a new BSS monetization layer. As of March 2026, GSMA Open Gateway included 86 operator groups, more than 300 mobile networks, and over 60 channel partners, covering approximately 80% of global mobile connections. By August 2026, the ecosystem had expanded to 77 channel and technology partners.
- Cellular IoT is creating large volumes of machine subscriptions requiring lifecycle and billing management. GSMA reported that active NB-IoT and LTE-M connections surpassed 1 billion by the end of 2025, with commercial LPWAN networks operating in more than 100 countries.
- Greenfield connectivity expansion represents a major OSS opportunity. ITU estimates that universal meaningful connectivity requires approximately 1.7 million kilometres of additional backbone infrastructure, an 18% increase in new fixed connections, and a 32% expansion in wireless networks, especially across underserved locations.
- Enterprise cloud adoption is widening BSS requirements beyond traditional mobile connectivity. Eurostat reported that 53% of EU businesses purchased cloud services in 2025, rising to 85% among large companies, versus 52% among SMEs.
- Among cloud users, 85% used cloud email, while 72% used office applications and 72% used cloud storage. This supports demand for bundled connectivity, cloud, security, and managed-service billing.
- Agentic AI is moving directly into carrier-grade OSS/BSS. Ericsson introduced more than 20 cloud-native AI and Gen-AI applications across OSS/BSS domains in 2025 and launched a Gen-AI Lab and Telco Agentic AI Studio. In 2026, Ericsson formalized 3 adjustable autonomous-network pathways, supported by a separate data foundation pathway.
- AI-driven automation is moving into mainstream enterprise operations. Eurostat found that 20.0% of EU enterprises used AI in 2025, up 6.5 percentage points from 13.5% in 2024. Adoption reached 55% among large enterprises, compared with 19% among SMEs, supporting broader acceptance of automated OSS/BSS workflows and zero-touch operations.
By Component
The Solution segment held a leading 62.1% share of the OSS/BSS market, supported by the rapid growth of mobile data traffic and continued telecom infrastructure investment. Global mobile operators invested more than USD 600 billion between 2022 and 2025, with around 85% of this spending directed toward 5G infrastructure.
Such large network investments increase the need for OSS/BSS software that can manage billing, service orders, network operations, customer data, and automated workflows. Global mobile data traffic reached approximately 190–210 exabytes per month by late 2025 and early 2026, creating a strong requirement for software solutions that can handle large data volumes, improve billing accuracy, detect fraud, and maintain service quality.
World Bank data also shows that global telecommunications network investment exceeded USD 344 billion in 2021 and has continued to increase, with East Asia-Pacific, Europe, and North America together representing nearly 90% of global telecom capital spending.
By Solution Type
The Network Planning and Design segment held a leading 27.3% share of the OSS/BSS market, supported by the continued expansion of telecom networks and the need for accurate network engineering before deployment. India’s Department of Telecommunications reported 31.44 lakh (3.14 million) Base Transceiver Stations and 8.43 lakh (843,000) mobile towers active as of October 2025.
Each site requires radio-frequency planning, capacity analysis, coverage mapping, and detailed design before becoming operational. Globally, telecom towers reached around 4.93 million sites in 2024, with the total growing at nearly 2% annually as operators expand and densify 5G networks. Spectrum expansion also increases demand for planning software.
For example, Turkey’s 2025 spectrum auction generated USD 2.9 billion across 400 MHz of spectrum, while new mmWave spectrum in the UK also requires operators to model coverage and integrate new frequencies into existing networks. ITU data further shows that only 29% of the global population lived within 10 kilometres of fiber-optic infrastructure as of 2021.
By Deployment Mode
The On-premises segment held a dominant 58.2% share of the OSS/BSS market, mainly because telecom operators require strong control over billing, subscriber information, network provisioning, and other mission-critical systems. The OECD reported that its member countries had around 1.9 billion mobile broadband subscriptions and 504 million fixed broadband subscriptions by June 2024.
Active machine-to-machine connections also exceeded 642 million in 2024, increasing the number of devices and service records that telecom platforms must continuously manage. This large operational base favors on-premises OSS/BSS systems, as operators can directly control infrastructure, integrate platforms with existing network equipment, customize workflows, and keep sensitive operational data within their own environments.
Security and service reliability further strengthen this preference. ENISA recorded 188 major telecom security incidents in 2024, including 113 incidents caused by system failures, representing 60% of reported incidents. These failures resulted in around 548 million user-hours of service impact.
By Enterprise Size
The Large Enterprises segment held a dominant 66.7% share of the OSS/BSS market, mainly because major telecom operators manage subscriber bases and network operations at a scale that requires advanced software platforms. In India, Reliance Jio serves around 498.47 million broadband subscribers, while Bharti Airtel serves approximately 307.07 million, creating a substantial need for automated billing, customer management, service provisioning, and network monitoring.
GSMA Intelligence tracks more than 1,250 mobile operators operating over 4,600 networks worldwide, although a large share of connections and revenues remains concentrated among major telecom groups. A similar pattern is visible in the United States, where AT&T and Verizon account for roughly 44.0% and 31.2% of postpaid wireless subscribers, respectively.
By Industry Vertical
The IT and Telecom segment held a dominant 55.3% share of the OSS/BSS market because these platforms are essential for managing daily telecom and digital-service operations. Telecom providers use OSS/BSS systems to plan networks, activate services, monitor performance, manage faults, process customer orders, and convert network usage into revenue.
According to the OECD, the ICT sector across member countries grew by 7.6% in 2023, nearly 3 times faster than the overall economy. The sector’s contribution to total value added also increased from 3.9% in 2010 to 5.4% by 2019, showing its expanding economic importance. In addition, around 49% of businesses in OECD economies used cloud computing in 2023, increasing demand for bundled connectivity, cloud services, cybersecurity, and managed solutions.
Key Market Segments
By Component
- Solution
- Services
By Solution Type
- Network Planning and Design
- Service Delivery
- Service Fulfillment
- Service Assurance
- Billing and Revenue Management
- Network Performance Management
- Customer and Product Management
- Others
By Deployment Mode
- On-premises
- Cloud-based
By Enterprise Size
- SMEs
- Large Enterprises
By Industry Vertical
- IT and Telecom
- BFSI
- Media and Entertainment
- Retail and E-Commerce
- Others
Geopolitical Impact Analysis
Rising US-China trade tensions are increasing cost pressure across the OSS/BSS ecosystem, as these platforms depend on servers, routers, data-center equipment, and other semiconductor-intensive hardware. Combined Section 301 tariff exposure on Chinese semiconductors reached roughly 70% as of August 2026, alongside a 12.5% forced-labor duty introduced in July 2026.
A further 7.5% overcapacity tariff was also pending ahead of the September 24 summit. In addition, a 15% tariff on polysilicon, an important semiconductor input, is scheduled to take effect in December 2026. These measures could increase the cost of hardware needed to operate and expand OSS/BSS infrastructure.
The WTO’s Global Trade Outlook released in March 2026 projects global merchandise trade volume growth to slow to 1.9% in 2026, compared with 4.6% in 2025, with growth potentially falling further to 1.4% if crude oil and LNG prices remain elevated.
Energy costs are adding another layer of pressure. According to the IEA, global data-center electricity consumption increased by more than 15% between 2024 and 2025, adding around 70 TWh and reaching approximately 490 TWh.
Meanwhile, North American merchandise import growth is projected at only 0.3% in 2026. Higher hardware, logistics, and electricity expenses are therefore encouraging telecom operators to increase domestic sourcing and adopt more cloud-native OSS/BSS platforms to reduce exposure to imported infrastructure costs.
Regional Analysis
North America and Asia Pacific show different growth patterns in the global OSS and BSS market. North America remained the leading region in 2025, accounting for 32.6% of the market and generating approximately USD 22.8 billion in revenue.
Its strong position is supported by mature 5G networks, extensive fiber infrastructure, and early adoption of cloud-native billing, service management, and network orchestration platforms. Large Tier-1 operators across the United States and Canada manage complex service portfolios covering enterprise 5G, IoT, network slicing, and digital services, creating strong demand for advanced OSS/BSS platforms.
Asia Pacific is emerging as the fastest-growing region, mainly due to rapid subscriber expansion in major telecom markets. India’s total telephone subscriber base exceeded 1.35 billion, with more than 6 million connections added during the month, while broadband subscriptions surpassed 1.09 billion. In China, the mobile subscriber base reached 1.8 billion by the end of 2025, representing a net increase of 37.2 million subscribers during the year.
Key Regions and Countries
- North America
- US
- Canada
- Europe
- Germany
- France
- The UK
- Spain
- Italy
- Rest of Europe
- Asia Pacific
- China
- Japan
- South Korea
- India
- Australia
- Rest of APAC
- Latin America
- Brazil
- Mexico
- Rest of Latin America
- Middle East & Africa
- GCC
- South Africa
- Rest of MEA
Market Dynamics
Drivers
| Driver | (~) % CAGR | Geographic Relevance | Impact Timeline |
|---|---|---|---|
| Cloud-native platform replacement | +2.6% | Global | Short term (2 years or less) |
| Autonomous network operations | +2.1% | North America, Europe, East Asia | Medium term (2 to 4 years) |
| Enterprise connectivity monetization | +1.7% | North America, Asia Pacific, Gulf states | Medium term (2 to 4 years) |
| Fiber access expansion | +1.3% | Asia Pacific, Europe, Latin America | Medium term (2 to 4 years) |
| AI-led service assurance | +1.1% | Global | Short term (2 years or less) |
Cloud-native platform replacement
Cloud-native replacement is a major growth driver as telecom operators move billing, charging, order management, mediation, and assurance from legacy systems to scalable software platforms. Global internet users reached 6.0 billion in 2025, increasing the volume of digital services that must be activated, monitored, rated, and billed in near real time.
Ericsson’s 2025 OSS/BSS portfolio combined Telco DataOps, intelligent IT, and charging capabilities to support greater automation, while Amdocs reported USD 6.4 billion in remaining performance obligations in fiscal 2025. With global economic growth projected at 2.5% in 2026, operators are under pressure to control costs through automation and cloud delivery. This transition could provide an estimated +2.6% growth contribution above the market’s 11.9% baseline CAGR.
Restraints
| Restraint | (~) % CAGR | Geographic Relevance | Impact Timeline |
|---|---|---|---|
| Operator capital spending pressure | -2.2% | Europe, Latin America, Africa | Short term (2 years or less) |
| Legacy migration funding gaps | -1.6% | Global | Medium term (2 to 4 years) |
| Currency and inflation pressure | -1.3% | Emerging markets | Short term (2 years or less) |
| Public-sector procurement limits | -0.9% | Europe, Asia Pacific, Africa | Medium term (2 to 4 years) |
| Vendor consolidation budgets | -0.7% | Global | Medium term (2 to 4 years) |
Operator capital spending pressure
Operator capital spending pressure remains a major near-term restraint because OSS/BSS modernization competes with radio, fiber, spectrum, core-network, energy, and data-center investments. The World Bank expects global GDP growth of 2.5% in 2026, down from 2.9% in 2025, while global inflation is projected at 4.5% in 2026.
Regional weakness adds further pressure, with growth expected at 2.1% in Europe and Central Asia and 2.2% in Latin America and the Caribbean during 2026. Operators must also continue funding basic network coverage and broadband expansion, often delaying large software upgrades.
This can extend contract approvals and encourage phased OSS/BSS deployments, creating an estimated -2.2% drag against the market’s 11.9% baseline CAGR, especially among financially constrained telecom operators.
Challenges
| Challenge | (~) % CAGR | Geographic Relevance | Mitigation Horizon |
|---|---|---|---|
| Legacy data integration | -1.9% | Global | Long term (4 years or more) |
| Cybersecurity compliance complexity | -1.5% | Europe, North America, Asia Pacific | Medium term (2 to 4 years) |
| Telecom skills shortage | -1.2% | Global | Long term (4 years or more) |
| Multi-cloud interoperability | -1.0% | North America, Europe, Asia Pacific | Medium term (2 to 4 years) |
| Real-time data governance | -0.8% | Global | Medium term (2 to 4 years) |
Legacy data integration
Legacy data integration remains a major structural challenge because established telecom operators often manage separate customer, billing, inventory, fulfillment, and network databases built over many years. Ericsson’s 2025 OSS/BSS modernization work highlighted data operations, intelligent IT, and charging integration, showing that unified data remains essential for automation.
Regulatory and cost pressures make migration more difficult. The European Commission’s NIS2 framework covers 18 critical sectors, increasing security, testing, and reporting requirements during system upgrades.
The World Bank also projects inflation of 4.5% in 2026, which can raise specialist integration and dual-platform operating costs. These barriers may create an estimated -1.9% friction drag on potential market growth until operators standardize data models, interfaces, and governance systems.
Opportunities
| Opportunity | (~) % CAGR | Geographic Relevance | Execution Window |
|---|---|---|---|
| Network API monetization | +2.4% | North America, Europe, Asia Pacific | Medium term (2 to 4 years) |
| Industry-specific private networks | +1.9% | Manufacturing hubs and Gulf states | Medium term (2 to 4 years) |
| Digital wholesale marketplaces | +1.5% | Europe, Africa, Latin America | Medium term (2 to 4 years) |
| Satellite-terrestrial service orchestration | +1.2% | Remote and rural markets | Long term (4 years or more) |
| Embedded connectivity billing | +1.0% | Global | Short term (2 years or less) |
Network API monetization
Network API monetization represents a major untapped opportunity, as many telecom operators still rely on fixed monthly connectivity fees instead of charging enterprises for services such as identity verification, fraud prevention, device location, authentication, and quality-on-demand.
GSMA’s Open Gateway initiative had attracted more than 40 mobile-operator groups by 2025, while the global online population reached 6.0 billion in 2025, according to ITU. The opportunity remains underdeveloped because operators still need API catalogs, partner agreements, consent systems, real-time rating, and automated settlement tools.
The World Bank expects South Asia to grow by 6.3% in 2026, supporting enterprise digitization and API demand. Automated usage-based charging could reduce manual partner-settlement costs by an estimated 20% to 30% and potentially add around +2.4% above the baseline CAGR.
Key Players Analysis
Amdocs, Nokia, and Oracle lead the OSS/BSS competitive landscape, supported by their large telecom customer bases, broad software portfolios, and ability to integrate complex network and billing systems. Amdocs generated USD 2.98 billion in North American revenue in FY2025, along with USD 705 million from Europe and USD 844 million from other regions.
Its 12-month backlog reached USD 4.19 billion, while remaining performance obligations stood at USD 6.4 billion, showing strong demand for long-term telecom software contracts. Nokia also maintains a strong position, with its Cloud and Network Services business generating EUR 2.6 billion in FY2025 revenue and EUR 338 million in operating profit, while Network Infrastructure contributed EUR 7.9 billion.
Tier-2 competitors include Cisco Systems, HPE, Infosys, Comarch, and Netcracker. HPE’s Networking and Cloud & AI businesses generated more than USD 8.6 billion in combined FY2025 revenue, while Americas revenue reached USD 15.8 billion.
Infosys competes through telecom integration and managed services, while Comarch and Netcracker maintain strong regional software positions. Competition is increasingly shifting toward cloud-native and AI-enabled billing, automation, and network orchestration as operators modernize legacy OSS/BSS platforms and reduce operating costs.
Top Key Players in the Market
- Amdocs
- Cisco Systems Inc.
- Comarch SA
- Hewlett Packard Enterprise Development LP
- Huawei Technologies Co. Ltd.
- Infosys Limited
- Netcracker Technology Corporation (NEC Corporation)
- Nokia Corporation
- Oracle Corporation
- Suntech S.A.
- Telefonaktiebolaget LM Ericsson
Recent Developments
- In December 2025, Amdocs completed its acquisition of MATRIXX Software for approximately USD 197 million in cash on December 23, 2025. Amdocs later disclosed that the transaction was financed partly through a USD 130 million draw on its USD 500 million revolving credit facility, underscoring the acquisition’s strategic importance.
- In May 2026, NEC / Netcracker completed the acquisition of CSG Systems International for an enterprise value of approximately USD 2.9 billion (JPY 438.5 billion), based on USD 80.70 per share in cash. The price represented a 17.38% premium to CSG’s prior closing price of USD 68.75 and a 23.07% premium to its 30-day VWAP.
Report Scope
| Report Features | Description |
|---|---|
| Market Value (2025) | USD 70.0 Billion |
| Forecast Revenue (2035) | USD 215.5 Billion |
| CAGR (2026-2035) | 11.9% |
| Base Year for Estimation | 2025 |
| Historic Period | 2020-2024 |
| Forecast Period | 2026-2035 |
| Report Coverage | Revenue Forecast, Market Dynamics, Competitive Landscape, Recent Developments |
| Segments Covered | By Component (Solution, Services); By Solution Type (Network Planning and Design, Service Delivery, Service Fulfillment, Service Assurance, Billing and Revenue Management, Network Performance Management, Customer and Product Management, Others); By Deployment Mode (On-premises, Cloud-based); By Enterprise Size (SMEs, Large Enterprises); By Industry Vertical (IT and Telecom, BFSI, Media and Entertainment, Retail and E-Commerce, Others) |
| Regional Analysis | North America – US, Canada; Europe – Germany, France, The UK, Spain, Italy, Rest of Europe; Asia Pacific – China, Japan, South Korea, India, Australia, Singapore, Rest of APAC; Latin America – Brazil, Mexico, Rest of Latin America; Middle East & Africa – GCC, South Africa, Rest of MEA |
| Competitive Landscape | Amdocs, Cisco Systems Inc., Comarch SA, Hewlett Packard Enterprise Development LP, Huawei Technologies Co. Ltd., Infosys Limited, Netcracker Technology Corporation (NEC Corporation), Nokia Corporation, Oracle Corporation, Suntech S.A., Telefonaktiebolaget LM Ericsson |
| Customization Scope | Customization for segments, region/country-level will be provided. Additional customization can be done based on requirements. |
| Purchase Options | We have three licenses to opt for: Single User License, Multi-User License (Up to 5 Users), Corporate Use License (Unlimited Users and Printable PDF) |





























