


Report Overview
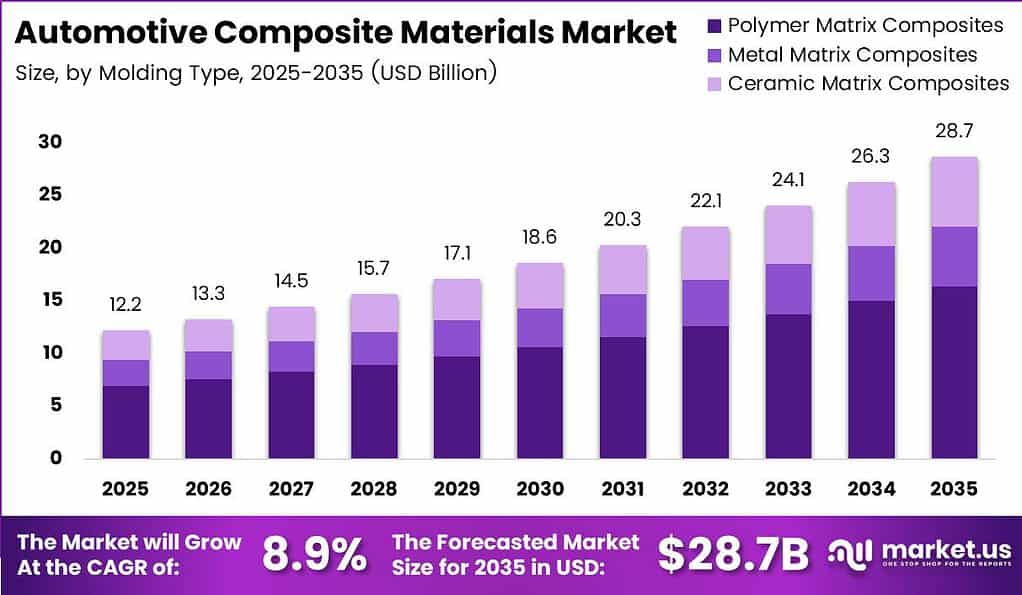
Global Automotive Composite Materials Market size is expected to be worth around USD 28.7 Billion by 2035 from USD 12.2 Billion in 2025, growing at a CAGR of 8.9% during the forecast period 2026 to 2035.
The automotive composite materials market covers fiber-reinforced polymers, metal matrix composites, and ceramic matrix composites integrated into vehicle body, structural, and powertrain systems. Manufacturers adopt these materials primarily to reduce mass, resist corrosion, and meet fleet-emission targets. The market spans passenger cars and commercial vehicles across exterior components, interior systems, and structural applications.
Key Takeaways
- The global Automotive Composite Materials Market is valued at USD 12.2 Billion in 2025 and is forecast to reach USD 28.7 Billion by 2035.
- The market expands at a CAGR of 8.9% over the forecast period 2026 to 2035.
- Polymer Matrix Composites dominates the By Molding Type segment with a 58.34% share in 2025.
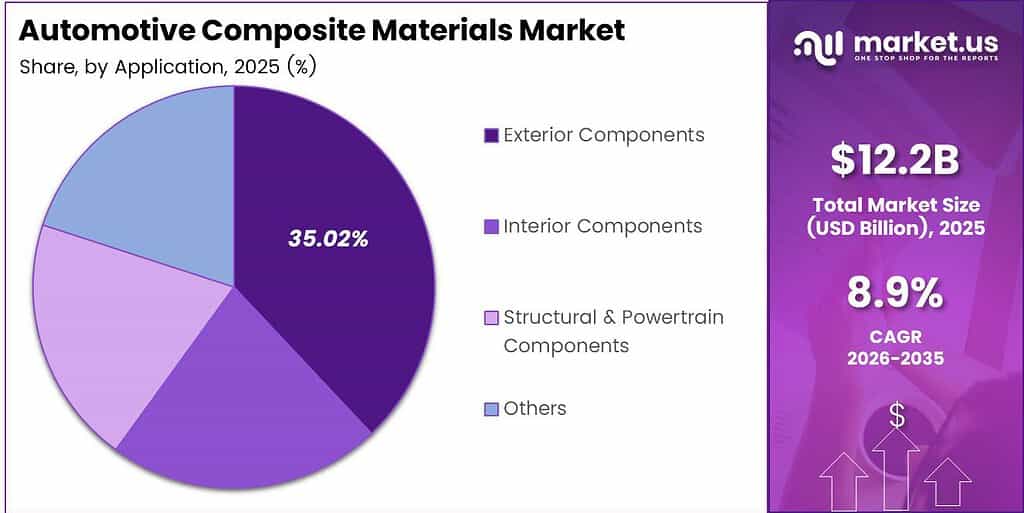
- Exterior Components leads the By Application segment with a 35.02% share in 2025.
- Passenger Cars holds a 60.00% share in the By Vehicle segment and is the fastest-growing sub-segment.
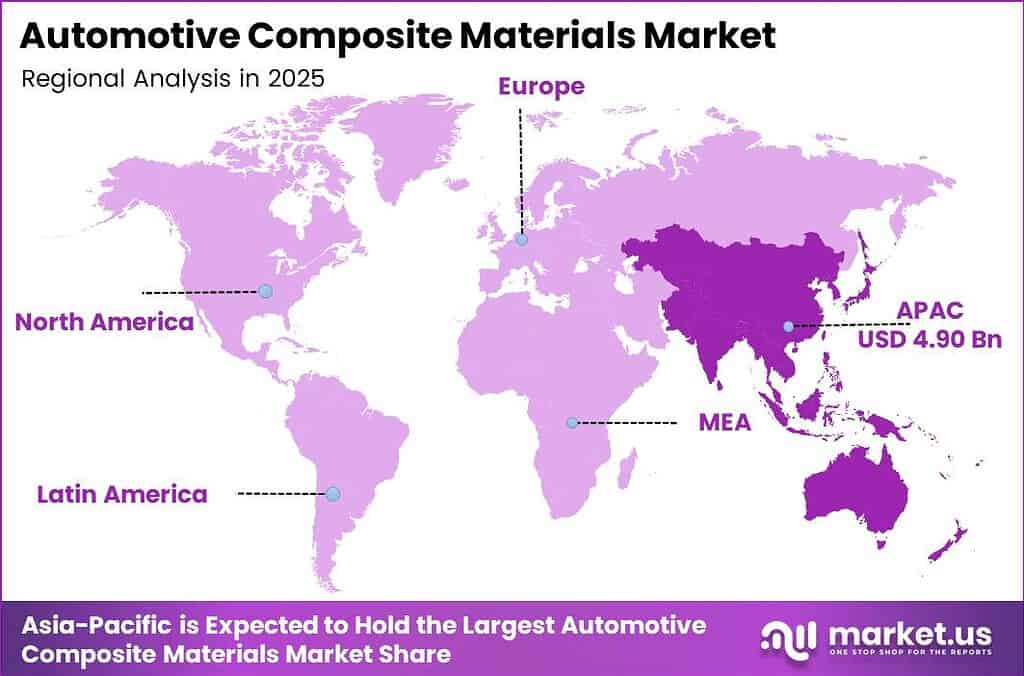
- Asia-Pacific leads all regions with a 40.21% market share, valued at USD 4.90 Billion in 2025.
- Middle East & Africa is the fastest-growing region in the global Automotive Composite Materials Market.
Government mandates are reshaping material selection across global vehicle programs. The European Union’s fleet CO2 targets and US Corporate Average Fuel Economy standards compel OEMs to reduce vehicle mass by measurable percentages per model cycle. Composite adoption is no longer discretionary in these corridors. This regulatory pressure translates directly into multi-year supply contracts for qualified composite systems.
According to the American Composites Manufacturers Association, the global light-vehicle composite-materials market reached nearly 4.4 billion pounds in 2023. As reported by AVK, the global composites market totaled 13.5 million tonnes in 2024. These volumes confirm that automotive composite demand has crossed the threshold from specialty to industrial-scale procurement, which compresses per-unit costs and widens addressable vehicle segments.
Supply chain disruption remains a structural risk for composite material flows. Data from UNCTAD shows Suez Canal transits declined 42% from peak during the Red Sea disruption, and Shanghai-to-Europe container spot-freight rates increased 256%. Consequently, Denso proposed acquiring Rohm in a transaction potentially valued at $8.2 billion in March 2026, signaling that Tier 1 suppliers are pursuing vertical integration to reduce input cost volatility across electrified vehicle programs.
Type Analysis
Polymer Matrix Composites dominates with 58.34% due to cost efficiency and broad vehicle platform adoption.
In 2025, Polymer Matrix Composites held a dominant market position in the By Molding Type segment of the Automotive Composite Materials Market, with a 58.34% share. AVK data indicates that more than 60% of European thermoplastic composites are used in transportation, confirming the structural alignment between this sub-segment and the automotive sector. This concentration gives polymer composite suppliers predictable volume from a single end-use channel, reducing customer acquisition costs and supporting long-run press utilization.
Metal Matrix Composites address thermal management and structural stiffness in high-performance and electrified powertrain applications. Their higher density relative to polymer alternatives limits adoption in mass-market body and closure programs where weight savings drive purchasing decisions. As a result, Metal Matrix Composite demand concentrates in specialized drivetrain and braking components where strength-to-weight ratios at elevated temperatures outweigh cost considerations.
Ceramic Matrix Composites serve the most demanding thermal and wear environments within the vehicle, including brake discs and exhaust components in premium and motorsport platforms. Their production complexity and high per-unit cost restrict volume penetration in mainstream vehicle programs. As EV-specific thermal management requirements intensify, Ceramic Matrix Composites may capture incremental share in battery system protective components.
Application Analysis
Exterior Components dominates with 35.02% due to corrosion resistance and mass reduction requirements.
In 2025, Exterior Components held a dominant market position in the By Application segment of the Automotive Composite Materials Market, with a 35.02% share. Magna’s recyclable thermoplastic composite liftgate demonstrated up to 25% mass savings over steel equivalents, quantifying the weight advantage that drives OEM sourcing decisions for closures and body panels. This performance proof point accelerates procurement conversations for composite exterior systems across multiple vehicle architectures.
Interior Components serve NVH reduction, aesthetic finish, and passenger safety functions within vehicle cabins. Composite materials replace heavier steel and aluminum stampings in door cards, instrument panels, and load floors, contributing to cumulative vehicle weight savings across multiple components. This incremental approach allows OEMs to achieve fleet-average emission compliance without complete platform redesign.
Structural and Powertrain Components is the fastest-growing application segment, reflecting OEM interest in integrating composite materials into load-bearing chassis and drivetrain systems. Supply chain disruption has elevated the cost of precision metal components, making composite structural modules a competitive alternative for floor pans, B-pillars, and suspension crossmembers. Syensqo and Bell industrialized a process forming a complex composite component in under 5 minutes in November 2025, directly addressing the cycle-time barrier that has historically limited structural composite adoption.
Vehicle Analysis
Passenger Cars dominates with 60.00% due to volume scale and electrification-led weight reduction mandates.
In 2025, Passenger Cars held a dominant market position in the By Vehicle segment of the Automotive Composite Materials Market, with a 60.00% share. According to ACEA, global passenger-car production totaled 75.5 million units in 2024, establishing the production base against which composite penetration rates are measured. IEA figures show global electric-car sales grew 20% to exceed 20 million units in 2025, representing one-quarter of new-car sales. This electrification rate directly increases per-vehicle composite content requirements as battery mass offsets demand structural lightweighting.
Commercial Vehicles represent a structurally distinct demand channel, prioritizing payload capacity, durability, and total cost of ownership over vehicle mass reduction. Composite adoption in this segment concentrates in cab panels, flatbed floors, and aerodynamic fairings where the weight-to-payload benefit directly translates into legal load allowance gains. Fleet operators in regulated freight corridors treat composite content as a productivity investment rather than a performance attribute.
Key Market Segments
By Molding Type
- Polymer Matrix Composites
- Metal Matrix Composites
- Ceramic Matrix Composites
By Application
- Exterior Components
- Interior Components
- Structural & Powertrain Components
- Others
By Vehicle
- Passenger Cars
- Commercial Vehicles
Regional Analysis
Asia-Pacific Dominates the Automotive Composite Materials Market with a Market Share of 40.21%, Valued at USD 4.90 Billion
Asia-Pacific commands 40.21% of the global Automotive Composite Materials Market, valued at USD 4.90 Billion in 2025. OICA data shows Asia-Oceania produced 59,210,250 motor vehicles in 2025, an 8% increase from 2024. This output scale creates a direct and proportional demand channel for composite materials across body, structural, and powertrain applications sourced by regional OEMs and their Tier 1 supply chains.
Middle East & Africa is the fastest-growing region in this market, reflecting expanding light vehicle assembly capacity and infrastructure investment across Gulf Cooperation Council markets. Mitsubishi Motors announced a $470 million investment in Thailand through 2030 for electrified Pajero SUVs and pickup trucks in February 2026, signaling OEM commitment to composite-intensive vehicle platforms in adjacent high-growth corridors.
Latin America is also registering measurable investment activity. Renault and Geely expanded their Brazilian partnership in March 2026, bringing announced investment since 2025 to €899 million. As per our research, Morocco produced 35,178 light commercial vehicles in 2024, illustrating that North African manufacturing capacity is building a regional composite materials demand base that will scale alongside vehicle output growth.
Key Regions and Countries
North America
- US
- Canada
Europe
- Germany
- France
- The UK
- Spain
- Italy
- Rest of Europe
Asia Pacific
- China
- Japan
- South Korea
- India
- Australia
- Rest of APAC
Latin America
- Brazil
- Mexico
- Rest of Latin America
Middle East and Africa
- GCC
- South Africa
- Rest of MEA
Market Dynamics
Market Opportunity Analysis - Passenger cars, MEA assembly growth, and underutilized commercial vehicle programs offer entry points for composite material suppliers
Passenger cars represent the largest single demand channel but remain partially underexploited in composite penetration terms. At a 60.00% vehicle segment share, composite content per vehicle still lags structural application potential in mid-market platforms. Suppliers who can demonstrate cost-parity with stamped steel in closures and floor structures will capture disproportionate share in the next OEM model cycle, particularly in high-volume programs above 100,000 units per year.
The Middle East & Africa region is the fastest-growing market but holds the smallest current revenue base, creating a structural first-mover window. Local vehicle assembly expansion across GCC markets increases regional demand for composite body and exterior systems before global suppliers establish distribution infrastructure. This positions regional distributors and in-country processors as critical intermediaries for the next 4 to 6 years.
Commercial Vehicles carry a structurally different composite value proposition than passenger cars. Payload capacity gains from composite flatbed floors and aerodynamic fairings translate into measurable fleet economics per route, making composite adoption a cost recovery rather than a regulatory compliance decision. This framing unlocks fleet operator procurement budgets that are insulated from OEM model-cycle timing and consumer demand volatility.
Exterior Components holds the dominant application share at 35.02% but remains concentrated in premium and semi-premium vehicle programs. Mid-market exterior composite adoption is constrained by tooling cost relative to stamped steel at equivalent volumes. Suppliers who develop low-investment tooling pathways for exterior systems, such as thermoplastic overmolding at existing press capacity, will open a volume tier currently inaccessible to the composite supply chain.
Technology and Innovation Landscape - Process speed, recycled-fiber chemistry, and multi-material joining define the next competitive frontier for composite suppliers
Cycle time compression is the single most consequential technology variable in this market. Syensqo and Bell industrialized a forming process capable of producing a complex composite component in under 5 minutes in November 2025. This breakthrough directly reduces the press count required to meet automotive production targets, improving capital efficiency for composite part manufacturers operating at volumes above 50,000 units per year.
Recyclable thermoplastic composite systems are redefining end-of-life material economics. Magna’s liftgate program achieved up to 25% mass savings over steel while maintaining recyclability, combining lightweighting and regulatory compliance in a single material decision. Suppliers who qualify thermoplastic systems with OEM recycled-content procurement teams by 2027 will hold an approved-supplier advantage when European recycled-content mandates activate from 2032.
Precursor supply concentration remains the dominant technology risk in the carbon-fiber value chain. IEA data shows China controlled refining for 19 of 20 analyzed strategic minerals at an average 70% market share. Composite material producers outside China face structural exposure in polyacrylonitrile precursor availability, which drives R&D investment in alternative fiber precursors, biosourced reinforcements, and natural-fiber hybrid systems as substitution pathways.
Additive manufacturing is entering composite tooling as a cost-reduction technology for low-to-medium volume programs. Printed tooling reduces lead times from weeks to days and lowers per-tool capital commitment for platforms producing fewer than 50,000 units annually. This technology makes composite adoption economically viable for commercial vehicle body programs and specialty vehicle platforms that stamped-steel tooling economics have historically excluded.
Drivers
Battery-electric platforms intensify the mass-versus-range trade-off directly. A 10% reduction in vehicle weight can improve efficiency by 6% to 8%, while carbon-fiber composites can reduce component mass by approximately 50% to 70% relative to conventional materials. Global electric-car sales exceeded 17 million units in 2024 and grew by more than 25%. This volume scale shifts composite suppliers from premium build-to-print components toward platform co-design and multi-year module contracts, adding an estimated +1.5% to the baseline CAGR.
Applying only 5 to 10 kg of incremental composite content to the 2024 electric-car sales base would represent approximately 85,000 to 170,000 tonnes of annual material throughput. China produced 16.626 million new-energy vehicles in 2025, up 29%, and sold 16.49 million, up 28.2%. This two-year expansion improves plant utilization and reduces tooling amortization per component for composite suppliers with localized molding operations in the region.
| Driver | (~) % Impact on CAGR Forecast | Geographic Relevance | Impact Timeline |
|---|---|---|---|
| Electrification-Driven Lightweighting | +1.5% | Global; strongest in China, Europe and North America | Short term (≤ 2 years) |
| Fleet-Emission Compliance Pressure | +1.0% | Europe and North America | Short term (≤ 2 years) |
| Asian Vehicle Output Scaling | +0.8% | China, India and Southeast Asia | Short term (≤ 2 years) |
| Corrosion-Resistant Exterior Systems | +0.6% | Global; coastal and cold-weather markets | Medium term (2–4 years) |
| Commercial Payload Efficiency | +0.4% | North America, Europe and Asia-Pacific | Medium term (2–4 years) |
| Interior Function Integration | +0.3% | Europe, Japan and North America | Medium term (2–4 years) |
Restraints
Carbon-fiber economics remain an immediate purchasing barrier across mass-market vehicle programs. Many finished carbon-fiber composite systems cost more than US$50 per lb, while the automotive development benchmark for commodity-grade carbon fiber targets approximately US$5 to US$7 per lb. A vehicle-door development program targeted less than US$5 of added cost per pound of weight removed. This cost gap prevents many body, chassis, and closure applications from clearing current program-level return thresholds, producing an estimated -1.2% drag against the baseline CAGR.
Scalable and economically viable recycling remains extremely limited for carbon-fiber composite systems. Suppliers must absorb tooling, scrap, and qualification costs or concede pricing to metals, compressing margins and delaying capacity investment. Volume commitments or material-cost reductions must materially improve payback periods before composite adoption scales into mid-market body programs.
| Restraint | (~) % Impact on CAGR Forecast | Geographic Relevance | Impact Timeline |
|---|---|---|---|
| Carbon-Fiber Cost Premium | -1.2% | Global; strongest in mass-market vehicle programs | Short term (≤ 2 years) |
| Weak European Production | -0.6% | Europe | Short term (≤ 2 years) |
| Electrified-Vehicle Trade Barriers | -0.4% | Europe-China and United States-China trade corridors | Short term (≤ 2 years) |
| High Tooling Commitment | -0.35% | Global; low- and medium-volume platforms | Medium term (2–4 years) |
| Vehicle Affordability Pressure | -0.25% | Global mass-market segments | Short term (≤ 2 years) |
| European Energy-Cost Exposure | -0.2% | Europe | Medium term (2–4 years) |
Challenges
Mass-production cycle times impose the most immediate operational constraint on composite adoption at automotive scale. Conventional composite processes can require approximately 60 minutes per component, whereas high-volume automotive economics target about 2.5 minutes per cycle to support roughly 100,000 vehicles annually under a two-shift model. Reclaimed-fiber preform technology has demonstrated cycle times of 2 minutes or less, but transferring laboratory throughput into stable production still requires automated material handling and rapid-cure chemistry.
Closing the cycle-time gap requires multi-year investment in compression molding, high-pressure resin processing, robotic preforming, and non-destructive quality control. One tool operating at automotive takt can theoretically deliver approximately 24 cycles per hour rather than 1. Until these systems achieve repeatable takt time and low scrap rates, the production bottleneck imposes an estimated -0.7% friction drag on achievable CAGR for the broader market.
| Challenge | (~) % CAGR Friction Drag | Geographic Relevance | Mitigation Horizon |
|---|---|---|---|
| Mass-Production Cycle Times | -0.7% | Global | Medium term (2–4 years) |
| Multi-Material Joining Durability | -0.5% | Global | Medium term (2–4 years) |
| Precursor Supply Concentration | -0.4% | Asia, Europe and North America | Long term (≥ 4 years) |
| Automated Defect Detection | -0.35% | Global high-volume manufacturing hubs | Medium term (2–4 years) |
| Composite Engineering Skills Gap | -0.25% | Europe, North America and Japan | Long term (≥ 4 years) |
| Model-Correlation Uncertainty | -0.2% | Global | Long term (≥ 4 years) |
Opportunities
Recycled-fiber closed loops represent a near-term cost reduction pathway that the industry has not yet fully operationalized. A chemical recovery route has projected recycled carbon fiber at approximately US$1.50 per kg, with recovered epoxy building blocks offsetting nearly all modeled process-energy consumption. This creates white space for take-back contracts and material-as-a-service models before European regulation mandates recycled content from 2032.
The European end-of-life vehicle framework begins applying on 1 September 2028, followed by recycled-plastic requirements of 15% from 2032 and 25% from 2036. If qualified recovered fiber replaces approximately 20% to 30% of virgin reinforcement in non-critical components, modeled blend-cost reductions of 10% to 20% could support gross-margin expansion of roughly 2 to 4 percentage points. This positions early-mover recycled-fiber suppliers to capture regulatory-driven contracts worth up to +0.9% potential CAGR upside above the 8.9% baseline.
| Opportunity | (~) % Potential CAGR Upside | Geographic Relevance | Execution Window |
|---|---|---|---|
| Recycled-Fiber Closed Loops | +0.9% | Europe, North America and Japan | Medium term (2–4 years) |
| Fire-Safe Battery Enclosures | +0.8% | China, Europe and North America | Medium term (2–4 years) |
| Natural-Fiber Interior Systems | +0.6% | Europe and Asia-Pacific | Medium term (2–4 years) |
| Structural Battery Integration | +0.45% | North America, Europe and China | Long term (≥ 4 years) |
| Additive Composite Tooling | +0.35% | Global | Medium term (2–4 years) |
| Hydrogen Storage Mobility | +0.3% | China, Europe, Japan and North America | Long term (≥ 4 years) |
Key Company Insights
Solvay recorded €4.686 billion in underlying net sales in 2024, confirming its position as the largest specialty composite materials supplier by revenue in this market. This scale gives Solvay pricing authority in long-cycle OEM qualification programs. IEA data shows China dominated refining for 19 of 20 analyzed strategic minerals at an average 70% market share, exposing non-integrated suppliers like Solvay to precursor concentration risk.
Toray Industries generated ¥300.0 billion in Carbon Fiber Composite Materials segment revenue and ¥22.5 billion in core operating income in FY2024. Toray commissioned a $15 million upgrade that doubled TORAYCA T1100 carbon-fiber production capacity in January 2024, directly addressing volume constraints in high-modulus fiber supply. Hexcel and NIAR established a $10 million application-center partnership in June 2025, signaling that Toray’s mid-tier competitors are accelerating process development to close the qualification gap. Syensqo renewed its Ewha Womans University partnership after more than €2.8 million funded 13 research projects, demonstrating that R&D investment across the competitive set remains active.
Key Players
- Solvay
- Toray Industries, Inc.
- SGL Carbon
- Teijin Limited
- Hexcel Corporation
- Mitsubishi Chemical Carbon Fiber and Composites, Inc.
- Johns Manville
- Gurit
- Plasan Carbon Composites
- TPI Composites
- GMS Composites
- IDI Composites International
- Other Key Players
Recent Developments
- 29 June 2026 – Syensqo and Bucci Composites signed a DDF technology license partnership involving Bucci’s 24,000 m², two-plant facility, targeting high-volume automotive composites manufacturing.
- 11 August 2025 – TPI Composites secured an agreement for up to $82.5 million in debtor-in-possession financing and approximately $50 million in cash-collateral use as part of voluntary Chapter 11 proceedings to facilitate restructuring.
- 14 October 2025 – Stellantis announced a $13 billion four-year US investment program expected to add more than 5,000 jobs across its North American manufacturing operations.
- 6 November 2025 – SGL Carbon reported €38.2 million in capital expenditure for the first nine months of 2025, reflecting continued investment in Composite Solutions capacity.
- 28 January 2024 – Toray commissioned a $15 million upgrade that doubled TORAYCA T1100 carbon-fiber production capacity at its Decatur, Alabama facility.
- 5 November 2025 – Syensqo agreed to divest its Oil & Gas business for an enterprise value of €135 million, approximately 7 times EV/EBITDA, sharpening focus on automotive and aerospace composite materials.
- 27 February 2025 – Syensqo announced planned 2025 capital expenditure of approximately €600 million, underscoring commitment to composite materials manufacturing capacity expansion.
Report Scope
| Report Features | Description |
|---|---|
| Market Value (2025) | USD 12.2 Billion |
| Forecast Revenue (2035) | USD 28.7 Billion |
| CAGR (2026-2035) | 8.9% |
| Base Year for Estimation | 2025 |
| Historic Period | 2020-2024 |
| Forecast Period | 2026-2035 |
| Report Coverage | Revenue Forecast, Market Dynamics, Market Opportunity Analysis, Technology and Innovation Landscape, Competitive Landscape, Recent Developments |
| Segments Covered | By Molding Type (Polymer Matrix Composites, Metal Matrix Composites, Ceramic Matrix Composites), By Application (Exterior Components, Interior Components, Structural & Powertrain Components, Others), By Vehicle (Passenger Cars, Commercial Vehicles) |
| Regional Analysis | North America (US and Canada), Europe (Germany, France, The UK, Spain, Italy, and Rest of Europe), Asia Pacific (China, Japan, South Korea, India, Australia, and Rest of APAC), Latin America (Brazil, Mexico, and Rest of Latin America), Middle East and Africa (GCC, South Africa, and Rest of MEA) |
| Competitive Landscape | Solvay, Toray Industries, Inc., SGL Carbon, Teijin Limited, Hexcel Corporation, Mitsubishi Chemical Carbon Fiber and Composites, Inc., Johns Manville, Gurit, Plasan Carbon Composites, TPI Composites, GMS Composites, IDI Composites International, Other Key Players |
| Customization Scope | Customization for segments, region/country-level will be provided. Additional customization can be done based on requirements. |
| Purchase Options | We have three licenses to opt for: Single User License, Multi-User License (Up to 5 Users), Corporate Use License (Unlimited User and Printable PDF) |





































