


Report Overview
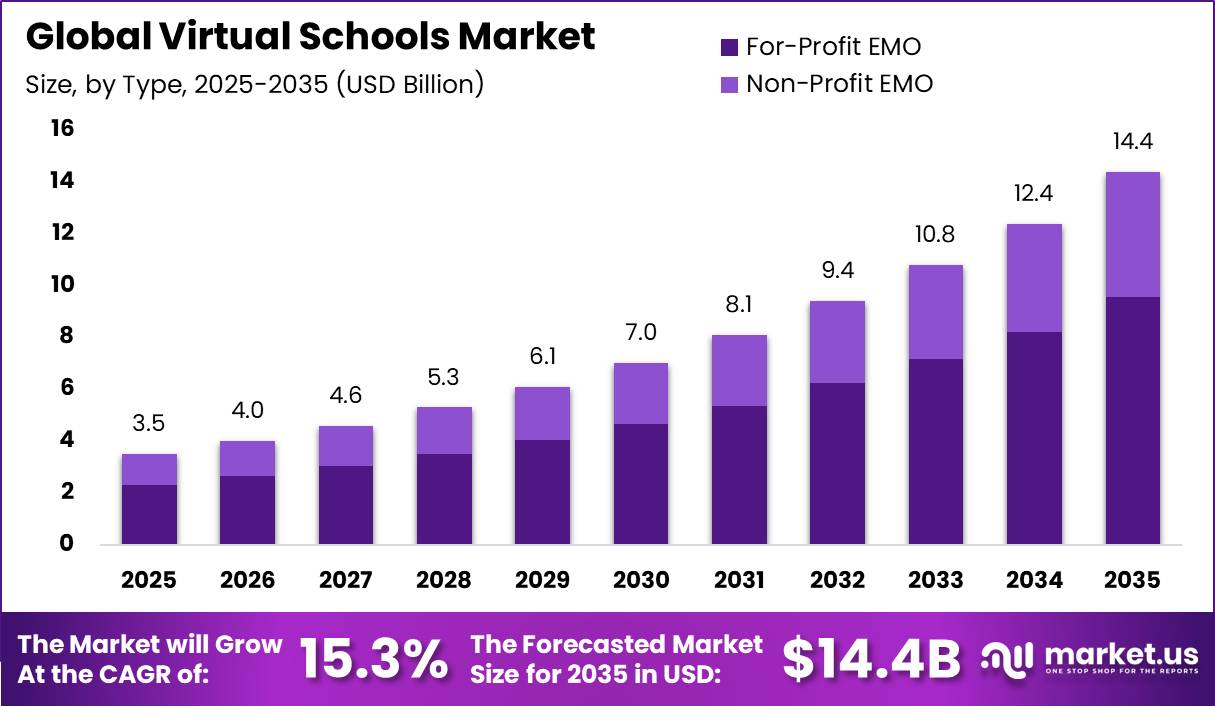
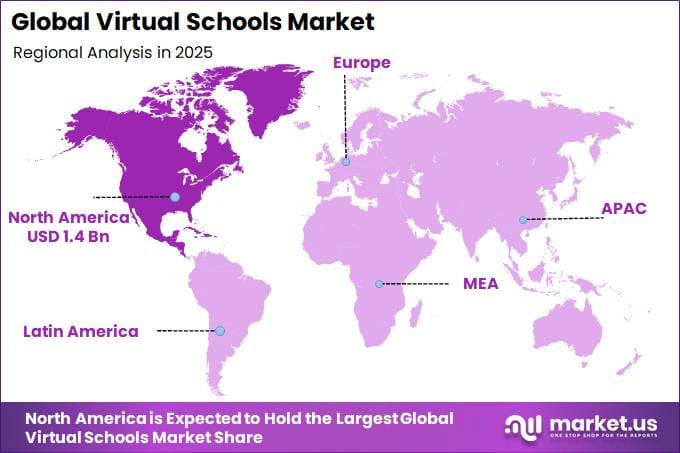
In 2025, the Global Virtual Schools Market was valued at USD 3.5 billion. The market is projected to grow at a CAGR of 15.3% during 2026–2035, reaching approximately USD 14.4 billion by 2035. North America dominated the global market in 2025, accounting for more than 40.3% of the total market share and generating approximately USD 1.4 billion in revenue.
Growth is supported by a large student population, wider use of full-time online education, and improving digital connectivity. According to NCES, U.S. public K–12 enrollment stood at 48.9 million students in 2022–23, including 562,659 students enrolled in fully virtual public schools. This was nearly 2.8 times the 200,343 students recorded in 2013–14.
Virtual-school enrollment also increased sharply to 590,267 students in 2020–21, almost double the 293,689 students in 2019–20. U.S. charter-school enrollment expanded from 2.269 million students in 2012–13 to 3.7 million in 2022–23, an increase of 1.4 million students, or nearly 64%, supporting flexible and digital-first education models.
At the global level, 5.5 billion people, equal to 68% of the population, used the internet in 2024, up by 227 million from 2023. Mobile-cellular subscriptions reached 9.1 billion, while mobile broadband traffic exceeded 1 zettabyte in 2023 and was expected to approach 1.3 zettabytes in 2024.
However, only 40% of primary schools, 50% of lower-secondary schools, and 65% of upper-secondary schools were connected to the internet, while about 1.3 billion children aged 3–17 lacked home internet access, highlighting significant long-term opportunities for virtual-school platforms and digital education services.
Key Takeaway
- The Virtual Schools Market was valued at USD 3.5 billion in 2025 and is projected to reach USD 14.4 billion by 2035, growing at a CAGR of 15.3%.
- The For-Profit EMO segment was dominated by type, with a 66.3% share.
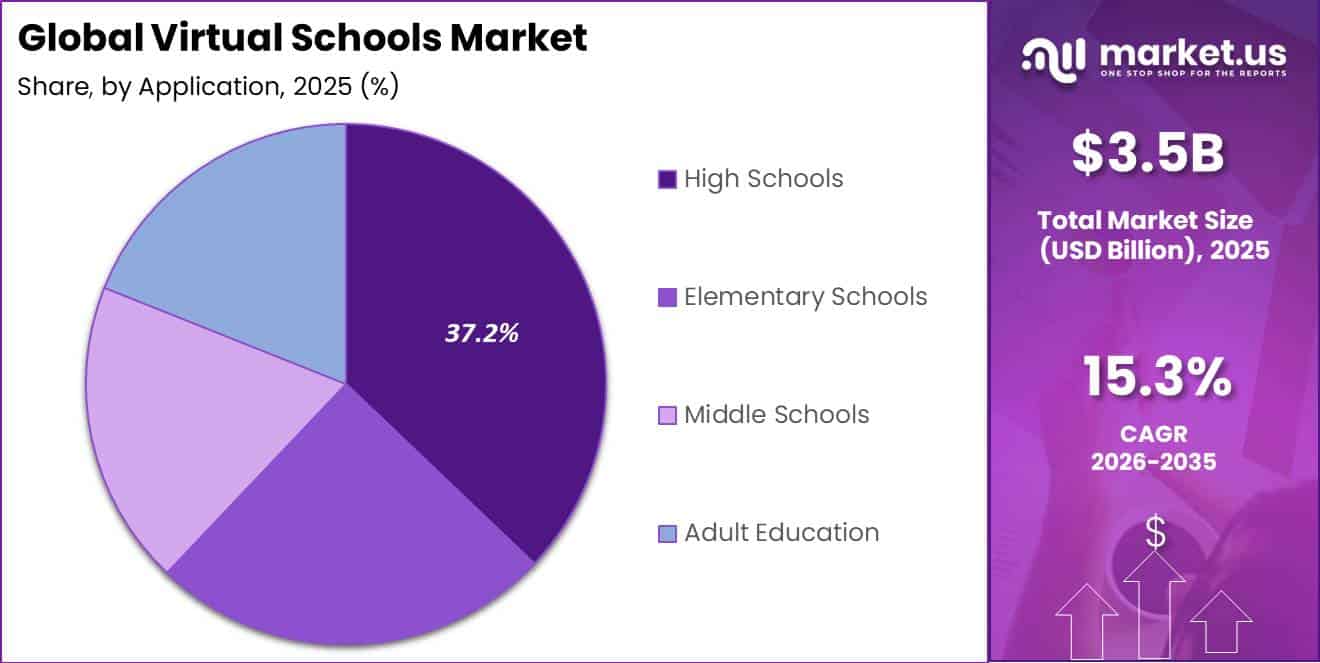
- The High Schools segment was led by application with a 37.2% share.
- North America led the market in 2025 with a 40.3% share, generating around USD 1.4 billion in revenue.
Market Statistics and Data Insights
- U.S. fully virtual public-school enrollment reached 562,659 students in 2022–23, compared with 200,343 in 2013–14, representing an increase of about 181%. Enrollment temporarily reached 590,267 students in 2020–21, showing how rapidly virtual-school capacity can scale.
- Total U.S. public-school enrollment reached 49.5 million students in fall 2023. Grades 9–12 accounted for 15.6 million students, up from 15.2 million in 2019, while pre-K through grade 8 enrollment fell to 33.9 million.
- In Australia, more than 16,000 students were enrolled in established distance-learning schools according to an Australian Department of Education review.
- Individual systems included around 4,000 students at Virtual School Victoria, 3,850 at Brisbane School of Distance Education, 2,300 at Western Australia’s School of Isolated and Distance Education, and 4,700 at South Australia’s Open Access College.
- The same Australian government review reported that a proposed virtual-school model offering only 80 places attracted interest from more than 2,000 potential applicants, indicating strong unmet consumer interest in structured online schooling.
- Approximately 6.0 billion people, equal to 74% of the global population, used the internet in 2025, increasing by more than 240 million users in one year. However, about 2.2 billion people remained offline.
- Internet use among people aged 15–24 reached 82% globally in 2025, compared with 72% among the rest of the population. This higher connectivity among younger people supports the long-term addressable base for digital education.
- UNESCO reports that only 40% of primary schools, 50% of lower-secondary schools, and 65% of upper-secondary schools globally have internet connectivity. This remains one of the clearest infrastructure barriers to large-scale virtual-school deployment.
- Globally, only 47% of primary schools, 62% of lower-secondary schools, and 76% of upper-secondary schools had computers available for pedagogical purposes in UNESCO’s globally comparable dataset.
- Florida Virtual School reported more than 24,000 FLVS Flex seniors taking individual online courses as of April 15, 2026. Students used the courses to accelerate learning, explore additional subjects, earn credits, or fit education around athletics, arts, and other commitments.
- FLVS serves more than 230,000 students annually, delivers more than 200 online courses, and supports both full-time and individual-course virtual learning from kindergarten through grade 12.
By Type
The For-Profit Education Management Organization (EMO) segment dominates the virtual schools market with a 66.3% share, supported by its ability to manage large online-school networks through centralized technology, curriculum, enrollment, teacher support, and data systems. This operating model helps reduce the cost per student as enrollment increases.
U.S. Department of Education-supported research showed that for-profit EMOs managed 180 full-time virtual schools in 2021–22, serving 266,970 students, or 46.1% of total full-time virtual-school enrollment. Average enrollment reached 1,483 students per school, compared with 656 students in nonprofit EMO schools and 562 students in independent virtual schools.
This larger scale gives for-profit operators stronger buying power for cloud platforms, digital learning tools, online content, and student-support services. Stride/K12 alone operated 78 virtual schools and served 134,525 students, representing around 23% of the estimated 578,659 full-time virtual-school students. The U.S. Government Accountability Office also reported that 42% of virtual charter schools had contracts with for-profit management organizations.
By Application
The High Schools segment dominates the virtual schools market with a 37.2% share, supported by strong demand for flexible schedules, credit recovery, exam preparation, and broader course options for students in grades 9–12. According to the U.S. National Center for Education Statistics, public high-school enrollment reached 15.6 million students in fall 2023, compared with 15.2 million in 2019.
High school was the only major U.S. public-school level to record enrollment growth during this period, while enrollment from pre-kindergarten through grade 8 declined. Virtual learning is especially useful at the high-school level because students often need specialist subjects such as Advanced Placement, career and technical education, world languages, and higher-level mathematics.
Digital platforms allow certified teachers to reach students across multiple locations, helping schools expand course availability without hiring separate specialist teachers at every site. NCES data also showed that 77.2% of public high schools offered Advanced Placement courses in 2020–21, although access remained uneven across locations.
Key Market Segments
By Type
- For-Profit EMO
- Non-Profit EMO
By Application
- High Schools
- Elementary Schools
- Middle Schools
- Adult Education
Geopolitical Impact Analysis
Geopolitical disruption can affect the virtual schools market by increasing the cost and reducing the availability of laptops, tablets, routers, webcams, display panels, network equipment, and data-centre hardware. Red Sea attacks forced many ships to avoid the Suez Canal and travel around the Cape of Good Hope.
UNCTAD estimated that these longer routes increased demand for container-shipping capacity by about 12% between mid-December 2023 and June 2024, while nearly 2.5 million TEU, equal to 8.4% of global capacity, remained at anchorages by mid-June 2024. The China Containerized Freight Index increased by 120% from October 2023 to June 2024, while Red Sea disruption contributed around 148 percentage points of upward pressure.
Shanghai-to-Northern Europe spot freight rates reached USD 2,648 per TEU on 9 February 2024, about 256% above early-November 2023 levels. As many education devices and electronic components are produced in Asia, higher freight costs and longer delivery times can delay virtual-school expansion and device replacement. Trade tensions create additional cost pressure.
U.S. Section 301 tariffs cover about USD 360 billion of Chinese imports, with rates ranging from 7.5% to 25%. Tariffs on Chinese semiconductors and lithium-ion batteries were also raised to 50% and 25%, respectively. Energy costs remain another concern, as data centres support cloud learning and video classes. Global data-centre electricity consumption reached 415 TWh in 2024, representing 1.5% of global electricity use, and is projected to reach around 945 TWh by 2030.
Regional Analysis
North America dominated the global virtual schools market in 2025, accounting for a 40.3% share and generating around USD 1.4 billion in revenue. The region benefits from strong digital infrastructure, established virtual charter and district-school models, public education funding, and widespread access to connected devices. According to the U.S. National Center for Education Statistics, 97% of children aged 3–18 had home internet access in 2021, while 93% had internet access through a computer.
In the 2024–25 school year, 58% of U.S. public schools also operated a one-to-one computing program, providing each student with a school-issued laptop or tablet. These factors support large-scale adoption of virtual-school services for credit recovery, advanced courses, special education, and flexible learning.
Asia Pacific is expected to be the fastest-growing regional market, supported by its large student population and improving internet, device, cloud, and digital-service infrastructure. The World Bank estimates that East Asia and the Pacific has around 331 million school-age children, representing about one-quarter of the global school-age population.
Key Regions and Countries
North America
- US
- Canada
Europe
- Germany
- France
- The UK
- Spain
- Italy
- Rest of Europe
Asia Pacific
- China
- Japan
- South Korea
- India
- Australia
- Rest of APAC
Latin America
- Brazil
- Mexico
- Rest of Latin America
Middle East & Africa
- GCC
- South Africa
- Rest of MEA
Market Dynamics
Drivers
| Driver | (~) % CAGR | Geographic Relevance | Impact Timeline |
|---|---|---|---|
| District digital-course adoption | +2.2% | North America | Short term (2 years or less) |
| High-school course flexibility | +1.8% | North America and Europe | Short term (2 years or less) |
| Cloud-based learning delivery | +1.5% | Global | Medium term (2 to 4 years) |
| Career-pathway digitization | +1.2% | North America and Asia Pacific | Medium term (2 to 4 years) |
| Public-school device programs | +1.0% | North America | Short term (2 years or less) |
District digital-course adoption is a strong growth driver for virtual schools. U.S. public elementary and secondary enrollment remained close to 49 million students in 2023, creating a large customer base for online courses, learning management systems, digital assessments, and student-information platforms. Fully virtual public-school enrollment also exceeded 560,000 students in 2022–23, showing continued demand for online education.
The FCC’s E-Rate program has provided more than USD 4 billion annually for eligible connectivity services in recent funding cycles, helping schools reduce network costs and adopt digital learning tools. Lower infrastructure costs can support recurring spending on software, content, and support services, contributing an estimated +2.2% incremental CAGR to market growth.
Restraints
| Restraint | (~) % CAGR | Geographic Relevance | Impact Timeline |
|---|---|---|---|
| Virtual-charter oversight limits | -2.0% | United States | Short term (2 years or less) |
| Public procurement budget caps | -1.5% | North America and Europe | Short term (2 years or less) |
| Home broadband affordability | -1.3% | Emerging markets | Medium term (2 to 4 years) |
| Student data privacy rules | -1.1% | Europe and North America | Short term (2 years or less) |
| Attendance funding constraints | -0.9% | United States | Medium term (2 to 4 years) |
Virtual-charter oversight remains a key market challenge. The U.S. Government Accountability Office found that 42% of virtual charter schools reviewed had contracts with for-profit management organizations, increasing scrutiny around public funding, student assessment, and financial reporting. GAO also reported weaker average student outcomes in several measures compared with brick-and-mortar charter schools.
More than 560,000 students were enrolled in fully virtual public schools in 2022–23, according to NCES. Stricter authorization, reporting, and renewal requirements can therefore slow new-school openings and enrollment growth while increasing compliance and legal costs. These pressures are estimated to create around a -2.0% CAGR drag on the virtual schools market.
Challenges
| Challenge | (~) % CAGR | Geographic Relevance | Mitigation Horizon |
|---|---|---|---|
| School connectivity gap | -1.8% | Global | Long term (4 years or more) |
| Teacher digital skills | -1.4% | Global | Medium term (2 to 4 years) |
| Cybersecurity threat exposure | -1.2% | North America and Europe | Medium term (2 to 4 years) |
| Learning outcome measurement | -1.0% | Global | Medium term (2 to 4 years) |
| Device replacement cycles | -0.8% | Global | Short term (2 years or less) |
The school connectivity gap remains a major challenge for virtual education. Only 40% of primary schools, 50% of lower-secondary schools, and 65% of upper-secondary schools had internet access for teaching. In addition, only about 50% of primary schools had computers for learning, while 2.6 billion people remained offline in 2024.
Limited connectivity forces providers to invest in offline content, low-bandwidth platforms, device support, and local service teams. These additional requirements increase operating costs, slow deployment, and reduce service quality in rural and lower-income markets, creating an estimated -1.8% friction drag on market growth.
Opportunities
| Opportunity | (~) % CAGR | Geographic Relevance | Execution Window |
|---|---|---|---|
| Cross-border course licensing | +2.1% | Asia Pacific, Middle East, Africa | Long term (4 years or more) |
| AI tutoring subscriptions | +1.8% | Global | Medium term (2 to 4 years) |
| Workforce credential pathways | +1.6% | North America and Asia Pacific | Medium term (2 to 4 years) |
| Rural hybrid learning hubs | +1.3% | Emerging markets | Long term (4 years or more) |
| School cybersecurity services | +1.0% | North America and Europe | Short term (2 years or less) |
Cross-border course licensing remains a future opportunity, as providers must meet local curriculum, language, assessment, and data-governance requirements before expanding internationally. Asia and the Pacific has around 331 million school-age children, while global internet users reached 5.5 billion in 2024, creating a large potential base for localized digital learning.
Licensing can lower delivery costs because one approved digital course can serve multiple schools without adding physical classrooms or specialist teachers. If providers turn fixed content-development costs into multi-country subscription revenue, gross margins could improve by around 5%–10%, supporting up to +2.1% CAGR upside over the baseline.
Key Players Analysis
The virtual schools market is concentrated around a small group of large operators, while many regional, private, nonprofit, and public providers do not report separate financial results. Tier-1 leadership includes Stride, Inc., the parent company of K12 and a major for-profit virtual-school operator. Stride generated USD 2.04 billion in FY2024 revenue, increasing by USD 202.7 million, or 11.0%, year over year.
General Education revenue grew by USD 157.8 million, or 13.9%. The company served 194,300 enrollments, up 16.1%, and recorded USD 249.6 million in operating income, compared with USD 165.5 million in FY2023. Pansophic Learning is another important Tier-1/upper Tier-2 operator, managing 91 virtual and blended public schools across 31 states and Washington, D.C., although its private ownership limits financial comparison.
Tier-2 challengers include Discovery Education, Apex Learning, Lincoln Learning Solutions, American School, Ontario Virtual School, Florida Virtual School, Charter Schools USA, and Basehor-Linwood Virtual School. Arizona State University also shows the scale of digital education, reporting FY2024 revenue of USD 4.08 billion, including USD 2.02 billion in net tuition and fees.
Its online tuition revenue was projected at USD 619.9 million in FY2024 and USD 823.9 million by FY2026. Large providers benefit from spreading technology, courseware, compliance, and student-support costs across wider enrollment bases.
Top Key Players in the Market
- Charter Schools USA
- Discovery Education Inc.
- Florida Virtual School
- Lincoln Learning Solutions
- Ontario Virtual School Inc.
- Pansophic Learning
- American School
- Apex Learning Inc.
- Arizona State University
- Basehor Linwood Virtual School
Recent Developments
- In 2026, Discovery Education launched the Connected Ecosystem, a unified K–12 framework combining AI-powered teaching tools, adaptive learning, curriculum resources, assessment support, and professional learning. The ecosystem builds on more than 20 years of education experience, while Discovery Education solutions are used in 45% of U.S. K–12 schools.
- In 2025, Florida Virtual School introduced 13 new online courses for the 2025–26 academic year, covering music, technology, entrepreneurship, artificial intelligence, world languages, and Advanced Placement subjects. Key additions included a K–5 Music Suite and 2 Career and Technical Education courses. Earlier in 2025, FLVS reported serving more than 230,000 students, showing the large learner base available for its expanding digital curriculum.
Report Scope
| Report Features | Description |
|---|---|
| Market Value (2025) | USD 3.5 Billion |
| Forecast Revenue (2035) | USD 14.4 Billion |
| CAGR (2026-2035) | 15.3% |
| Base Year for Estimation | 2025 |
| Historic Period | 2020-2024 |
| Forecast Period | 2026-2035 |
| Report Coverage | Revenue Forecast, Market Dynamics, Competitive Landscape, Recent Developments |
| Segments Covered | By Type (For-Profit EMO, Non-Profit EMO), By Application (High Schools, Elementary Schools, Middle Schools, Adult Education) |
| Regional Analysis | North America – US, Canada; Europe – Germany, France, The UK, Spain, Italy, Rest of Europe; Asia Pacific – China, Japan, South Korea, India, Australia, Singapore, Rest of APAC; Latin America – Brazil, Mexico, Rest of Latin America; Middle East & Africa – GCC, South Africa, Rest of MEA |
| Competitive Landscape | Charter Schools USA, Discovery Education Inc., Florida Virtual School, Lincoln Learning Solutions, Ontario Virtual School Inc., Pansophic Learning, American School, Apex Learning Inc., Arizona State University, Basehor Linwood Virtual School |
| Customization Scope | We will provide customization for segments and region/country levels. Additional customization can be done based on requirements. |
| Purchase Options | We have three licenses to opt for: Single User License, Multi-User License (Up to 5 Users), Corporate Use License (Unlimited Users and Printable PDF) |





























