


Report Overview
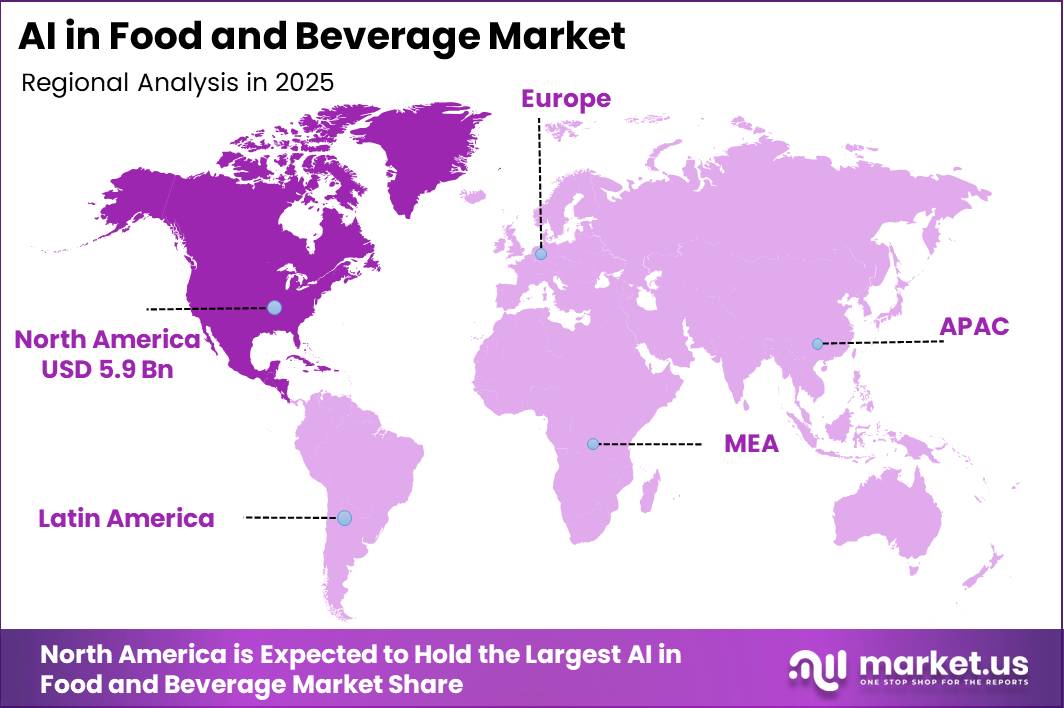
In 2025, the Global AI In Food And Beverage Market was valued at USD 14.8 billion. The market is projected to grow at a CAGR of 37.1% during 2026–2035, reaching approximately USD 348.4 billion by 2035. North America dominated the global market in 2025, accounting for more than 39.6% of the total market share and generating approximately USD 5.9 billion in revenue.
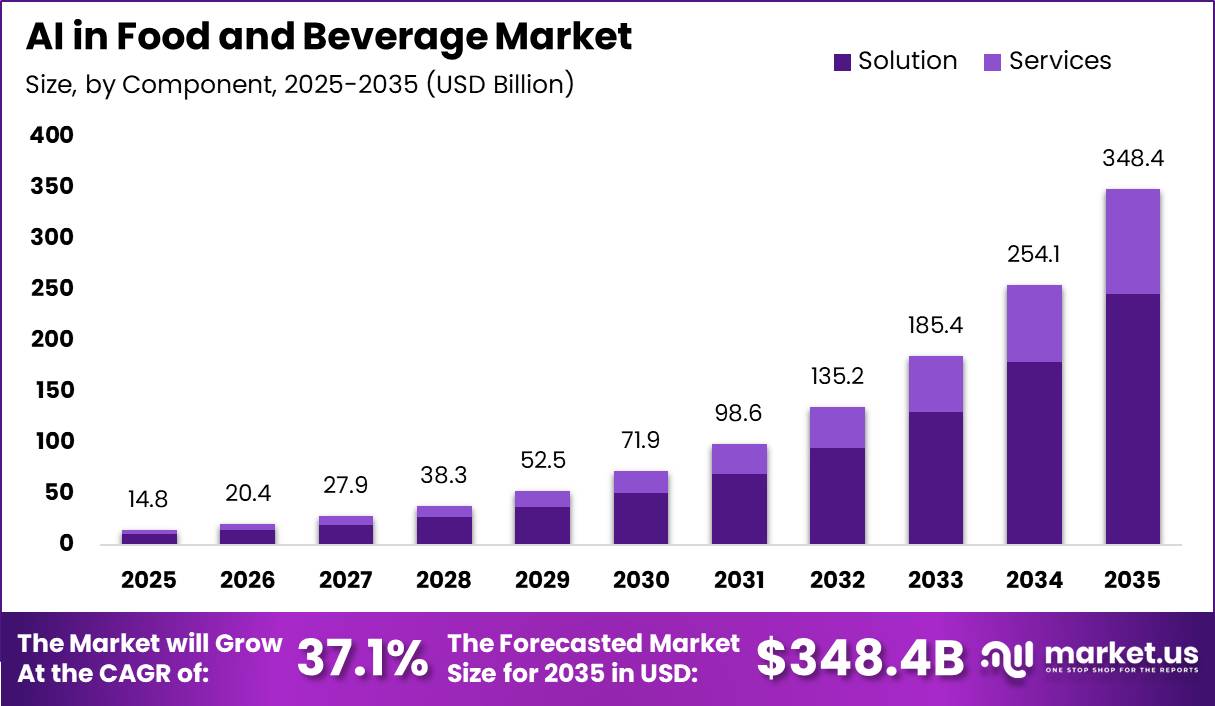
The rising scale and complexity of the global food system support growth. FAO data shows that worldwide primary crop production reached 9.9 billion tonnes in 2023, increasing by 27% from 2010. Global meat production reached 374 million tonnes, while milk output rose to 985 million tonnes in 2024. Managing these large volumes requires better forecasting, quality control, production planning, and waste reduction.
AI helps food producers improve demand forecasting, optimize yields, automate sorting, reduce labor costs, and strengthen supply-chain efficiency. In the United States, agriculture, food, and related industries contributed around USD 1.5 trillion to GDP in 2023, representing 5.5% of the economy, while supporting more than 10% of national employment.
Food-away-from-home spending also increased to USD 1.3 trillion in 2023 from USD 376 billion in 1997, encouraging restaurants and processors to use AI for inventory management, personalized menus, and predictive maintenance. North America held more than 39.6% of the market and generated about USD 5.9 billion in 2025, supported by a large processing base and early investment in digital systems. Global food exports also increased nearly fivefold between 2000 and 2022, reaching USD 1.8 trillion.
Key Takeaway
- The AI In Food And Beverage Market is valued at USD 14.8 billion in 2025, projected to reach USD 348.4 billion by 2035 at a CAGR of 37.1%.
- The Solution segment was dominated by Component, holding 70.4% of total revenue.
- Production and Processing was led by Application, accounting for 34.5% of the market.
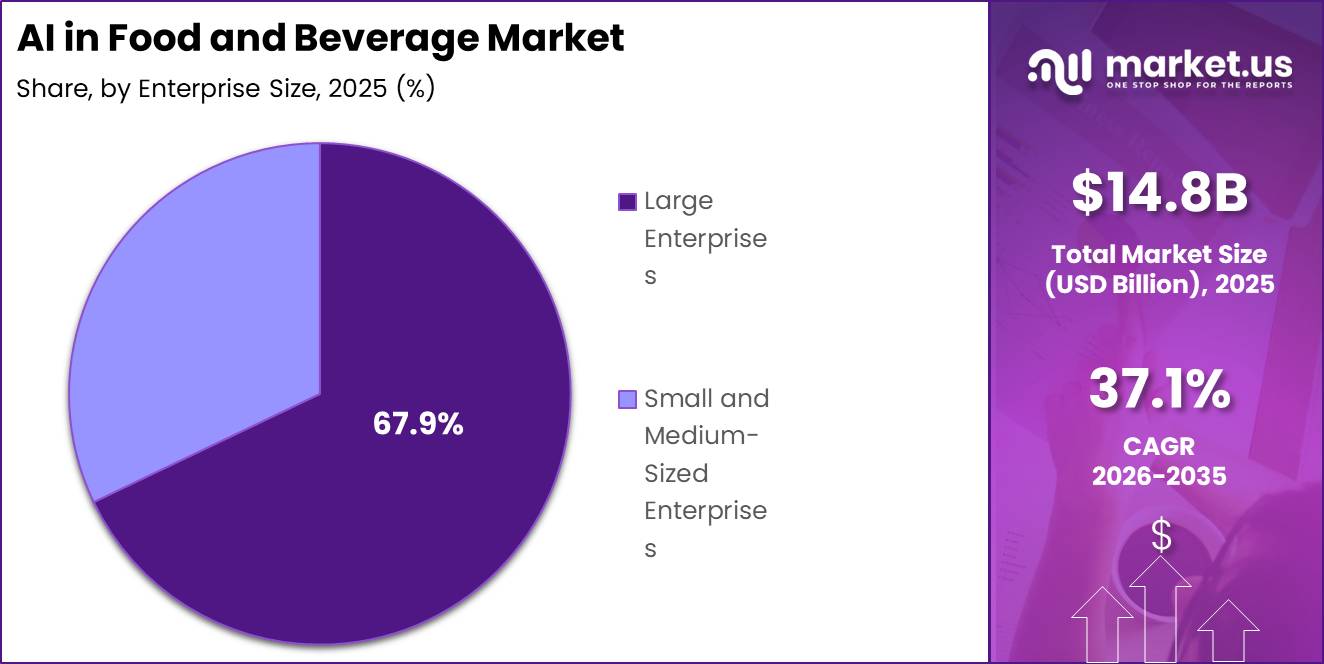
- Large Enterprises accounted for 67.9% of total AI spending by Enterprise Size.
- Food and Beverage Manufacturers held a 65.7% share by End-User.
- North America led the market with a 39.6% share, generating USD 5.9 billion in revenue in 2025.
Market Statistics and Data Insights
- An AI-based food waste tracking system tested across hotels, restaurants, and catering facilities in Europe reduced food waste by 23% to 51% and lowered wasted food cost per meal by up to 39% compared with baseline operations in 2025.
- The same AI waste-monitoring study recorded baseline food waste levels ranging from 76.2 g to 121.0 g per meal in hotels, 99.4 g per meal in business catering, and 151.9 g per meal in restaurants before AI intervention.
- AI food inspection technology used in pizza manufacturing achieved more than 95% detection accuracy and reduced inspection time to below 250 milliseconds per pizza in a 2025 industrial case study.
- A 2025 AI food waste estimation study using computer vision models achieved at least 90% Distributional Pixel Agreement (DPA) for different food categories, enabling real-time food waste measurement in institutional dining environments.
- AI-based computer vision systems for fruit and vegetable grading demonstrated classification accuracy exceeding 95% for automated quality assessment and sorting applications in 2025 research.
- AI-enabled food inspection systems using YOLO-based computer vision models achieved 99% inspection accuracy in an industrial food quality-control application in 2025.
- AI-based automated waste tracking systems identified avoidable food waste levels ranging from 45% to 73% of total food waste across analyzed foodservice locations in a 2025 study.
- A 2025 study on AI adoption in the food and beverage sector surveyed 305 food and beverage SMEs to evaluate AI adoption, digital capability, and operational efficiency impacts.
- A 2024 computer vision food recognition study trained AI models using the Food11 dataset containing 16,643 food images to improve automated food recognition capabilities.
- An AI-powered food waste monitoring trial at a Nestlé factory achieved an 87% reduction in edible food waste during a two-week testing period, with the potential to save up to 700 tonnes of surplus food and prevent 1,400 tonnes of CO₂ emissions.
- AI-enabled food recycling technology developed for commercial food waste management can reduce food waste volume by up to 80% through automated processing systems.
By Component
The solution segment held a dominant position in the AI in Food and Beverage Market, accounting for 70.4% of total revenue. Its leadership is supported by rising demand for complete, ready-to-use AI platforms instead of separate tools and services. Global food exports reached approximately USD 1.4 trillion, increasing 3.7-fold from 2000. This expansion has made food supply chains more complex, as manufacturers must manage more products, export destinations, suppliers, and regulatory requirements.
In the United States, food-away-from-home spending increased from USD 336 billion in 1997 to around USD 1.5 trillion in 2024, representing growth of more than four times. This increase has encouraged restaurants and foodservice operators to automate and standardize their activities. Integrated AI solutions combine data collection, predictive models, dashboards, and workflow systems within a single platform.
By Application
The production and processing segment held a dominant position in the AI in Food and Beverage Market, accounting for 34.5% of the total market. Its leadership is supported by the large volume of raw materials, packaged foods, and processed products handled at the manufacturing stage. In the United States, total food spending reached USD 2.5 trillion in 2025, while food-at-home spending accounted for USD 1.1 trillion. This scale creates strong demand for efficient and consistent production systems.
Globally, food and agricultural trade reached approximately USD 1.9 trillion in 2022, nearly five times its value in 2000. The continued expansion of international trade has increased the need for standardized and high-speed processing systems. As a result, AI-based process control, predictive maintenance, and quality monitoring are becoming important tools for food manufacturers, supporting the continued dominance of production and processing.
By Enterprise Size
Large enterprises held a dominant position in the AI in Food and Beverage Market, accounting for 67.9% of total AI spending. Their leadership is supported by their control over a large share of global industrial food production and their ability to invest in advanced digital systems. FAO data shows that value added from global agriculture, forestry, and fishing reached USD 3.8 trillion in 2022, representing an 89% real increase from 2000.
A considerable portion of this output moves through large food processing and branded manufacturing companies that operate several production plants and handle millions of tonnes of raw materials each year. At this scale, a 1–2% improvement in equipment performance, production yield, or operating efficiency can generate tens of millions of dollars in annual savings for a single company.
AI-supported predictive maintenance, quality analysis, and production-line optimization help these businesses reduce downtime, waste, and defects. In the United States, food-away-from-home spending increased from USD 336 billion in 1997 to approximately USD 1.5 trillion in 2024. This growth has strengthened demand for high-volume and standardized food production.
By End-User
Food and beverage manufacturers held a dominant position in the AI in Food and Beverage Market, accounting for 65.7% of total end-user adoption. Their leadership is supported by their central role in converting raw ingredients into finished food products, where better process control can directly improve quality and profitability. In the United States, total food spending reached USD 2.5 trillion in 2025, including USD 1.4 trillion spent on food away from home.
USDA data shows that inflation-adjusted food-away-from-home spending increased from USD 818 billion in 1997 to USD 1.4 trillion in 2025, representing growth of 72%. This rising demand requires manufacturers to operate high-volume production facilities with consistent quality and limited downtime. Small errors in mixing, cooking, filling, labeling, or packaging can result in major product losses across millions of units and thousands of tonnes of processed food.
AI systems help manufacturers analyze production-line data, monitor batch records, identify quality problems, and predict equipment failures before breakdowns occur. These capabilities reduce waste, improve equipment uptime, lower recall risks, and maintain products within required specifications. As a result, manufacturers allocate larger AI budgets than retailers and restaurants because even a 1% improvement in yield or production efficiency can generate significant savings across large-scale operations.
Key Market Segments
By Component
- Solution
- Services
By Application
- Production and Processing
- Quality Control and Inspection
- Demand Forecasting
- Customer Service and Engagement
- Other
By Enterprise Size
- Large Enterprises
- Small and Medium-Sized Enterprises
By End-User
- Food and Beverage Manufacturers
- Restaurants and Food Service Providers
- Other
Geopolitical Impact Analysis
Geopolitical tensions are changing the cost structure and risk profile of the AI in Food and Beverage Market by disrupting energy supplies, international trade, shipping routes, and cold-chain operations. The global trade-weighted average tariff on merchandise has reached around 3.9%, while agricultural products in many economies face average most-favoured-nation tariff rates of approximately 10–15%.
These duties increase the landed cost of grains, vegetable oils, sugar, processed ingredients, and packaging materials for manufacturers using international sourcing networks. Energy-market instability is creating further pressure. Average Brent crude oil prices increased from USD 78 per barrel in December 2023 to USD 89 per barrel in April 2024, reaching a peak of USD 93 per barrel on 12 April 2024.
Higher fuel prices increase fertilizer expenses, farm operating costs, refrigerated transport charges, and temperature-controlled shipping rates. These pressures can reduce profit margins for food processors and beverage companies. Shipping disruptions near major trade routes, including the Red Sea and the Strait of Hormuz, can extend delivery periods by 4–6 weeks during stabilization and by 8–13 weeks before complete normalization. Such delays may add 1–3 additional inventory cycles for importers.
As a result, food manufacturers are increasingly using AI-based demand sensing, route optimization, scenario planning, inventory forecasting, energy management, and dynamic pricing tools. These systems help companies respond more effectively to tariffs, fuel-price changes, supply shortages, and extended delivery times for important materials such as cocoa, coffee, edible oils, and packaging resins.
Regional Analysis
North America held a dominant position in the AI in Food and Beverage Market, accounting for 39.6% of total revenue and generating approximately USD 5.9 billion. The region’s leadership is supported by a large and highly automated food-processing industry, advanced digital infrastructure, high labor costs, and strict food-safety requirements.
Asia Pacific is developing as the fastest-growing regional market, supported by rising urban incomes, a growing middle-class population, expanding online grocery activity, and increasing investment in industrial automation and logistics systems. The region’s market share remained below 30% during the early 2020s but is expected to make a significantly larger contribution by 2030.
Countries including China, India, and Japan are increasing the use of AI-enabled robotics, machine learning, and computer vision to manage high-volume food processing while meeting strict hygiene, quality, and cost requirements. North America continues to act as a major center for AI innovation and early deployment, while Asia Pacific is recording the strongest growth momentum.
Key Regions and Countries
North America
- US
- Canada
Europe
- Germany
- France
- The UK
- Spain
- Italy
- Rest of Europe
Asia Pacific
- China
- Japan
- South Korea
- India
- Australia
- Rest of APAC
Latin America
- Brazil
- Mexico
- Rest of Latin America
Middle East & Africa
- GCC
- South Africa
- Rest of MEA
Market Dynamics
Drivers
| Driver | (~) % CAGR | Geographic Relevance | Impact Timeline |
|---|---|---|---|
| Generative AI in product formulation and personalized nutrition | +3.5% | North America, Western Europe | Short term (2 years or less) |
| Computer vision-based automated QA/QC and food safety inspection | +2.8% | Global | Short term (2 years or less) |
| AI-driven demand forecasting and inventory optimization | +2.2% | North America, East Asia | Medium term (2 to 4 years) |
| Dynamic pricing and AI menu engineering in QSR/restaurant chains | +1.8% | North America, Europe | Short term (2 years or less) |
| Robotics and AI-enabled processing line automation | +1.5% | East Asia, Western Europe | Medium term (2 to 4 years) |
Generative AI in product formulation and personalized nutrition
Major consumer packaged goods manufacturers are shifting from trial-and-error recipe development to generative AI formulation systems. These tools can reduce new product development timelines from an average of 18 months to less than 6 months. By analyzing flavor, nutrition, ingredient availability, and supply data, AI can also lower R&D costs per SKU by approximately 22%.
This shift supports subscription-based personalized nutrition platforms instead of one-time product licensing models. Such platforms could improve gross margins by around 4 to 6 percentage points and reduce customer acquisition costs by approximately 15% through more targeted product formulation and marketing. This trend continued to strengthen through late 2025 and early 2026.
Restraints
| Restraint | (~) % CAGR | Geographic Relevance | Impact Timeline |
|---|---|---|---|
| High capital cost and elevated interest rates freezing AI CapEx | -2.5% | Global, acute in emerging markets | Short term (2 years or less) |
| EU AI Act high-risk classification restricting deployment | -1.8% | European Union | Short term (2 years or less) |
| Cross-border data localization laws blocking model deployment | -1.4% | India, China, Southeast Asia | Medium term (2 to 4 years) |
| Legacy plant infrastructure incompatibility halting integration | -1.0% | Latin America, Africa | Short term (2 years or less) |
High capital cost and elevated interest rates freezing AI CapEx
Benchmark policy rates remained near 4.2% to 4.5% in the United States through 2025, while similarly restrictive lending conditions in Europe increased the effective cost of debt-funded AI infrastructure for mid-sized food manufacturers to more than 9%. As a result, payback periods for AI-enabled processing lines extended from a target of 2.5 years to over 4 years, causing several food processors to delay automation investments.
This financing pressure has created a wider gap between large and small manufacturers. Companies with strong balance sheets can absorb AI implementation costs equal to around 12% to 18% of annual processing capital expenditure, while smaller firms continue relying on manual quality-control systems. This can reduce their margins by approximately 150 to 200 basis points and weaken their competitiveness through early 2026.
Challenges
| Challenge | (~) % CAGR | Geographic Relevance | Mitigation Horizon |
|---|---|---|---|
| Hybrid food-data science talent shortage | -1.6% | Global | Medium term (2 to 4 years) |
| Model bias from fragmented supply data | -1.3% | Global, acute in emerging markets | Medium term (2 to 4 years) |
| Legacy ERP and MES integration friction | -1.1% | North America, Europe | Medium term (2 to 4 years) |
| Cybersecurity exposure in connected plants | -0.9% | Global | Long term (4 years or more) |
| Regulator trust and explainability gap | -0.7% | European Union, North America | Long term (4 years or more) |
Hybrid food-data science talent shortage
The structural challenge comes from a shortage of professionals who understand both food science and applied machine learning. Food science graduate output is increasing by less than 3% annually, while AI engineering job postings in the food sector are rising by more than 28% year-on-year. This talent gap can delay AI projects by around 4 to 7 months.
To address the shortage, food manufacturers are investing in internal AI academies, employee training, and university partnerships. Several companies now allocate approximately 2% to 3% of their digital transformation budgets to reskilling programs, helping employees develop the technical skills required for industrial AI adoption through 2025 and 2026.
Opportunities
| Opportunity | (~) % CAGR | Geographic Relevance | Execution Window |
|---|---|---|---|
| AI-enabled personalized nutrition subscription monetization | +2.0% | North America, East Asia | Medium term (2 to 4 years) |
| AI-accelerated alternative protein formulation white space | +1.6% | Global | Long term (4 years or more) |
| M&A roll-up of fragmented AI-in-F&B startups | +1.3% | North America, Europe | Medium term (2 to 4 years) |
| AI-powered carbon and traceability labeling monetization | +1.0% | European Union | Medium term (2 to 4 years) |
| Greenfield AI adoption in emerging market processing | +0.8% | Southeast Asia, Africa | Long term (4 years or more) |
AI-enabled personalized nutrition subscription monetization
This opportunity remains largely untapped because generative AI tools are still mainly used for internal product development rather than consumer subscriptions. Only a low single-digit percentage of eligible households currently use AI-personalized nutrition programs. Most companies continue to depend on one-time product margins of around 28% to 32%, while subscription-based nutrition services could achieve gross margins close to 45%.
Growth will depend on stronger investment in regulatory approval, digital platforms, and direct-to-consumer distribution. Several markets are still developing rules for AI-based dietary advice under food-as-medicine and digital health frameworks. Wider subscription adoption could reduce customer acquisition costs by approximately 18% to 20% through repeat engagement, personalized recommendations, and continuous use of consumer data.
Key Players Analysis
Tier-1 companies in the AI in Food and Beverage Market include major cloud, software, and computing providers supporting large-scale food manufacturing and retail systems. IBM generated USD 67.5 billion in revenue in 2025, including USD 29.9 billion from software. Its Automation and Data businesses contributed USD 7.7 billion and USD 6.3 billion, growing by 17.9% and 11.9%, respectively.
Microsoft recorded USD 281 billion in FY2025 revenue, while Microsoft Cloud generated USD 168 billion and Azure exceeded USD 75 billion, increasing by 34%. Azure and other cloud services grew by 39% in the latest quarter, with AI services contributing 16 percentage points. Oracle reported USD 57.4 billion in FY2025 revenue, including USD 6.7 billion in quarterly cloud revenue, up 27%, and USD 3.0 billion from cloud infrastructure, up 52%.
NVIDIA supports this group through data-center revenue worth tens of billions of dollars. Together, Tier-1 providers are estimated to influence more than 60–70% of relevant AI infrastructure and platform spending.
Tier-2 companies focus on factory automation and specialized applications. ABB generated around USD 32.6 billion in 2024, while Honeywell reported approximately USD 36–38 billion. Rockwell Automation recorded nearly USD 9 billion in FY2024 revenue. TOMRA generated EUR 398 million in Q4 2024, up 12%, while its Food division reached EUR 91 million, up 13%. Its food order backlog increased by 6% to EUR 108 million.
Specialists such as Tastewise, Blue Yonder, Analytical Flavor Systems, and Sight Machine generally operate at revenue levels ranging from tens to low hundreds of millions. Tier-2 and niche providers are estimated to hold 25–40% of solution and service revenue.
Top Key Players in the Market
- IBM Corporation
- Microsoft Corporation
- Oracle Corporation
- TOMRA Systems ASA
- ABB Ltd.
- Honeywell International Inc.
- Rockwell Automation, Inc.
- NVIDIA Corporation
- Tastewise
- Blue Yonder Group, Inc.
- Analytical Flavor Systems, Inc.
- Sight Machine
Recent Developments
- In April 2026, TOMRA Systems ASA: TOMRA reported that its Food division generated EUR 79 million in Q1 2026 revenue, increasing by 13% year-on-year and 17% in constant currency. The division’s order backlog rose from EUR 125 million to EUR 137 million, while quarterly order intake reached EUR 80 million. The results reflected continued commercial demand for advanced food sorting and processing systems.
- In February 2026, IBM: IBM reported total 2025 revenue of USD 67.5 billion, including USD 29.9 billion from Software. Automation revenue increased by 17.9% to USD 7.7 billion, while Data revenue grew by 11.9% to USD 6.2 billion. IBM linked the Data segment’s performance to demand for generative AI products, supporting automation and analytics applications across manufacturing, retail, and supply chains.
- In June 2025, Mondelez International: FoodNavigator reported that Mondelez used its AI product-development platform to support the creation of 70 SKUs. The system enabled product formulations to be developed between 2 and 5times faster than traditional processes while keeping human product developers involved in testing and final decisions.
Report Scope
| Report Features | Description |
|---|---|
| Market Value (2025) | USD 14.8 Billion |
| Forecast Revenue (2035) | USD 348.4 Billion |
| CAGR (2026-2035) | 37.1% |
| Base Year for Estimation | 2025 |
| Historic Period | 2020-2024 |
| Forecast Period | 2026-2035 |
| Report Coverage | Revenue Forecast, Market Dynamics, Competitive Landscape, Recent Developments |
| Segments Covered | By Component (Solution, Services); By Application (Production and Processing, Quality Control and Inspection, Demand Forecasting, Customer Service and Engagement, Other Applications); By Enterprise Size (Large Enterprises, Small and Medium-Sized Enterprises); By End-User (Food and Beverage Manufacturers, Restaurants and Food Service Providers, Other End-Users) |
| Regional Analysis | North America – US, Canada; Europe – Germany, France, The UK, Spain, Italy, Rest of Europe; Asia Pacific – China, Japan, South Korea, India, Australia, Singapore, Rest of APAC; Latin America – Brazil, Mexico, Rest of Latin America; Middle East & Africa – GCC, South Africa, Rest of MEA |
| Competitive Landscape | IBM Corporation, Microsoft Corporation, Oracle Corporation, TOMRA Systems ASA, ABB Ltd., Honeywell International Inc., Rockwell Automation Inc., NVIDIA Corporation, Tastewise, Blue Yonder Group Inc., Analytical Flavor Systems Inc., Sight Machine |
| Customization Scope | Customization for segments, region/country-level will be provided. Additional customization can be done based on requirements. |
| Purchase Options | We have three licenses to opt for: Single User License, Multi-User License (Up to 5 Users), Corporate Use License (Unlimited Users and Printable PDF) |





























