


Report Overview
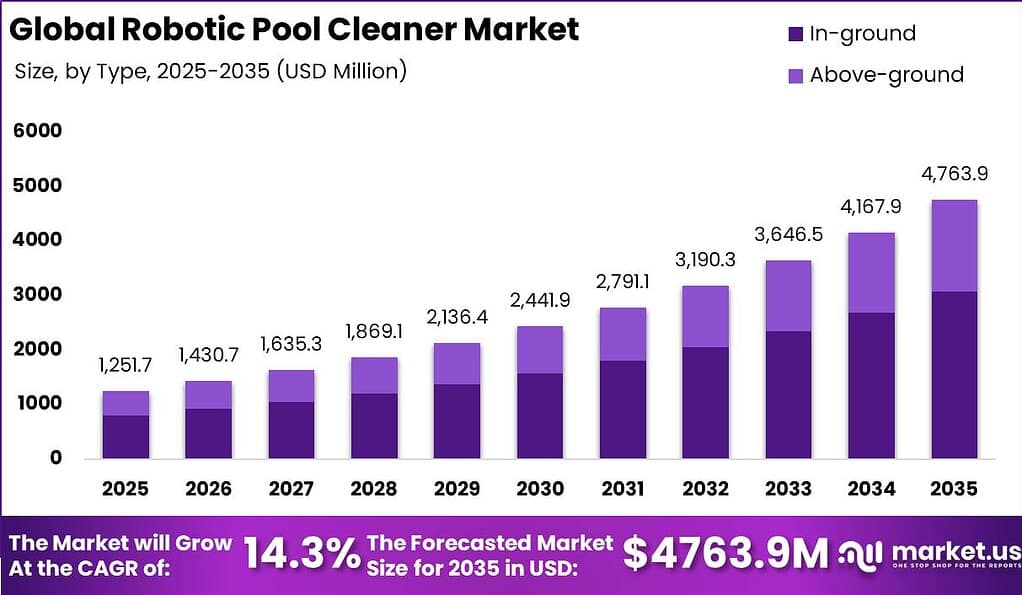
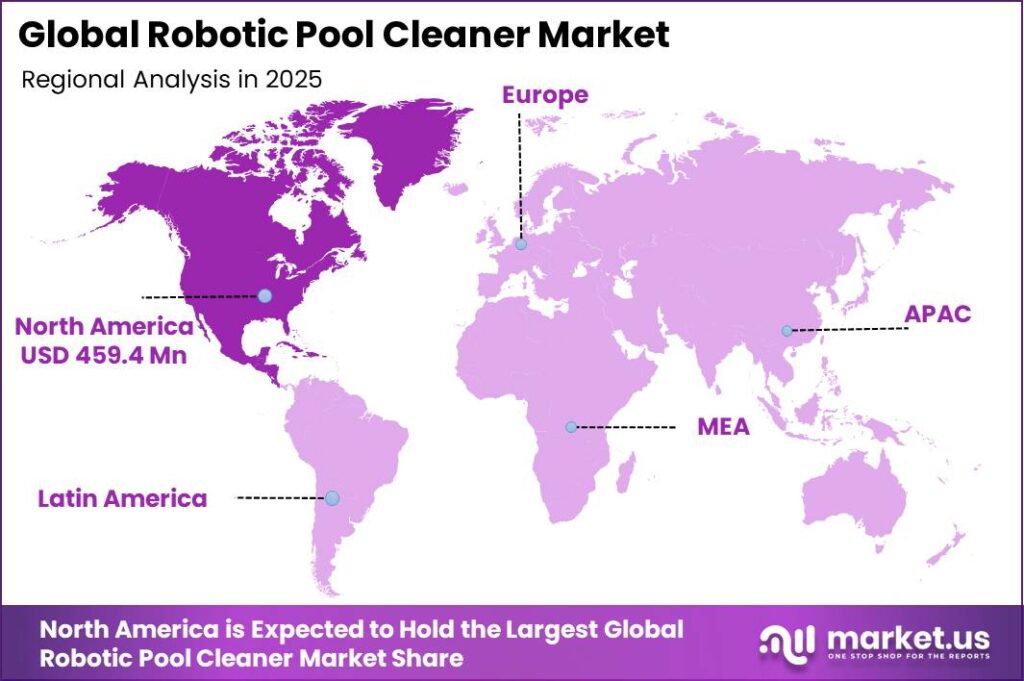
In 2025, the Global Robotic Pool Cleaner Market was valued at USD 1251.7 million. The market is projected to grow at a CAGR of 14.3% during 2026–2035, reaching approximately USD 4,763.9 million by 2035. North America dominated the global market in 2025, accounting for more than 36.7% of the total market share and generating approximately USD 459.37 million in revenue.
In the United States alone, industry data shows around 10.4 million residential swimming pools and roughly USD 8.8 billion in swimming pool cleaning services revenue in 2025, indicating that millions of pools require frequent cleaning and that owners already spend billions on maintenance, creating a clear economic base that can shift toward automated, higher‑efficiency robotic solutions.
North America’s more than 36.7% share of robotic pool cleaner revenue in 2025 is supported by its dense pool stock, higher disposable incomes, and strong adoption of automated and energy‑efficient equipment. In the U.S., around 8% of households own a swimming pool, and most of these are in warmer states where pools are used for longer seasons, increasing the frequency and cost of cleaning and pushing both homeowners and service providers toward devices that reduce labor hours per visit and improve throughput per technician.
Key Takeaway
- The global robotic pool cleaner market is projected to grow from USD 1,251.7 million in 2025 to USD 4,763.9 million by 2035, registering a CAGR of 14.3% during the forecast period.
- North America dominates the global market with a 36.7% share, valued at approximately USD 459.37 million in 2025, supported by high pool ownership and advanced technology adoption.
- In-ground pool cleaners lead the market by type with a 64.6% share, owing to their widespread usage in residential and commercial swimming pools.
- Multi-surface cleaning robots account for the largest cleaning type segment with a 69.2% share, driven by demand for efficient cleaning across different pool surfaces.
- Residential users represent the dominant end-user segment with a 77.3% share, fueled by growing adoption of smart and automated home appliances.
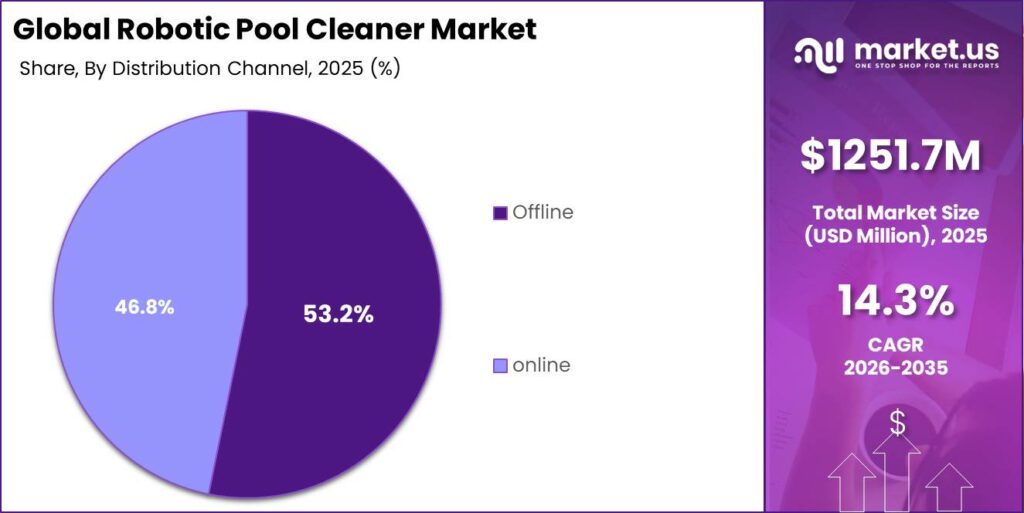
- Offline distribution channels hold a leading 53.2% share, supported by consumer preference for specialized pool equipment retailers and home improvement stores.
Market Statistics and Data Insights
- 2025 analysis reports that robotic pool cleaners typically consume 100–200 watts per hour, using 0.2–0.4 kWh during a standard 2-hour cleaning cycle compared with suction cleaners consuming 4–8 kWh over a 4-hour cycle.
- 2025 analysis estimates robotic cleaners cost approximately $0.36–$0.72 per month and $4.32–$8.64 annually to operate, significantly lower than suction cleaners at $7.68–$15.36 monthly and $92–$184 yearly.
- 2026 technical assessment indicates robotic pool cleaners consume around 197 kWh annually, compared with 1,675–2,989 kWh for pump-driven cleaners, delivering a 7.5–15× reduction in energy usage.
- 2025 engineering review highlights that robotic pool cleaners use 75–85% less energy per cycle than traditional pressure-side or suction systems, reducing consumption to 0.27–0.6 kWh per cleaning session.
- 2025 review shows robotic cleaners reduce cleaning time by nearly 50%, lowering cleaning duration from 3–4 hours to 1.5–2 hours while cutting annual energy costs by $384–$756.
- 2025 calculations show common robotic pool cleaners consume approximately 0.24–0.32 kWh daily, with an average unit using about 0.27 kWh under typical residential cleaning conditions.
- 2025 estimates from Australian pool technology providers indicate some robotic cleaners operate below 100 watts per hour, costing less than $0.15 per 2–3-hour cleaning cycle.
- 2025 assessments report that robotic pool cleaners can reduce energy consumption by around 90% compared with suction cleaners, achieving nearly 10× efficiency improvements.
- 2025 payback analysis suggests switching to robotic pool cleaners can generate $420–$680 in annual energy savings with an estimated payback period of 8–12 months.
- Representative robotic pool cleaner models can clean up to 2,100 square feet within 2 hours, filter 18,000 liters per hour, climb walls up to 6 feet, and deliver up to 93% energy savings.
- Advanced robotic pool cleaners offer adjustable cleaning cycles of 1, 2, and 4 hours, enabling efficient operation across different pool sizes and reducing maintenance requirements.
By Type
In 2025, In-ground held a dominant market position, capturing more than a 64.6% share. Demand remained strong because permanent pools typically have larger floors, curved walls, deep ends, steps, and waterlines that require regular automated coverage. Owners also value independent cleaning systems that reduce reliance on the main filtration circuit. This matters because a standard in-ground pool pump can add about $310 to yearly household electricity costs, while efficient replacement pumps use 20% less energy and save roughly $50 annually.
During May and June 2025, seasonal pool openings concentrated purchases of robots fitted with wall-climbing tracks, fine-particle filters, and scheduled cycles. In 2026, replacement demand is widening as households seek lower manual labor and more predictable upkeep. By April 2026, specialty retail employment had reached 1.535 million, improving access to trained in-store guidance for complex pool layouts.
By Cleaning Type
In 2025, Multi-Surface Cleaning held a dominant market position, capturing more than a 69.2% share. The segment benefited from buyers wanting one machine to scrub floors, climb walls, clean the waterline, and handle transitions between tile, vinyl, fiberglass, and concrete. That flexibility cuts the need for separate tools and makes automation more useful in irregular pools with benches, slopes, corners, and attached spas.
Water quality concerns strengthened adoption during June 2025, when updated public guidance again emphasized that chemicals protect swimmers from germs and support disinfection. Mechanical removal of leaves, grit, algae, and fine particles complements that treatment by reducing material left in circulation. Historical inspection evidence also found violations in 54.1% of inspected pools, with 8.3% requiring immediate closure, highlighting the practical value of consistent cleaning.
By End-User
In 2025, Residential held a dominant market position, capturing more than a 77.3% share. Homeowners drove purchases because robotic units replace repetitive brushing and vacuuming with scheduled cleaning that can run before work or overnight. Backyard pools collect leaves, dust, hair, insects, and sunscreen residue, so frequent debris removal helps keep water clearer and reduces pressure on filters. Demand strengthened during May 2025, when families prepared pools for summer use and placed greater attention on safe, visible water conditions.
Safety awareness is especially relevant at homes: the 2025 federal report found 74% of reported child pool or spa drowning deaths occurred in residential settings. Robots do not replace barriers, supervision, testing, or disinfection, but they make routine housekeeping easier to complete consistently. Safety attention continued into June 2026, when authorities reported an average of 5,900 emergency-department-treated nonfatal drowning injuries during 2023–2025.
By Distribution Channel
In 2025, Offline held a dominant market position, capturing more than a 53.2% share. Physical outlets remained important because shoppers often want to inspect weight, cable reach, brush material, filter access, wheel grip, and warranty terms before choosing a cleaner. Store staff can match a unit to pool length, wall finish, steps, slope, and nearby power access, reducing the risk of an unsuitable purchase.
Dealers also support installation advice, fault checks, and local repair intake, which matters for equipment exposed to water, chemicals, heat, and repeated handling. Offline resilience continued in 2026 despite faster digital shopping. In the first quarter, U.S. e-commerce represented 16.9% of total retail sales, leaving most spending outside online transactions; total retail sales reached $1.929 trillion.
By May 2026, retail trade sales were 7.5% above May 2025, supporting dealer traffic and inventory turnover. For robotic cleaners, face-to-face comparison remains useful where buyers need sizing confidence, rapid availability, bundled accessories, and dependable after-sales service from nearby specialists.
Key Market Segments
By Type
- In-ground
- Above-ground
By Cleaning Type
- Single Surface Cleaning
- Multi-Surface Cleaning
By End-User
- Residential
- Commercial
By Distribution Channel
- Online
- Offline
Market Dynamics
Drivers
| Driver | (~) % Impact on CAGR Forecast | Geographic Relevance | Impact Timeline |
|---|---|---|---|
| Accelerating installed pool base | +3.0% | North America, Europe, Australia | Short term (≤ 2 years) |
| Energy-efficiency pool regulations | +2.4% | EU, Australia | Medium term (2–4 years) |
| Premiumization and cordless adoption | +2.0% | Global | Short term (≤ 2 years) |
| Labor cost inflation in pool maintenance | +1.8% | North America, Western Europe | Medium term (2–4 years) |
| Rising residential automation adoption | +1.6% | Global urban markets | Long term (≥ 4 years) |
| Aftermarket service and subscription models | +1.2% | North America, Europe | Medium term (2–4 years) |
Accelerating installed pool base
From 2024 to 2026, residential in-ground and large above-ground pool installations in key markets such as the U.S., France, Spain, and Australia have expanded by an estimated 3–5% annually, adding several hundred thousand new addressable pools and directly lifting demand for robotic cleaners as a replacement for manual and suction solutions.
This installed base effect translates into unit growth where penetration of robotic cleaners still sits below roughly 30% of eligible pools in many regions, allowing incremental attachment rates of 2–4 percentage points per year to support an additional CAGR contribution of about +3.0% versus the baseline 14.3% growth.
As pool construction and renovation quotations in the EU now must include energy performance and equipment details under standards such as NF 17645, robotic cleaners increasingly get specified at the point of sale, shifting business models toward integrated pool packages and raising average revenue per pool project by mid–single-digit percentage points.
For manufacturers and installers, this dynamic supports higher-margin product mixes where robotic units often carry gross margins in the range of 25–35% compared with sub-20% for legacy cleaners while also stabilizing seasonal demand through installed-base upgrade cycles every 5–7 years.
Restraints
| Restraint | (~) % Impact on CAGR Forecast | Geographic Relevance | Impact Timeline |
|---|---|---|---|
| High upfront device cost | -2.6% | Global | Short term (≤ 2 years) |
| Interest rate and credit tightening | -2.1% | North America, Europe | Short term (≤ 2 years) |
| Limited retail channel reach | -1.8% | Emerging markets | Medium term (2–4 years) |
| Grid power price volatility | –1.5% | Europe, Australia | Short term (≤ 2 years) |
| Consumer durability concerns | –1.3% | Global | Medium term (2–4 years) |
| Import tariffs on finished units | –1.0% | Selected markets | Medium term (2–4 years) |
High upfront device cost
Typical robotic pool cleaners retail in the US and EU at price points that are often 3–5x higher than manual or suction-based alternatives, with many mainstream models in the mid- to high-hundreds of local currency units and premium cordless or AI-enabled variants reaching low four-digit price levels, which materially suppresses conversion among cost-sensitive households.
With consumer finance conditions tightening in 2025–2026 and revolving credit APRs frequently above the mid-teens in percentage terms, fewer pools owners are willing to amortize a device that may only reduce outsourced cleaning costs by 40–60 hours of labor per season equating to savings of perhaps 10–20% of annual pool maintenance budgets leading to an estimated drag of around -2.6% on the achievable CAGR versus the baseline.
At the manufacturer level, the bill of materials for robotic units includes motors, pumps, drive systems, batteries, sensors, and plastics, with BOM costs for advanced models often exceeding 40% of net selling price, limiting room for aggressive price cuts without compressing operating margins by several percentage points.
Challenges
| Challenge | (~) % CAGR Friction Drag | Geographic Relevance | Mitigation Horizon |
|---|---|---|---|
| Complex multi-component supply chain | –2.3% | Global manufacturing hubs | Medium term (2–4 years) |
| After-sales service capability gaps | –2.0% | Emerging and secondary markets | Long term (≥ 4 years) |
| Product reliability and maintenance complexity | –1.9% | Global | Medium term (2–4 years) |
| Limited interoperability with smart home | –1.7% | Developed markets | Long term (≥ 4 years) |
| Seasonal demand and inventory planning | –1.5% | Temperate-climate regions | Medium term (2–4 years) |
| Standards and testing complexity | –1.4% | EU, Australia | Medium term (2–4 years) |
Complex multi-component supply chain
Robotic pool cleaners rely on a multi-node supply chain spanning motors, pumps, sensors, batteries, control boards, plastics, and connectivity modules, with key components sourced from Asia, Europe, and North America, creating lead times that can stretch to 8–12 weeks and working-capital cycles extending beyond 120 days for some OEMs.
Volatility in input costs, for example, mid–single-digit percentage swings in copper and plastics prices and high–single-digit to low–double-digit movements in lithium cell pricing over 2024–2026, introduces friction that compresses gross margins by an estimated 2–3 percentage points when not immediately passed through to end-user prices, reducing the willingness of manufacturers to scale aggressively into marginal geographies.
Logistics disruptions and port congestion can add 10–20 days to transit times, forcing distributors to hold buffer inventories equivalent to 1.5–2.0 peak seasons, tying up capital and further limiting upside beyond the baseline CAGR, with this structural friction estimated to shave around -2.3% off the market’s maximum potential growth rate.
In response, corporate strategies increasingly emphasize dual-sourcing of critical parts, regionalized assembly, and closer alignment of production schedules with pool construction cycles, but these adjustments typically require 2–4 years of CapEx and supplier development to fully normalize supply risk, keeping the drag in place through the baseline period.
Opportunities
| Opportunity | (~) % Potential CAGR Upside | Geographic Relevance | Execution Window |
|---|---|---|---|
| AI-enabled fleet management for commercial pools | +2.8% | Global hospitality and municipal sectors | Medium term (2–4 years) |
| Subscription-based hardware-as-a-service models | +2.5% | North America, Europe | Medium term (2–4 years) |
| Integration with standardized pool energy ratings | +2.2% | EU, Australia | Long term (≥ 4 years) |
| Emerging market expansion via local manufacturing | +2.0% | Asia, Latin America, Middle East | Long term (≥ 4 years) |
| Data-driven water quality analytics add-ons | +1.9% | Global | Medium term (2–4 years) |
| Cross-selling with energy-efficient pool equipment | +1.7% | EU, Australia, selective U.S. states | Short term (≤ 2 years) |
AI-enabled fleet management for commercial pools
This opportunity centers on deploying networked robotic cleaners across portfolios of hotel, resort, water park, and municipal pools, layered with AI-based scheduling and remote diagnostics to optimize cleaning cycles, energy usage, and labor allocation, a segment that remains largely underpenetrated compared with residential pools despite thousands of commercial facilities in each major region.
By instrumenting fleets with sensor telemetry and cloud analytics, operators can shift from manual nightly cleaning routines of 2–4 hours per pool to automated cycles that reduce labor time by up to 50% and cut energy consumption of associated pumps and equipment by low–double-digit percentages, improving facility-level operating margins by an estimated 3–5 percentage points.
Vendors that build recurring software and service revenues such as fleet dashboards, remote monitoring, and predictive maintenance contracts priced at a few percentage points of capex per year can move their revenue mix from predominantly hardware (often 70–80% today) toward a more balanced model, lifting blended gross margins by 5–10 percentage points and supporting an incremental CAGR upside of around +2.8% above the baseline if adoption scales over the next 2–4 years.
Geopolitical Impact Analysis
Escalating geopolitical tensions are exerting direct cost and lead‑time pressure across the robotic pool cleaner value chain, particularly for motors, PCBs, sensors, and high‑grade plastics that are heavily embedded in US–China and EU–Asia trade flows. WTO documentation shows that additional US tariff measures on Chinese-origin goods include a 10% surcharge on a broad basket of industrial products, with sector analyses indicating tariff bands of 10–40% now common on electronics and related components.
In 2025, tariffs on rigid and flex PCBs from China typically range from 25–30%, while semiconductor tariffs have climbed to 50%, pushing up BOM-level electronics costs for downstream consumer durables by well over 8–12% once logistics, insurance, and compliance overheads are factored in.
For robotic pool cleaners, which often allocate 30–40% of ex‑works value to electronics and control systems, these measures translate into mid‑single to low‑double‑digit factory‑gate price inflation unless OEMs shift sourcing or redesign around alternative components.
UNCTAD’s 2024 rapid assessment of Red Sea, Black Sea, and Panama Canal disruptions notes that container shipping capacity on affected corridors has been redeployed, contributing to global trade shrinkage risks of up to -1.5% in 2025 and lengthening transit times by 7–10 days on Asia–Europe and Asia–US East Coast routes due to rerouting around the Cape of Good Hope.
This delay profile is forcing pool equipment brands to carry 10–20% higher safety stock for seasonal demand, increasing working capital requirements and warehouse costs per unit. At the same time, IEA data show benchmark Brent crude trading around 73 USD/bbl in late 2024 with daily price movements near 0.87 USD/bbl, feeding rapid cost pass‑through into ethylene and propylene chains that underpin polyethylene, polypropylene, PET, and PVC pricing.
Given that plastics and elastomers can represent 35–50% of material cost in robotic pool cleaners, petrochemical volatility alone is adding 5–9% cost variance quarter‑on‑quarter, complicating contract pricing and margin management for OEMs and distributors.
Regional Analysis
North America is the dominant region in the global robotic pool cleaner market, holding an estimated 36.7% share and generating around USD 459.37 million in market value. This leadership is underpinned by structurally high swimming pool penetration, especially in the U.S., where the broader automatic/robotic pool cleaning segment already commands more than 44% of global revenues due to extensive residential pool ownership and a strong preference for automation.
Rising labor costs and increasing shortages of skilled pool maintenance technicians in key states such as California, Florida, and Texas are accelerating the shift from manual and service-based cleaning toward robotic systems, as households seek to reduce recurring service expenses and ensure consistent pool hygiene.
Health and hygiene awareness, strengthened by post-pandemic consumer behavior, is further driving uptake of robotic cleaners thanks to their ability to maintain water quality more consistently than traditional solutions. On the technology side, increasing penetration of cordless and energy-efficient robotic cleaners, often operating at double-digit CAGR rates through 2033, aligns with regional emphasis on sustainability and reduced operating costs.
Key Regions and Countries
North America
- US
- Canada
Europe
- Germany
- France
- The UK
- Spain
- Italy
- Rest of Europe
North America
- China
- Japan
- South Korea
- India
- Australia
- Rest of APAC
Latin America
- Brazil
- Mexico
- Rest of Latin America
Middle East & Africa
- GCC
- South Africa
- Rest of MEA
Key Players Analysis
Maytronics, Fluidra, and Hayward are the leading Tier-1 players in the robotic pool cleaner market, collectively controlling an estimated 70–75% of global automated cleaner revenues, with Maytronics holding the strongest position and capturing nearly half of residential robotic cleaner volumes.
Maytronics reported FY 2024 revenues of NIS 1,626 million (≈USD 440–450 million), including NIS 1,160 million (≈USD 315–325 million) from residential robotic pool cleaners and NIS 102.5 million (≈USD 28–29 million) from commercial robotic pool cleaners, together accounting for approximately 78% of company sales.
The company maintains around a 48% share in residential robotic pool cleaners and a 44% share in public pools, representing an estimated 45–50% global unit share and 40–45% value share during 2024–2025, despite a 20.9% decline in residential robotic revenues in 2024 and further mid-teens volume declines in 2025.
Fluidra and Hayward remain major Tier-1 competitors, supported by their broader pool equipment portfolios and automation capabilities. Fluidra generated €2,102 million (≈USD 2.3 billion) in 2024 sales, growing 3% year-on-year, with 98% of revenues derived from pool and wellness products, supporting an estimated 10–15% share in the robotic pool cleaner segment.
Hayward reported USD 1,051.6 million in 2024 net sales, up 6% year-on-year, with North America contributing 85% of revenues and gross profit reaching USD 530.8 million, positioning the company as a strong player with an estimated high-single-digit to low-teens market share in robotic cleaners.
The Tier-2 competitive landscape includes iRobot, BWT Holding, Water Tech, Aquatron, Kokido, and emerging Chinese cordless robotic cleaner brands such as Aiper, SMOROBOT, Beatbot, and Wybot, which collectively account for the remaining 25–30% of market value.
iRobot is estimated to hold a mid-single-digit share in pool applications, while leading Chinese cordless brands generate approximately USD 100–200 million in annual revenues and maintain low-single-digit global shares. These emerging players are expanding rapidly through battery-powered designs, smart connectivity, and direct-to-consumer channels, benefiting from the cordless robotic pool cleaner segment’s projected 14–15% CAGR through 2033.
Top Key Players in the Market
- Milagrow HumanTech
- Mariner 3S AG
- Aquatron Robotic Technology
- Hangzhou Gaoyue Technology Co. Ltd
- Maytronics
- Zodiac Pool Systems
- KOKIDO
- Pentair
- iRobot Corporation
- Polaris Inc.
- BTW Holding GmbH
- Hayward Industries, Inc.
Recent Developments
- In January 2026, Maytronics announced a three‑year manufacturing consolidation program targeting a 30–50% reduction in its robotic pool cleaner model range and the launch of a new global platform, supported by a planned retooling of its production lines to concentrate output above 500,000 units annually for private‑pool robots by 2028, as outlined in its second‑half 2025 board report and 2024 annual financial filing.
- In April 2026, Fluidra S.A. disclosed in follow‑up filings to its 2025 strategic alliance that the EUR‑denominated USD 100 million investment for a 27% equity stake in cordless‑robot specialist Aiper would be fully deployed by fiscal 2026, with integration targets including at least 30,000 connected robotic pool cleaners sold via Pooltrackr’s service platform and Zodiac’s dealer network in the United States and European Union during the 2026 swimming season.
Report Scope
| Report Features | Description |
|---|---|
| Market Value (2025) | USD 1,251.7 Million |
| Forecast Revenue (2035) | USD 4,763.9 Million |
| CAGR (2026-2035) | 14.3% |
| Base Year for Estimation | 2025 |
| Historic Period | 2020-2024 |
| Forecast Period | 2026-2035 |
| Report Coverage | Revenue Forecast, Market Dynamics, Competitive Landscape, Recent Developments |
| Segments Covered | By Type (In-ground Pool Cleaners, Above-ground Pool Cleaners), By Cleaning Type (Single Surface Cleaning, Multi-Surface Cleaning), By End-User (Residential, Commercial), By Distribution Channel (Online, Offline) |
| Regional Analysis | North America – US, Canada; Europe – Germany, France, The UK, Spain, Italy, Rest of Europe; North America – China, Japan, South Korea, India, Australia, Singapore, Rest of APAC; Latin America – Brazil, Mexico, Rest of Latin America; Middle East & Africa – GCC, South Africa, Rest of MEA |
| Competitive Landscape | Milagrow HumanTech, Mariner 3S, AG Aquatron Robotic Technology, Hangzhou Gaoyue Technology Co. Ltd, Maytronics, Zodiac Pool Systems, KOKIDO, Pentair, iRobot Corporation, Polaris Inc., BTW Holding GmbH, Hayward Industries, Inc. |
| Customization Scope | Customization for segments, region/country-level will be provided. Additional customization can be done based on requirements. |
| Purchase Options | We have three licenses to opt for: Single User License, Multi-User License (Up to 5 Users), Corporate Use License (Unlimited Users and Printable PDF) |





























