


Quick Navigation
Report Overview
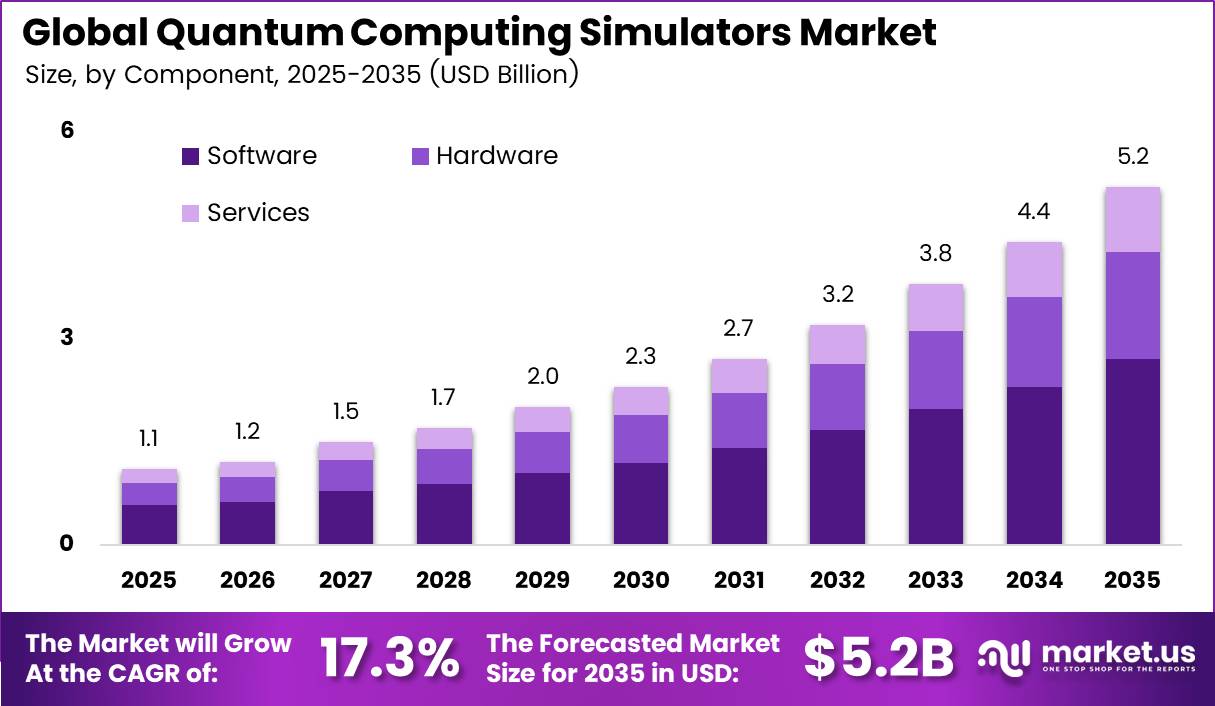
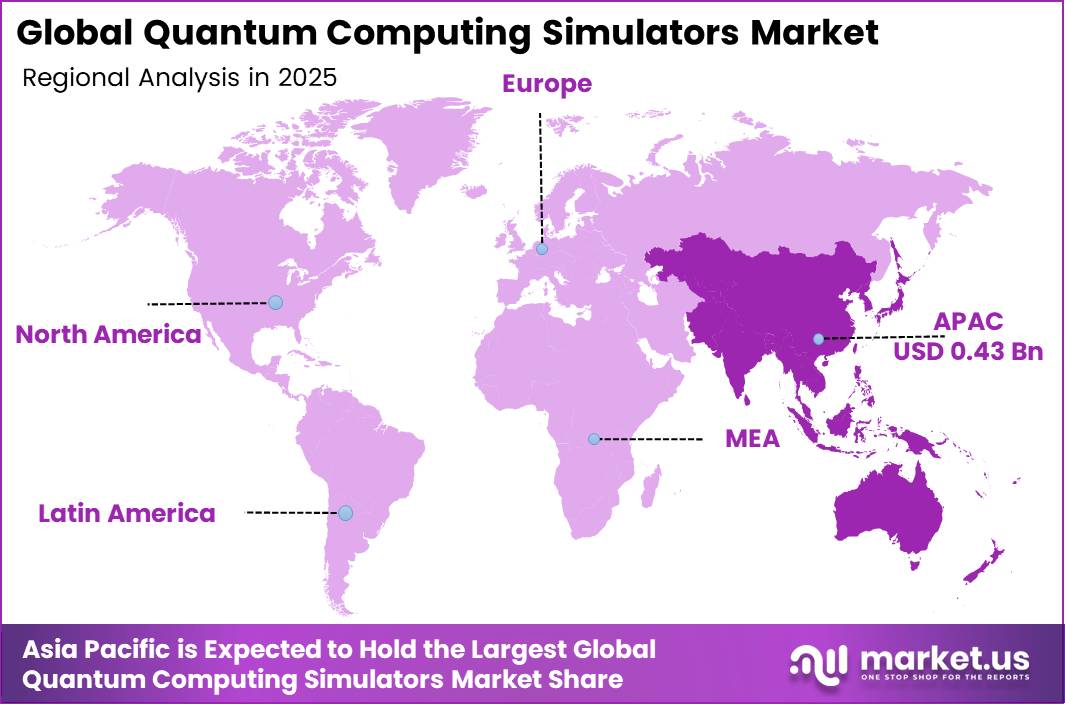
In 2025, the Global Quantum Computing Simulators Market was valued at USD 1.1 billion. The market is projected to grow at a CAGR of 17.3% during 2026–2035, reaching approximately USD 5.2 billion by 2035. Asia Pacific dominated the global market in 2025, accounting for more than 42.1% of the total market share and generating approximately USD 0.43 billion in revenue.
Corporate spending adds further weight, as IBM confirmed it booked 1 billion dollars in cumulative quantum-related revenue, much of it tied to its Qiskit simulation platform used by researchers worldwide to build and debug quantum code. As chip makers, pharmaceutical firms, and finance companies race to understand quantum applications, they turn to simulators as a low-cost entry point, which keeps demand strong well before large-scale quantum machines reach commercial maturity.
Asia Pacific supported by heavy state-backed funding across China and Japan. Japan’s government allocated 1.05 trillion yen, near 7.4 billion dollars, toward next-generation chip and quantum computing research, funding that flows into simulation labs at national institutes and universities. China’s National Venture Guidance Fund also placed 121.8 billion yuan, about 17.5 billion dollars, into three regional quantum-focused venture funds that support hardware and software testing infrastructure across the region.
Key Takeaways
- The Quantum Computing Simulators Market stood at USD 1.1 billion in 2025 and will reach USD 5.2 billion by 2035.
- The market grows at a CAGR of 17.3% during the forecast period.
- Software leads the component segment with a 52.6% share.
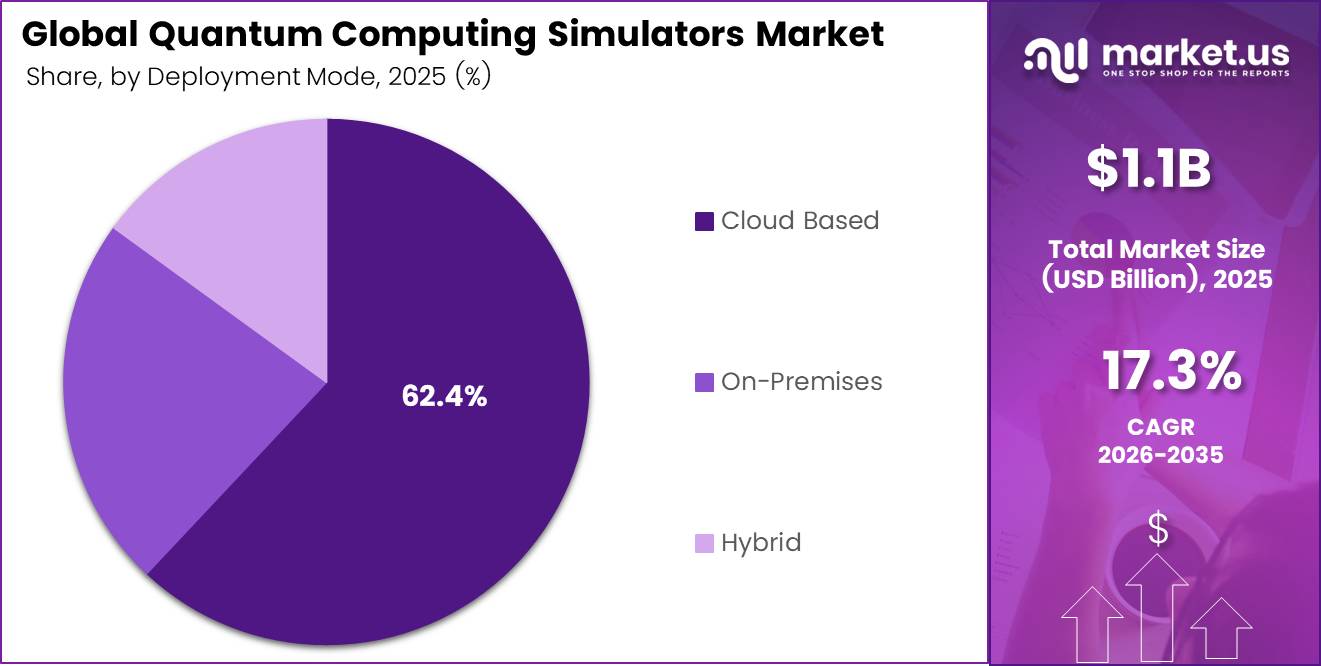
- Cloud-based deployment leads with a 62.4% share.
- Digital Quantum Simulation leads the simulation type segment with a 46.3% share.
- Large Enterprises dominate the organization segment with a 68.8% share.
- Asia Pacific dominates with a 42.1% share, worth USD 0.43 billion.
By Component
Software dominates with 52.6% due to open-source tools driving fast adoption.
Software leads the component segment because open platforms let researchers and companies write and test quantum programs without buying costly machines. IBM’s Qiskit toolkit shows this trend clearly, with over 500,000 downloads and more than 450,000 registered users worldwide, proving how widely coders rely on simulator software to build and test quantum circuits.
The U.S. Department of Energy is funding five national laboratories, including Argonne and Oak Ridge, with 625 million dollars over five years to build new quantum information science centers, which will need matching simulator software and testing systems. This funding push will speed up software upgrades tied to new hardware testbeds, keeping the software segment strong while pulling hardware simulation into faster growth over the next few years.
By Deployment Mode
Cloud-based dominates with 62.4% due to low upfront hardware cost and access.
Cloud-based deployment leads because it lets firms rent simulator time instead of buying costly quantum lab equipment. Eurostat data shows that 45.2% of European Union businesses already bought cloud computing services in 2023, mostly for software tools, file storage, and computing power, confirming how normal cloud buying has become across industries.
On-premises setups lag because they demand heavy capital spending and constant maintenance staff, which only large research labs can justify. Hybrid deployment sits in the middle, mixing local control with outside computing power for sensitive projects. Growth ahead points toward hybrid models expanding quickly as firms want both privacy and flexible scaling.
The European Union has set a Digital Decade goal for more than 75% of companies to use cloud, big data, or artificial intelligence tools by 2030, a target that pushes many firms toward mixed cloud and on-site systems to meet compliance needs while cutting costs. This policy pressure will pull hybrid deployment options into the fastest growth path within the sector.
By Simulation Type
Digital Quantum Simulation dominates with 46.3% due to broad compatibility with classical algorithms.
Digital quantum simulation leads the market because it uses standard logic gates that programmers already understand from classical computing training. The U.S. National Science Foundation reported a major 2025 milestone where research teams built and controlled 6,100 neutral-atom quantum bits using laser trapping, a scale that shows how far digital-style control methods have advanced for practical testing.
Hybrid or approximate simulation blends both approaches and is now the fastest-growing type because it balances accuracy with speed. Scientific groups report that leading analog platforms using neutral atoms already control more than 1,000 particles at once, giving hybrid methods a strong technical base to build faster, cheaper approximate models for messy real-world problems.
By Organization
Large Enterprises dominate with 68.8% due to greater research budgets and staff.
Large enterprises dominate this segment because they can fund long research cycles and hire specialized quantum teams that smaller firms cannot support. The United Kingdom’s quantum sector already employs around 1,700 skilled workers earning an average salary near 50,000 pounds, showing how big organizations concentrate the scarce technical talent needed to run advanced simulators.
The U.S. National Science Foundation’s Regional Innovation Engines program already turned an initial 135 million investment into more than 1 billion in matching private commitments, much of which supports smaller quantum-focused startups and technology partners. As more public grants and shared lab access become available, SMEs will keep closing the gap with larger firms across the sector.
Key Market Segments
By Component
- Software
- Hardware
- Services
By Deployment Mode
- Cloud Based
- On-Premises
- Hybrid
By Simulation Type
- Digital Quantum Simulation
- Analog Quantum Simulation
- Hybrid / Approximate Simulation
By Organization
- Large Enterprises
- Small and Medium Enterprises (SMEs)
Geopolitical Impact Analysis
Trade tensions between the United States and China are reshaping supply chains that feed the quantum computing simulators market. The US Department of Commerce imposed a 25% tariff on advanced AI chips not destined for the US supply chain, effective January 15, 2026, a move that raises landed costs for simulation hardware built on high-performance processors.
China responded by tightening rare earth export rules, now covering 12 of 17 rare earth elements, with license applications taking up to 45 days for approval under the Regulations on the Export Control of Dual-Use Items. These materials feed into control electronics and cryogenic systems used inside hardware-based quantum simulators, so the added review time creates longer lead times for component sourcing.
Export licensing also now demands third-party testing in the United States before certain chips can leave the country, adding compliance costs that flow through to simulator hardware vendors and cloud service providers building physical testbeds. These frictions push more firms toward software-based and cloud-hosted simulation, since virtual platforms avoid the direct customs and licensing delays tied to physical chip shipments.
The World Trade Organization has flagged that export control regimes on advanced computing components are creating fragmented trade patterns, forcing companies to build region-specific supply routes rather than one global chain. For simulator vendors, this means higher costs for physical testbed expansion in cross-border projects, while pure software and cloud simulation offerings remain comparatively insulated from tariff and export control pressure.
Regional Analysis
Asia Pacific
Asia Pacific dominates the Quantum Computing Simulators Market, holding a 42.1% share and generating USD 0.43 billion in revenue. China’s quantum computing sector reached 11.56 billion yuan, close to 1.61 billion dollars, in 2025, with annual growth above 30%, showing how fast the underlying ecosystem for simulation tools is expanding across the country.
North America stands as the fastest-growing region in this market and holds a strong position built on deep corporate investment from firms such as IBM and Google, alongside a 25 percent tariff structure on advanced AI chips that pushes local firms toward software and cloud simulation options to control costs. The region benefits from established research universities and national laboratories that maintain long-running simulation programs tied to federal quantum initiatives.
Europe maintains steady simulator adoption through coordinated national strategies, with Spain committing close to 900 million dollars over its 2025 to 2030 quantum strategy to build domestic research capacity. Germany, France, and the UK support this through university-led quantum computing centers that rely on simulation tools for early-stage algorithm testing before scaling to physical hardware.
Key Regions and Countries
North America
- US
- Canada
Europe
- Germany
- France
- The UK
- Spain
- Italy
- Rest of Europe
Asia Pacific
- China
- Japan
- South Korea
- India
- Australia
- Rest of APAC
Latin America
- Brazil
- Mexico
- Rest of Latin America
Middle East and Africa
- GCC
- South Africa
- Rest of MEA
Market Dynamics
Drivers
| Driver | (~) % Impact on CAGR Forecast | Geographic Relevance | Impact Timeline |
|---|---|---|---|
| Cloud-based simulation access replacing on-premises licensing | +3.1% | North America, Europe | Short term (2 years or less) |
| National quantum R&D budget disbursement to public labs | +2.6% | Asia Pacific, North America | Short term (2 years or less) |
| Enterprise pre-hardware algorithm validation demand | +2.2% | Global | Medium term (2 to 4 years) |
| Open-source SDK ecosystem lowering developer onboarding cost | +1.7% | Global | Short term (2 years or less) |
| Pharma and materials science use-case validation pilots | +1.4% | North America, Europe | Medium term (2 to 4 years) |
Cloud-Based Simulation Access Replacing On-Premises Licensing
The shift from perpetual on-premises simulator licensing toward metered cloud consumption is the single largest active driver because it collapses the capital threshold required for a research team to begin quantum algorithm testing, per national statistical office cloud-adoption tracking, enterprise purchase of paid cloud computing services crossed roughly 45% of surveyed businesses in mature economies by 2025.
Per corporate investor disclosures from major cloud and quantum software providers, this model shift also raises gross margins on simulation software from the 60% to 70% range typical of on-premises support contracts toward figures closer to 80% under recurring cloud delivery, since incremental compute allocation avoids the fixed cost of dedicated customer-site hardware.
Restraints
| Restraint | (~) % Impact on CAGR Forecast | Geographic Relevance | Impact Timeline |
|---|---|---|---|
| Export control licensing delays on advanced computing components | -2.4% | North America, Asia Pacific | Short term (2 years or less) |
| High interest rate environment restricting startup capital access | -1.8% | Global | Short term (2 years or less) |
| Elevated tariff rates on advanced computing hardware imports | -1.5% | North America | Short term (2 years or less) |
| Rare earth and specialty material export restriction | -1.1% | Global | Short term (2 years or less) |
Export Control Licensing Delays on Advanced Computing Components
Export control licensing delay stands as the most immediate restraint because it directly freezes hardware-based simulator shipments rather than merely slowing their growth ceiling, with the root cause tracing to expanded advanced computing export licensing regimes enacted by national commerce and trade authorities through late 2025 and into 2026.
This delay creates a quantitative bottleneck for vendors building physical simulation testbeds, since per industry trade association shipment tracking, component lead times for specialized control electronics have lengthened by an estimated 20% to 30% against pre-restriction baselines, forcing hardware-linked simulator vendors to hold larger safety stock or defer testbed installation milestones.
The strategic business impact shows up as margin compression on hardware-integrated simulation contracts, where, per corporate earnings call disclosures from affected component suppliers, gross margins on export-controlled hardware lines have compressed by an estimated 3 to 5 percentage points, while CapEx-heavy customers delay multi-year lab expansion commitments until licensing certainty improves.
Challenges
| Challenge | (~) % CAGR Friction Drag | Geographic Relevance | Mitigation Horizon |
|---|---|---|---|
| Quantum software talent shortage | -1.6% | Global | Medium term (2 to 4 years) |
| Simulator scaling compute cost ceiling | -1.3% | Global | Long term (4 years or more) |
| Fragmented simulator interoperability standards | -0.9% | North America, Europe | Medium term (2 to 4 years) |
| SME onboarding and training resource gap | -0.7% | Global | Medium term (2 to 4 years) |
Quantum Software Talent Shortage
Quantum software talent shortage represents the most persistent structural friction because it caps vendor onboarding velocity without freezing existing contracts, rooted in a global skills mismatch that a national quantum skills taskforce report flagged when projecting global demand for quantum scientists and engineers to exceed 1 million professionals against a supply base numbering only in the tens of thousands as of 2025.
Per that same institutional workforce assessment, the domestic quantum sector in one leading market employed close to 1,700 specialists at an average compensation near £50,000 annually, a wage level that intensifies competition for scarce simulation software engineers against better-funded classical software and AI employers.
This talent bottleneck translates into a quantifiable friction drag because, according to industry trade association hiring-time benchmarks, average time-to-fill for quantum simulation engineering roles now runs 30% to 40% longer than comparable classical software roles, delaying feature rollout cycles and customer implementation support.
Opportunities
| Opportunity | (~) % Potential CAGR Upside | Geographic Relevance | Execution Window |
|---|---|---|---|
| SME-tailored simulation-as-a-service tiered monetization | +2.3% | Global | Medium term (2 to 4 years) |
| Hybrid classical-quantum workflow integration into enterprise IT stacks | +1.9% | North America, Europe | Medium term (2 to 4 years) |
| Financial services risk-modeling adjacent vertical expansion | +1.5% | North America, Asia Pacific | Long term (4 years or more) |
| Simulation vendor consolidation through targeted acquisition roll-ups | +1.2% | Global | Long term (4 years or more) |
SME-Tailored Simulation-as-a-Service Tiered Monetization
SME-tailored tiered monetization represents genuine untapped white space rather than an active driver because current simulator commercialization remains concentrated on large enterprise and national lab contracts, leaving a meaningful share of the addressable smaller-business segment unserved by usage-based pricing designed for their scale.
Per corporate SaaS investor-deck benchmarking from adjacent cloud software categories, tiered pricing models introduced for smaller customer segments have historically lifted blended gross margins by 4 to 6 percentage points through higher-volume, lower-touch delivery, while customer acquisition cost per SME account can fall by an estimated 25% to 35% versus enterprise-sales-led motions.
Key Players Analysis
Tier 1 market leaders include IBM, Google Quantum, Microsoft, and Amazon, each backed by deep corporate balance sheets and cloud infrastructure. IBM has generated cumulative revenue exceeding 1 billion dollars from its quantum business through its Qiskit simulation and hardware platform, forming the backbone of its broader quantum growth strategy.
Google walked away from a 2.013 billion dollar federal quantum funding initiative in June 2026 because the deal required a government equity stake, showing the company’s confidence in self-funding its own simulation and hardware research rather than accepting outside conditions.
Honeywell backs Quantinuum through an approximately 600 million capital raise completed in 2025 at a pre-money valuation of 10 billion dollars, giving the challenger firm resources to expand its Helios simulation and hardware access platform through partners like Oracle Cloud Infrastructure.
Tier 2 challengers include Xanadu Quantum Technologies, Atos, Infleqtion, SpinQ, and Intel, each holding strong niche or regional positions. SpinQ, a China-based superconducting quantum firm, closed a Series C+ round worth roughly 87 million dollars in April 2026, part of nearly 145 million dollars raised across its Series C rounds in three months, funding that supports its simulation software tools alongside desktop hardware sales.
IonQ, expanding its footprint through acquisitions, agreed to buy SkyWater Technology in a deal valued near 1.8 billion dollars in January 2026, a move meant to build a vertically integrated quantum platform spanning chips through simulation software. These moves show challenger firms using targeted capital raises and acquisitions to close the gap with larger, cloud-native competitors.
Top Key Players in the Market
- IBM
- Google Quantum
- Microsoft
- Amazon
- SpinQ
- Quantinuum
- Xanadu Quantum Technologies
- Atos
- Honeywell
- Infleqtion
- Intel
Recent Developments
- In July 2026, IBM committed more than USD 10 billion over 5 years for quantum research, capital expenditure, manufacturing scale-up, ecosystem partnerships, and acquisitions, supporting its planned fault-tolerant quantum computing roadmap for 2029.
- In July 2026, IonQ completed its acquisition of SkyWater Technology, following a cash-and-stock agreement valued at approximately USD 1.8 billion and priced at USD 35.00 per SkyWater share, creating a vertically integrated quantum platform spanning chip fabrication and quantum systems.
- In September 2025, Honeywell announced an approximately USD 600 million equity capital raise for Quantinuum at a pre-money equity valuation of USD 10 billion, providing funding to advance its quantum computing hardware, software, and hybrid quantum-AI service plans.
- In November 2025, Microsoft expanded its Quantum Lab in Lyngby, Denmark, bringing its total quantum investment in the country above DKK 1 billion and establishing the site as its largest quantum facility globally.
Report Scope
| Report Features | Description |
|---|---|
| Market Value (2025) | USD 1.1 billion |
| Forecast Revenue (2035) | USD 5.2 billion |
| CAGR (2026-2035) | 17.3% |
| Base Year for Estimation | 2025 |
| Historic Period | 2020-2024 |
| Forecast Period | 2026-2035 |
| Report Coverage | Revenue Forecast, Market Dynamics, Competitive Landscape, Recent Developments |
| Segments Covered | By Component (Software, Hardware, Services); By Deployment Mode (Cloud-Based, On-Premises, Hybrid); By Simulation Type (Digital Quantum Simulation, Analog Quantum Simulation, Hybrid / Approximate Simulation); By Organization (Large Enterprises, Small and Medium Enterprises (SMEs)) |
| Regional Analysis | North America – US, Canada; Europe – Germany, France, The UK, Spain, Italy, Rest of Europe; Asia Pacific – China, Japan, South Korea, India, Australia, Singapore, Rest of APAC; Latin America – Brazil, Mexico, Rest of Latin America; Middle East & Africa – GCC, South Africa, Rest of MEA |
| Competitive Landscape | IBM, Google Quantum, Microsoft, Amazon, SpinQ, Quantinuum, Xanadu Quantum Technologies, Atos, Honeywell, Infleqtion, Intel |
| Customization Scope | Customization for segments and region/country-level will be provided. Moreover, additional customization can be done based on the requirements. |
| Purchase Options | We have three licenses to opt for: Single User License, Multi-User License (Up to 5 Users), Corporate Use License (Unlimited Users and Printable PDF) |





























