


Report Overview
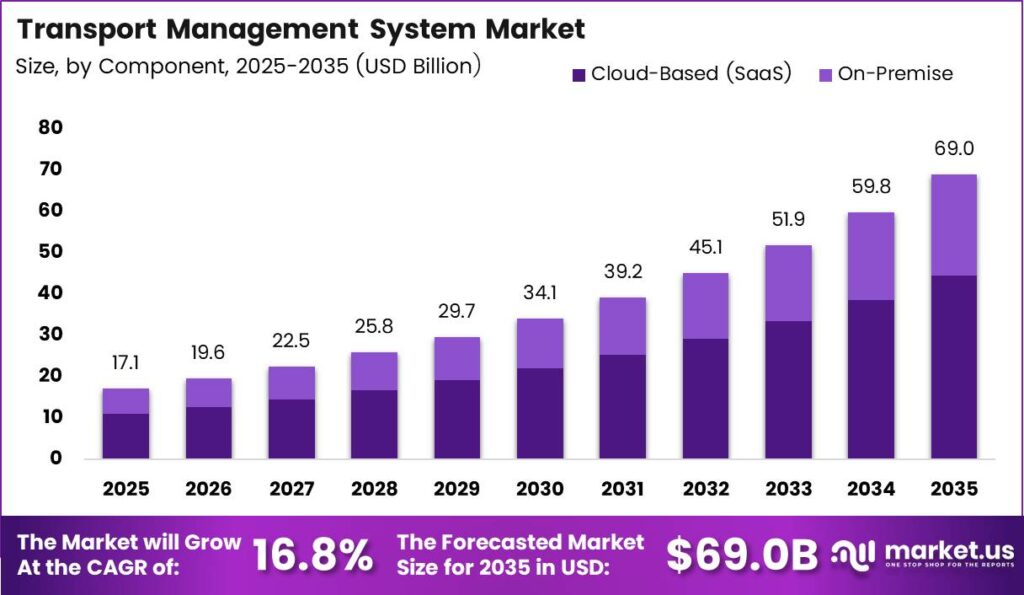
In 2025, the Global Transport Management System Market was valued at US$17.1 billion, and between 2026 and 2035, this market is estimated to register a CAGR of 16.8%, reaching about US$69.0 billion by 2035. North America held a dominant Market position, capturing more than a 36.2% share, holding USD 1.1 Billion revenue.
A Transportation Management System (TMS) refers to a digital solution used by organizations in planning and managing movements of goods through intricate transportation networks. The system serves as the core of supply chains, creating a link between shippers, carriers, and other logistics partners. The demand is global and spurred by increasing complexity in supply chains, globalization of commerce, and exponential growth in e-commerce activities.
According to the World Trade Organization, the global number of parcels shipped has reached more than 32 billion in 2024. The World Economic Forum notes that most businesses face visibility gaps and fragmented carriers as major challenges; challenges that are effectively solved by cloud-based TMS platforms. Gartner surveys indicate that AI-enabled TMS systems increase on-time deliveries and decrease freight errors, while according to the International Labour Organization, automation in logistics including TMS transforms workforce structures in over 90 countries.
Key Takeaways
- The global Transportation Management System (TMS) market was valued at US$17.1 billion in 2025.
- The global Transportation Management System (TMS) market is projected to grow at a CAGR of 16.8% and is estimated to reach US$69.0 billion by 2035.
- On the basis of component, software / solutions dominated the market, constituting 70.2% of the total market share.
- Based on deployment mode, cloud-based (SaaS) solutions dominated the market, accounting for 64.5% of the total market share, while on-premise accounted for 35.5%.
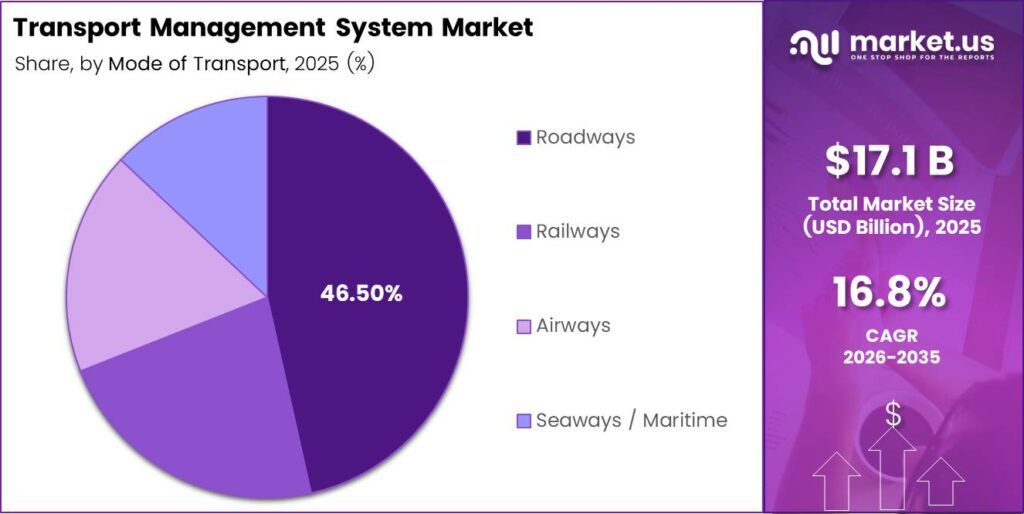
- Based on mode of transportation, roadways dominated the TMS market, with a major share of 46.5% of the total market.
- Among the end-user industries, shippers (beneficial cargo owners) held a major share in the TMS market, accounting for 34% of the total market.
- Among enterprise sizes, large enterprises dominated the market with a 65% share.
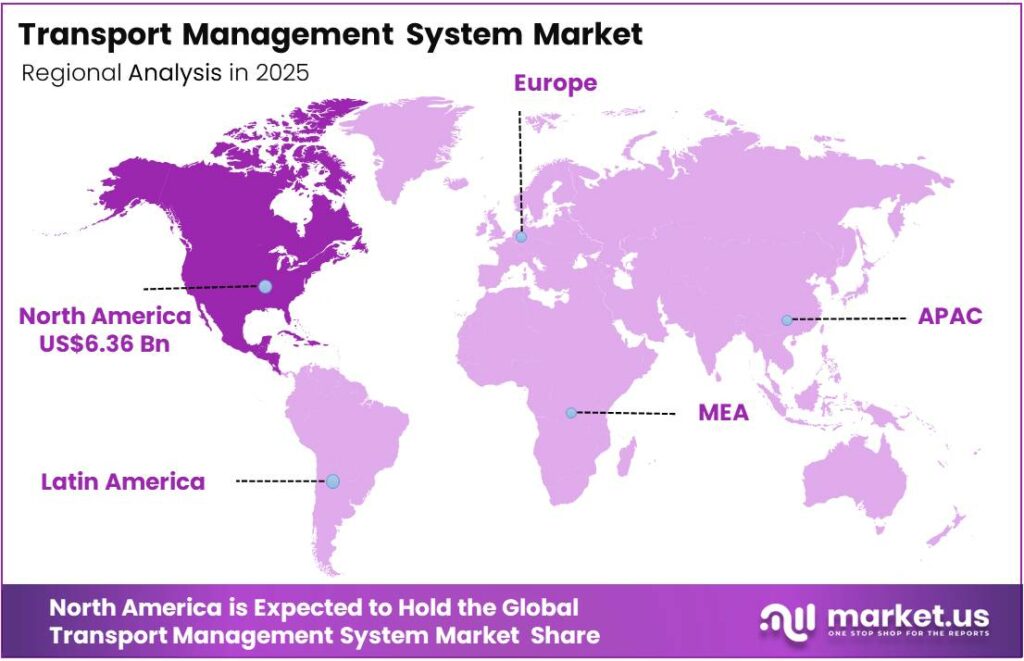
- In 2025, North America was the most dominant region in the TMS market, accounting for 37.2% of the total global consumption.
Component Analysis
The Software / Solutions segment dominates the TMS market
The Software / Solutions segment dominates the TMS market with 70.20%, driven by the shift toward digital, automated supply chain management. Planning & Execution leads with 28.00%, followed by Order Management (18.50%), Audit, Payment & Claims (10.50%), Analytics & Reporting (8.50%), and Others (4.70%). This dominance is supported by global logistics digitalization, with the World Bank’s Logistics Performance Index reporting up to 70% reductions in delays through end-to-end supply chain digitization. Over 70% of large enterprises in North America and Europe have adopted TMS platforms for optimization, ERP/WMS integration, and real-time visibility.
The Services segment accounts for 29.80%, with Managed Services (8.80%) emerging as the fastest-growing sub-segment. Growth is driven by rising complexity in TMS operations, skills gaps, and increasing reliance on external expertise. KPMG notes that nearly 50% of firms prioritize managed services, while over 75% already use them in at least one function. This shift reflects growing demand for continuous optimization, carrier management, and SLA-based outsourced logistics operations.
Deployment Mode Analysis
Cloud-Based (SaaS) – A Significant Deployment Mode
Cloud-based TMS platforms account for 64.5% of deployments, mainly because they are cheaper, faster to implement, and easier to scale. Instead of heavy upfront spending on IT systems, companies use a subscription model, which makes advanced logistics tools accessible even to smaller operators.
The OECD Digital Economy Outlook 2024 highlights that cloud adoption improves efficiency and resilience by connecting different digital systems more effectively. Implementation is also much quicker, often taking weeks compared to 6 to 18 months for traditional on-premise setups. The World Bank’s Logistics Performance Index 2023 further shows that digital tools improve real-time shipment tracking and reduce delays across supply chains.
Cloud systems also integrate smoothly with ERP and WMS platforms through APIs, helping companies cut logistics costs by up to 15% and improve service levels by up to 65%. Around 40% of logistics firms now use cloud computing, with 52% reporting stronger resilience and 26% better forecasting accuracy.
Within this space, hybrid cloud is growing the fastest. It is being adopted because companies want a balance between flexibility and control, keeping sensitive data secure in private systems while using the public cloud for scaling and day-to-day logistics operations, especially in complex cross-border supply chains.
Mode of Transportation Analysis
Roadways are the Most Widely Used mode of transportation
Roadways remain the dominant transportation mode in TMS usage, accounting for 46.50% share due to their essential role in first-mile and last-mile delivery. A 2025 International Transport Forum report shows that in 21 of 25 countries, the share of road freight increased over 2014–2024, reflecting how strongly logistics networks continue to depend on trucking.
In 2025, global parcel volumes were estimated at nearly 200 billion shipments, with last-mile delivery contributing around 40–60% of total logistics costs. This cost pressure has led companies to rely heavily on TMS tools for route optimization, scheduling, and real-time tracking, especially in fragmented road networks with multiple carriers and frequent short-haul movements.
Airways are emerging as the fastest-growing mode, supported by a 3.4% year-on-year rise in global air cargo demand in 2025, with Asia-Pacific growth reaching 8.4%. Air cargo volumes remained at record levels for eight consecutive months in 2025, driven by e-commerce growth, high-value goods, and increasing shifts from sea to air due to reliability concerns in maritime shipping.
The need for faster cross-border deliveries has increased adoption of TMS capabilities for air freight planning, customs coordination, and real-time shipment visibility. Growing use of digital air cargo platforms and automated customs processes is further improving coordination and making air logistics more integrated within modern TMS ecosystems.
Enterprise Size Analysis
Large enterprises dominate TMS adoption
Large enterprises dominate TMS adoption with a 65% share, driven by high supply chain complexity across multi-node, cross-border, and multi-carrier logistics networks. Adoption is strongest in manufacturing, which accounts for over one-third of deployments, reflecting the link between operational scale and TMS usage.
ERP integration is a key driver, as large firms already operate systems like SAP and Oracle, enabling seamless data flow across transportation and enterprise functions. Additionally, over 70% of Fortune 500 shippers use TMS modules for freight management, while 68% of logistics providers adopt cloud-enabled TMS for real-time visibility and analytics. Regulatory compliance, customs coordination, and global trade complexity further reinforce demand for automated exception handling.
Small enterprises account for the remaining share, facing barriers such as 27% reporting skill shortages and 43% citing lack of training time (OECD). Limited ERP adoption and constrained resources slow implementation, although cloud-based TMS solutions are gradually improving accessibility and long-term adoption potential.
End User Industry Analysis
Shippers (beneficial cargo owners) are Mostly Utilized in the End User Industry
Shippers (beneficial cargo owners) lead TMS adoption with a 34% share because they directly manage freight costs, delivery performance, and customer expectations across increasingly complex supply chains. As e-commerce volumes and real-time visibility requirements continue to rise, shippers rely heavily on TMS platforms to improve routing, shipment tracking, carrier coordination, and cost efficiency across multi-modal networks.
Freight brokers and forwarders account for 28.5% of the market, where TMS platforms have become essential for digital freight matching, shipment consolidation, and automated coordination between carriers and customers. Meanwhile, 3PL and 4PL providers represent 26.0% share, using TMS as the operational backbone for outsourced logistics management and end-to-end transportation visibility. Together, these three segments contribute nearly 90% of total TMS end-user adoption, highlighting how transportation digitization is increasingly driven by operational efficiency, real-time coordination, and supply chain visibility requirements across the logistics ecosystem.
Key Market Segments
By Component
- Software / Solutions
- Planning and Execution
- Order Management
- Audit, Payment and Claims
- Analytics & Reporting
- Others
- Services
- Professional Services
- Implementation & Integration Services
- Consulting & Advisory Services
- Support & Maintenance Services
- Managed Services
- Professional Services
By Deployment Mode
- Cloud-Based (SaaS)
- Public Cloud
- Private Cloud
- Hybrid Cloud
- On-Premise
By Mode of Transportation
- Roadways
- Railways
- Airways
- Seaways / Maritime
By End-User Industry
- Shippers (Beneficial Cargo Owners)
- Freight Brokers & Forwarders
- 3PL / 4PL Providers
- Others
By Enterprise Size
- Large Enterprises
- Small Enterprises
Market Drivers
| Driver | (~) % Impact on CAGR Forecast | Geographic Relevance | Impact Timeline |
|---|---|---|---|
| E-commerce network complexity | +3.8% | Global | Short term (≤ 2 years) |
| Real-time shipment visibility demand | +2.7% | North America, Europe, Asia-Pacific | Short term (≤ 2 years) |
| AI-led routing and load optimization | +2.2% | North America, Europe, East Asia | Medium term (2–4 years) |
| Cross-border trade compliance digitization | +1.6% | Europe, Asia-Pacific, North America | Medium term (2–4 years) |
| Freight-cost containment mandates | +1.1% | Global | Short term (≤ 2 years) |
| Carbon reporting and route efficiency | +0.7% | Europe, North America, East Asia | Medium term (2–4 years) |
E-commerce network complexity
Rapid e-commerce and omnichannel fulfilment growth is increasing shipment volumes, carrier choices, delivery-frequency requirements and last-mile exceptions, making manual freight planning progressively less viable for retailers, manufacturers and third-party logistics providers. During 2024 and 2025, the commercial priority moved beyond point-to-point freight execution toward continuous orchestration across parcel, less-than-truckload, full-truckload, cross-border and returns flows; this has shifted TMS procurement from perpetual deployment projects to cloud-based, transaction-linked operating platforms.
Centralized carrier allocation, automated tendering and exception management can reduce manual planning effort by an estimated 25–40%, improve loaded-mile utilization by roughly 5–12% and shorten dispatch decision cycles from hours to minutes, supporting recurring software revenue, stronger customer retention and an estimated +3.8% incremental contribution to the 16.8% baseline CAGR.
Market Restraints
| Restraint | (~) % Impact on CAGR Forecast | Geographic Relevance | Impact Timeline |
|---|---|---|---|
| Legacy-system integration cost barriers | -2.1% | Global | Short term (≤ 2 years) |
| Small-enterprise budget constraints | -1.4% | Latin America, Africa, South Asia | Short term (≤ 2 years) |
| Data-residency procurement restrictions | -0.9% | Europe, Middle East, Asia-Pacific | Short term (≤ 2 years) |
| Lengthy enterprise buying cycles | -0.7% | North America, Europe, East Asia | Medium term (2–4 years) |
| Carrier API access limitations | -0.5% | Global | Short term (≤ 2 years) |
Legacy-system integration cost barriers
Immediate adoption is constrained when prospective users operate fragmented enterprise-resource-planning, warehouse-management, carrier, customs and finance systems that lack standardized interfaces or reliable master data. A TMS deployment often requires middleware, historical-data cleansing, process redesign and validation across several business units before freight execution can be transferred from legacy workflows; complex implementations can extend from an initial 3–6 month expectation to approximately 9–15 months, with integration and change-management work consuming an estimated 35–50% of first-year programme expenditure. This creates a hard budget and approval barrier for smaller and mid-sized shippers, defers implementation revenue, elevates vendor delivery costs and can compress project gross margins by roughly 200–400 basis points, resulting in an estimated -2.1% deduction from the 16.8% baseline CAGR.
Market Challenges
| Challenge | (~) % CAGR Friction Drag | Geographic Relevance | Mitigation Horizon |
|---|---|---|---|
| Carrier data standardization fragmentation | -1.3% | Global | Medium term (2–4 years) |
| Cybersecurity exposure across integrations | -1.0% | Global | Long term (≥ 4 years) |
| AI model accuracy drift | -0.8% | North America, Europe, East Asia | Medium term (2–4 years) |
| Logistics analytics talent scarcity | -0.6% | North America, Europe, Asia-Pacific | Long term (≥ 4 years) |
| Geopolitical route disruption volatility | -0.5% | Europe, Middle East, Asia-Pacific | Medium term (2–4 years) |
Carrier data standardization fragmentation
Global freight networks continue to use inconsistent carrier status codes, shipment identifiers, proof-of-delivery formats, surcharge definitions and application-programming interfaces, limiting the quality of real-time visibility and optimization even after a TMS is deployed. The structural vulnerability is greatest where a shipper manages hundreds of regional carriers, brokers and subcontractors: mapping and cleansing a new carrier feed can require an estimated 2–8 weeks, while incomplete milestone data can lower automated exception-detection coverage by roughly 15–30%.
Providers must therefore maintain carrier-connector libraries, invest in data-normalization layers, publish shared event standards and embed automated quality controls; these recurring measures preserve service performance but raise implementation and support costs, constraining scalability and imposing an estimated -1.3% friction drag on the market’s maximum growth potential.
Market Opportunities
| Opportunity | (~) % Potential CAGR Upside | Geographic Relevance | Execution Window |
|---|---|---|---|
| Autonomous freight procurement marketplaces | +2.0% | North America, Europe, Asia-Pacific | Medium term (2–4 years) |
| Embedded carbon-intelligence subscriptions | +1.3% | Europe, North America, East Asia | Medium term (2–4 years) |
| Small-carrier mobile workflow platforms | +1.0% | South Asia, Africa, Latin America | Medium term (2–4 years) |
| Multimodal control-tower consolidation | +0.8% | Global | Long term (≥ 4 years) |
| Digital freight audit services | +0.5% | North America, Europe, Asia-Pacific | Medium term (2–4 years) |
Autonomous freight procurement marketplaces
Autonomous freight-procurement marketplaces remain an unexploited opportunity rather than a current driver because most deployed TMS platforms still optimize within pre-negotiated carrier networks and rely on human oversight for complex tendering, carrier qualification and exception-based re-awards. A deliberately built marketplace layer can combine verified capacity, contractual constraints, service history and lane-level forecasting to automate a larger share of spot and mini-bid procurement.
Raising automated tender acceptance from an estimated 40–60% to 65–80% on eligible lanes could reduce planner touches by roughly 30–45%, lower cost-to-serve per shipment by approximately 10–18% and create transaction, financing and premium analytics revenue beyond core subscription fees. At scale, this higher-margin network model could improve blended gross margin by an estimated 300–500 basis points and add a potential +2.0% above the 16.8% baseline CAGR, provided providers invest in carrier onboarding, trust controls and auditable automated-award rules.
Geopolitical Impact Analysis
Converging Geopolitical Shocks: Tariffs, Active Conflicts, and the Structural Reshaping of TMS Demand
In 2026, global logistics will face transformational changes due to three simultaneous disruptions — tariffs imposed by the United States, the Russia-Ukraine conflict, and the problems faced by maritime traffic across the Red Sea — necessitating that TMS become critical infrastructures instead of merely useful systems.
Changes in tariffs in 2025 have brought about significant consequences in trade movements. In particular, 82% of respondents from McKinsey & Company reported being affected by tariff changes in their operations, while there was a reduction in US-China trade movement by roughly 30%. The total trade movement has shifted by an estimated amount of $165 billion. Of all companies interviewed by the consulting company, 43% have decided to increase operations in the US, 38% intend to reduce their operations in China.
The Russia-Ukraine war is still affecting logistics and energy infrastructure, resulting in a loss of access to around 120 million tons of Black Sea shipments per year as well as reducing Ukraine’s economy to 21% lower than its pre-war state ($210 billion in 2025). EU dependence on Russian energy sources (35% gas, 20% oil, and 40% coal prior to the war) has further inflated costs.
On the other hand, the Red Sea situation has led to over 190 attacks against ships, which have been obliged to use the alternative Cape of Good Hope route, decreasing capacity by 9% and increasing costs of Asian-European maritime routes by 25%–40% (even up to 200%–400% during peak times).
Regional Analysis
North America Held the Largest Share of the TMS Market
North America accounts for 37.20% of the global TMS market, driven by advanced logistics infrastructure, strong cloud adoption, and a mature e-commerce ecosystem. The region benefits from widespread use of AI-enabled routing, real-time tracking, and integrated ERP/WMS systems across large 3PL and freight networks. In 2024, the US freight system moved around 54.8 million tons of goods daily, supporting strong demand for advanced TMS platforms.
Asia Pacific is the fastest-growing region, supported by expanding manufacturing activity, rising e-commerce volumes, and growing cross-border trade. According to UNCTAD, East Asia recorded 9% export growth and 10% intra-regional trade growth in 2025. With maritime transport handling over 80% of global trade by volume, increasing investments in smart ports, freight corridors, and logistics digitization across China, India, and Southeast Asia are accelerating adoption of cloud-based and AI-enabled TMS solutions.
Key Regions and Countries Covered in this Report
North America
- The US
- Canada
Europe
- Germany
- France
- The UK
- Spain
- Italy
- Russia & CIS
- Rest of Europe
APAC
- China
- Japan
- South Korea
- India
- ASEAN
- Rest of APAC
Latin America
- Brazil
- Mexico
- Rest of Latin America
Middle East & Africa
- GCC
- South Africa
- Rest of MEA
The areas of emphasis for TMS providers include reinforcing their technology, ecosystem and globalization efforts. First, an important aspect in maintaining competitive edge is AI advancement by developing new AI-powered agents, agentic automation and multimodal visibility capabilities that will ensure efficiency and better logistics optimization. Another area of significant investment for firms includes developing native cloud-based SaaS solutions as it provides the benefits of product continuity and increased scalability for both mid-market and enterprise level shippers.
The vertical integration with ERP systems, WMS and even carrier networks ensures that the continuity and orchestration of supply chain are ensured. Through active mergers and acquisitions, firms can fast-track capability expansion and geographical presence. Investments in the Asia-Pacific region are made in order to align vendors to the needs in e-commerce and electric vehicle logistics. Moreover, manufacturers ensure IP protection by building proprietary models, automation and long-term supplier relationships with logistics carriers.
The following are some of the major players in the industry:
- Oracle Corporation
- SAP SE
- C.H. Robinson (Navisphere)
- Manhattan Associates
- Blue Yonder (JDA)
- Trimble Inc. (TMW Systems)
- WiseTech Global (CargoWise)
- Descartes Systems Group
- E2open
- Körber AG
- Infor (Nexus)
- Alpega Group
- Generix Group
- MercuryGate International
- Uber Freight
- Other Key Players
Key Development
- In April 2026, Oracle Corporation expanded its Oracle Fusion Cloud Logistics platform with new AI agents and predictive logistics automation capabilities, enabling real-time shipment orchestration, automated exception management, and intelligent transportation planning across multimodal supply chains.
- In March 2026, Descartes Systems Group launched AI-powered enhancements within its MacroPoint freight visibility platform, introducing autonomous freight monitoring, predictive ETA intelligence, and automated carrier communication tools designed to improve real-time transportation visibility and reduce manual logistics coordination.
Report Scope
| Report Features | Description |
|---|---|
| Market Value (2025) | US$17.1 Bn |
| Forecast Revenue (2035) | US$69.0 Bn |
| CAGR (2026–2035) | 16.8% |
| Base Year for Estimation | 2025 |
| Historic Period | 2020–2024 |
| Forecast Period | 2026–2035 |
| Report Coverage | Revenue Forecast, Market Dynamics, Competitive Landscape, Recent Developments |
| Segments Covered | By Component (Software / Solutions (Planning and Execution, Order Management, Audit, Payment and Claims, Analytics & Reporting, Others), Services (Professional Services, Implementation & Integration Services, Consulting & Advisory Services, Support & Maintenance Services), Managed Services), By Deployment Mode (Cloud-Based (SaaS), Public Cloud, Private Cloud, Hybrid Cloud, On-Premise), By Mode of Transportation (Roadways, Railways, Airways, Seaways / Maritime), By End-User Industry (Shippers (Beneficial Cargo Owners), Freight Brokers & Forwarders, 3PL / 4PL Providers, Others), By Enterprise Size (Large Enterprises, Small Enterprises) |
| Regional Analysis | North America – The US & Canada; Europe – Germany, France, The UK, Spain, Italy, Russia & CIS, Rest of Europe; APAC – China, Japan, South Korea, India, ASEAN & Rest of APAC; Latin America – Brazil, Mexico & Rest of Latin America; Middle East & Africa – GCC, South Africa, & Rest of MEA |
| Competitive Landscape | Oracle Corporation, SAP SE, C.H. Robinson (Navisphere), Manhattan Associates, Blue Yonder (JDA), Trimble Inc. (TMW Systems), WiseTech Global (CargoWise), Descartes Systems Group, E2open, Körber AG, Infor (Nexus), Alpega Group, Generix Group, MercuryGate International, Uber Freight, and Other Players. |
| Customization Scope | Customization for segments, region/country-level will be provided. Moreover, additional customization can be done based on the requirements. |
| Purchase Options | We have three licenses to opt for: Single User License, Multi-User License (Up to 5 Users), Corporate Use License (Unlimited Users and Printable PDF) |





































