Introduction
Smartphone Brands Statistics: The smartphone sector is primarily controlled by a select few key players, with Samsung, Apple, and Xiaomi regularly positioned among the leading global manufacturers, although market share can fluctuate every quarter. Android stands as the foremost mobile operating system globally, powering the vast majority of smartphones, while Apple’s iOS maintains a notable but smaller portion of the market. In spite of a reduction in the overall number of brands, the market continues to be fiercely competitive, with consumers dedicating billions of hours each year to their devices.
In the international arena, Apple and Samsung consistently rank as the top two brands, with Apple frequently leading in ownership share within the U.S. and Samsung often taking the lead in shipments in recent quarters. Xiaomi emerges as a formidable competitor, typically securing the third position globally and excelling in emerging markets. The advent of 5G technology represents a significant trend, capturing a considerable share of shipments in certain markets, such as India.
Editor’s Choice
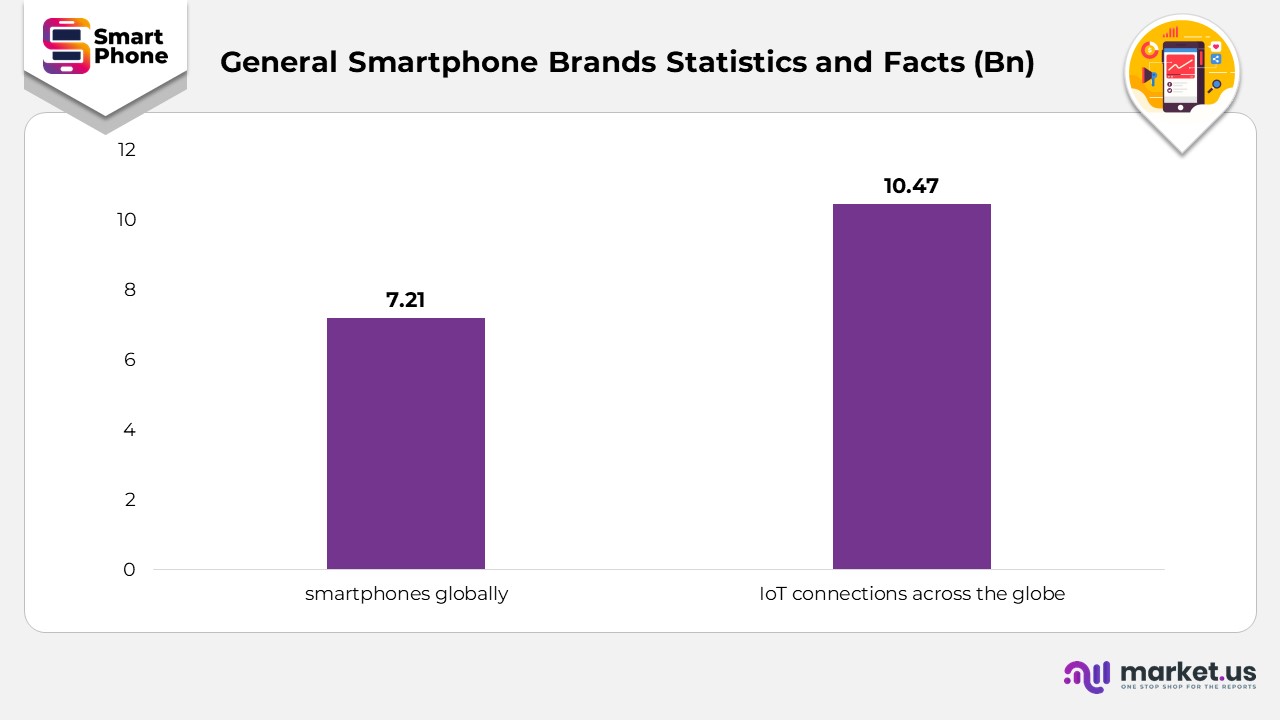
- There are roughly 7.21 billion smartphones globally.
- In the second quarter of 2024, Android maintained its position as the leading mobile operating system globally, commanding a market share of 71.65%.
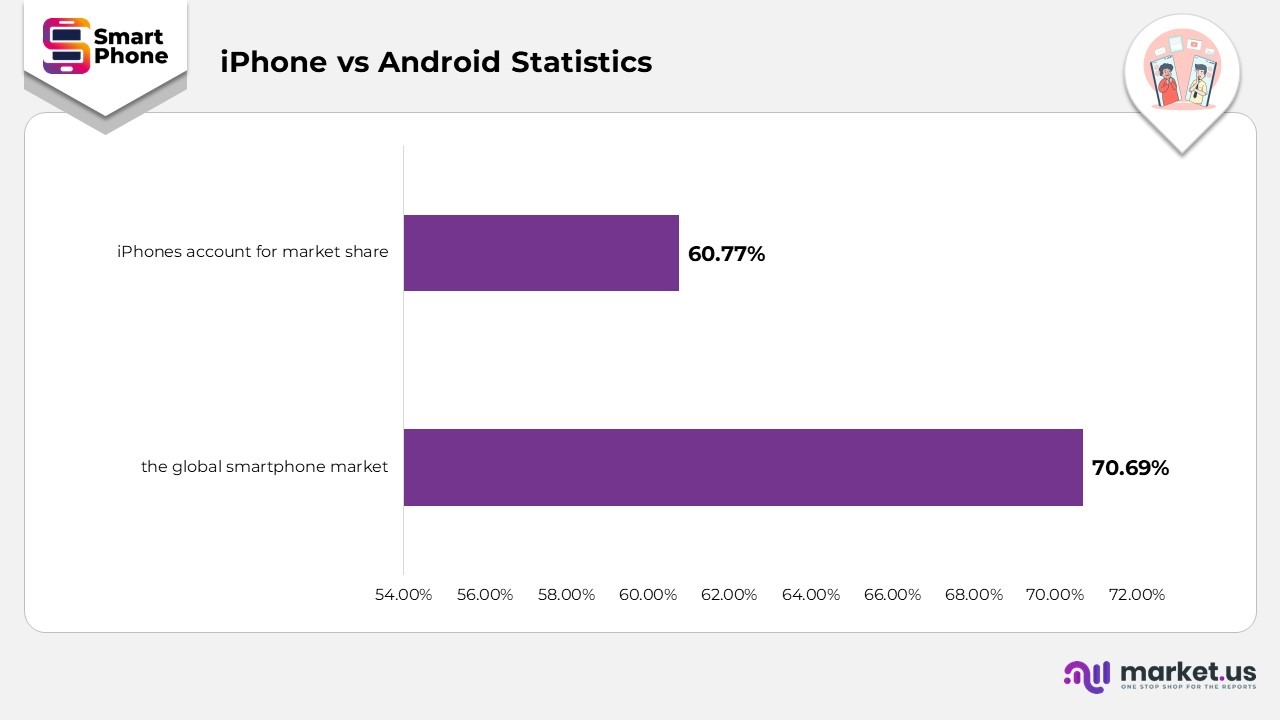
- As of early 2024, Android holds a commanding 70.69% share of the global smartphone market. In the United States, iPhones account for a 60.77% market share.
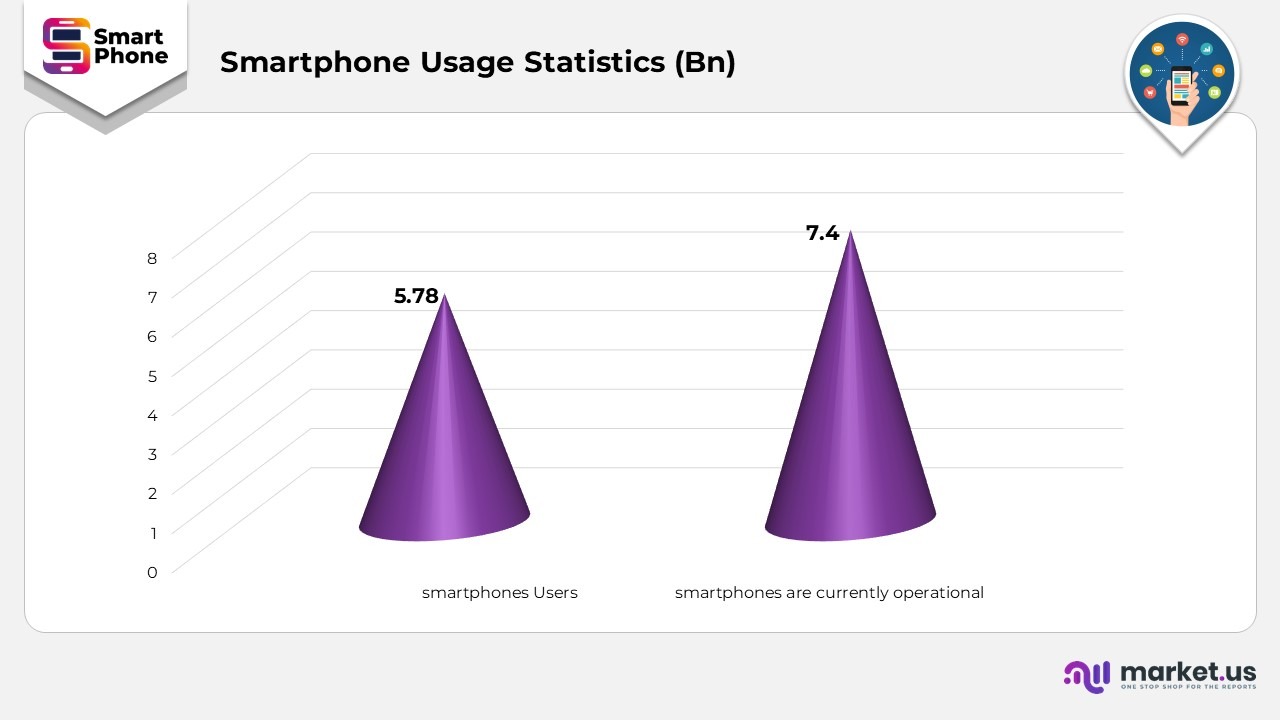
- More than 5.78 billion individuals utilise smartphones.
- Nearly 50% of individuals in the United States utilise smartphones for 5 to 6 hours each day.
General Smartphone Brands Statistics and Facts
- There are roughly 7.21 billion smartphones globally.
- The number of smartphone users worldwide has risen by a minimum 5% each year over the past five years.
- There are more than 10.47 billion IoT connections across the globe.
- Smartphones account for 94.2% of all devices utilised to access the internet.
- China holds the highest number of smartphone users in the world.
- Germany exhibits the highest smartphone usage per capita.
- Individuals with college degrees are the most likely to possess a smartphone.
- Android is the predominant mobile operating system on a global scale.
Market Share of Smartphone OS Systems
- In the second quarter of 2024, Android maintained its position as the leading mobile operating system globally, commanding a market share of 71.65%.
- According to Android Statistics, its primary rival, Apple’s iOS, accounted for approximately 27.62% of the market during the same timeframe.
- Both Android and iOS were launched in 2007 and have undergone various updates to introduce new features.
- The most recent version of iOS, known as iOS 17, was released in September 2023, while Android 14 was made available in October 2023.
- A significant distinction between the two operating systems lies in their hardware compatibility: iOS is exclusively available on Apple devices, whereas Android is utilized by numerous manufacturers, including Samsung, Google, and OnePlus.
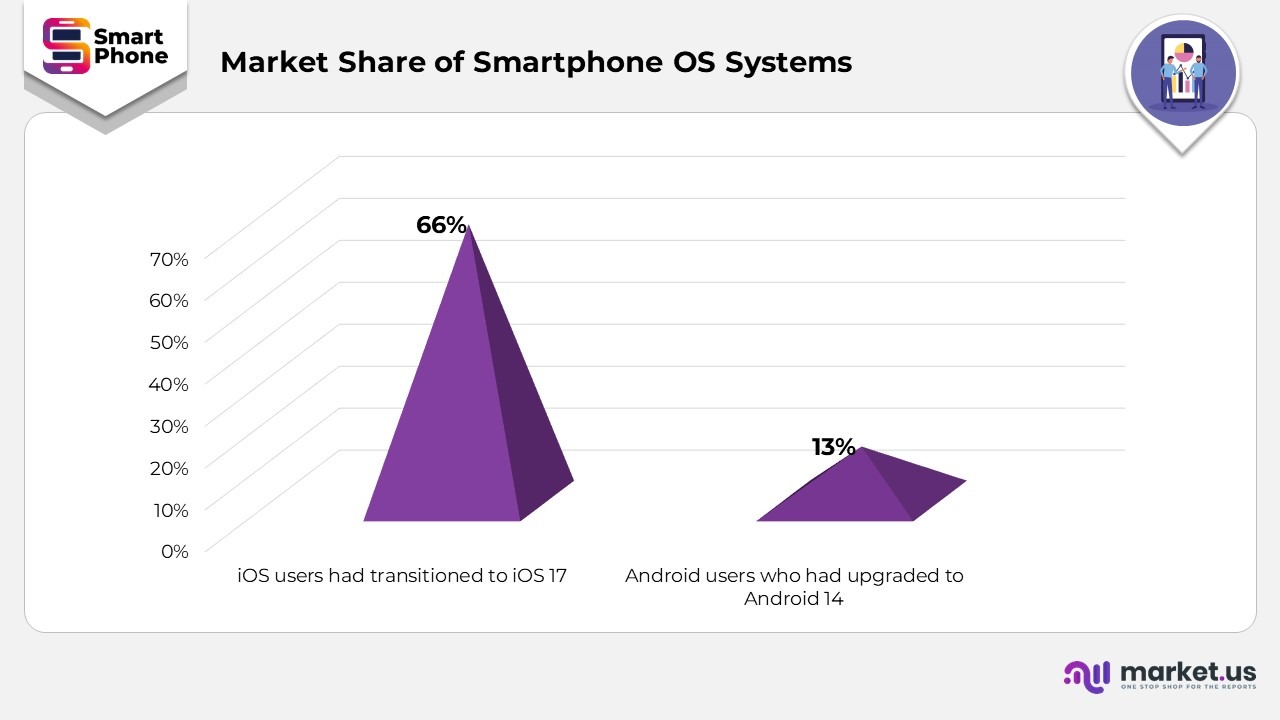
- Furthermore, Apple has demonstrated greater success in encouraging users to upgrade to the latest version. As of February 2024, 66% of iOS users had transitioned to iOS 17, in contrast to only 13% of Android users who had upgraded to Android 14.
iPhone vs Android Statistics
- As of early 2024, Android holds a commanding 70.69% share of the global smartphone market. In the United States, iPhones account for a 60.77% market share.
- During the fourth quarter of 2023, Android smartphones made up 56% of all global smartphone sales.
- In the end, Android remains the leading mobile operating system worldwide with a 70.69% market share, while iPhones (iOS) represent 28.58%.
- As of February 2024, iPhones dominate the mobile phone market in the U.S., holding a market share of 60.77%, while Android phones comprise 38.81%, as reported in Android Statistics.
- The highest Android market share recorded was 46.42% in 2015, compared to 50.85% for iPhones/iOS during the same year.
- As of 2024, the App Store provides approximately 1.8 million apps for iPhone users to download. In contrast, Android users have access to 2.44 million apps on the Google Play Store.
- In terms of spending, iPhone users are projected to spend $124 billion on apps, in-app purchases, and subscriptions in 2024, according to Android Statistics.
- On the other hand, Android users are expected to spend $51 billion on apps available in the Google Play Store.
Smartphone Brands Usage Statistics
- More than 5.78 billion individuals utilise smartphones.
- In excess of 7.4 billion smartphones are currently operational.
- Over 97% of individuals aged 18 to 49 utilise smartphones.
- Nearly half of the population in the United States dedicates 5 to 6 hours daily to smartphone usage.
- Smartphones constitute 70% of the total digital media consumption time in the United States.
- Mobile commerce represented 73% of the overall e-commerce market.
- Mobile devices account for 65% of the traffic in e-commerce.
- In the United States, smartphone users interact with their devices an average of 2,617 times each day.
- Almost 72% of adolescents check their phone messages and notifications immediately upon waking.
Smartphone Brands Loyalty Statistics
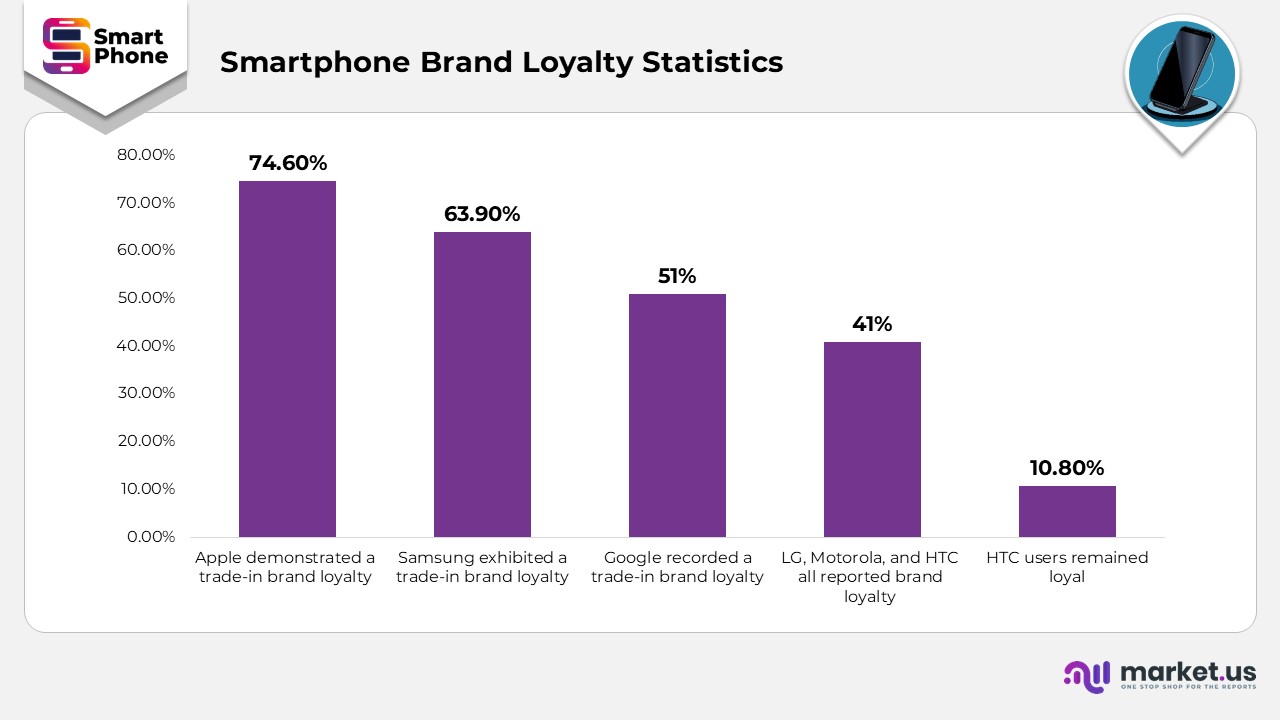
- Apple demonstrated a trade-in brand loyalty of 74.6% for iPhones, while 12.8% of users opted for Samsung and 5.3% for LG.
- Samsung exhibited a trade-in brand loyalty of 63.9%, with 17% of users choosing Apple and 8% selecting LG.
- Google recorded a trade-in brand loyalty of 51.0%, with the smallest percentage, 10.1%, opting for Apple.
- LG, Motorola, and HTC all reported brand loyalty below 41% during trade-ins.
- Only 10.8% of HTC users remained loyal, with 32.1% switching to Samsung and 17.1% to Apple.
Time Spent by Smartphone Users
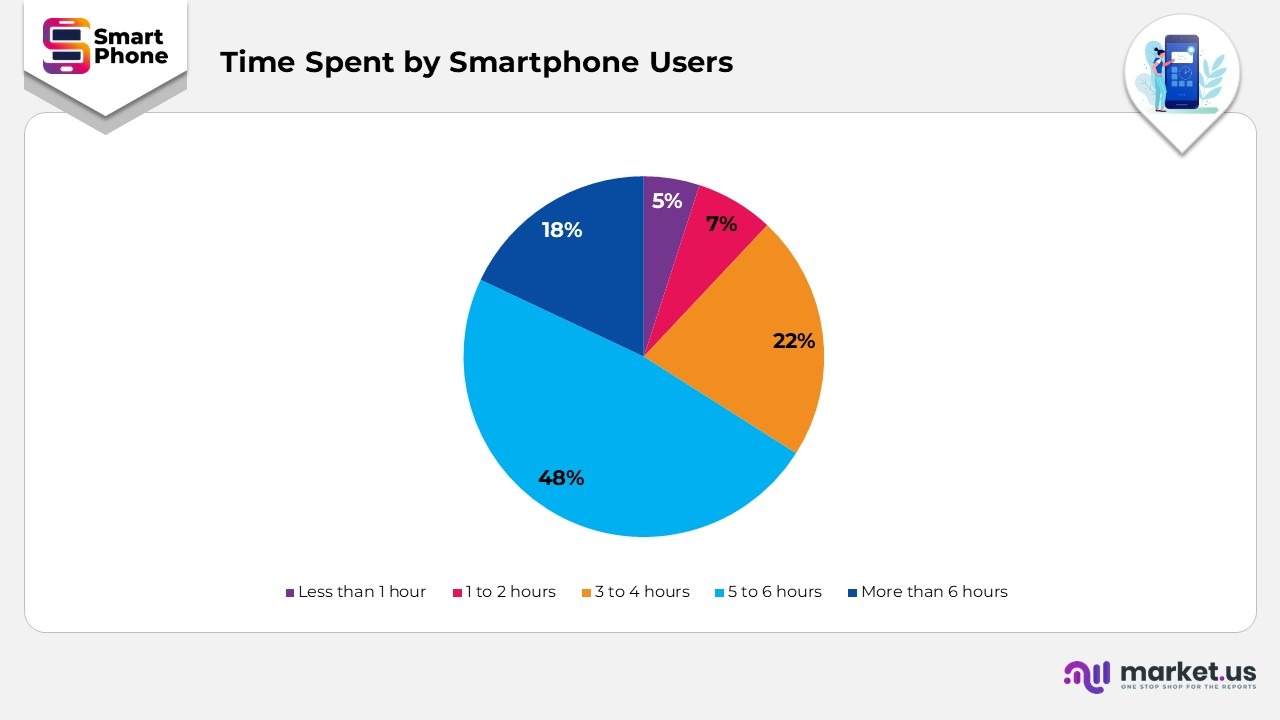
- Nearly 50% of individuals in the United States utilise smartphones for 5 to 6 hours each day.
- This represents more than 132 million users. Conversely, merely 5% of smartphone users engage with their devices for less than one hour per day.
- Additionally, 7% of users spend one to two hours on their smartphones daily, corresponding to 13.76 million and 19.27 million smartphone users, respectively.
- The global average time spent on smartphones each day is 3 hours and 43 minutes.
- Among the countries analysed, only one European country, Turkey, surpassed the global average with a daily screen time of 4 hours and 16 minutes.
Smartphone Brands Fun Facts
- Nokia’s 1100 holds the record as the best-selling electronic device of all time.
- Samsung manufactures the majority of its own components.
- Apple’s marketing frequently features the time 9:41 to commemorate the announcement of the first iPhone.
- The IBM Simon Personal Communicator, recognised as the first smartphone, was launched in 1994, and the term for the fear of losing one’s smartphone is “nomophobia.”
- In Finland, there is a yearly competition known as “mobile throwing,” which is regarded as a national sport.
- Some individuals in Japan utilise waterproof smartphones even while taking a shower.
Recent Developments
- Samsung introduced the Galaxy S24 series, featuring the S24 Ultra, which received praise for its AI capabilities, anti-glare screen, and robust performance. Additionally, Samsung persisted in its innovation within the foldable phone sector.
- Xiaomi witnessed remarkable growth, emerging as the fastest-growing brand worldwide in 2024. This success was credited to the realignment and expansion of its product portfolio.
Smartphone Brands Future Predictions
- Apple is anticipated to unveil the iPhone 18 series, which may feature its inaugural foldable iPhone, in late 2026, potentially serving as a major catalyst in the market.
- In 2026, one can expect ongoing AI integration among brands such as Google’s Pixel series, Samsung’s Galaxy S and A lines, and Honor’s forthcoming devices, while foldable smartphones from Apple and other manufacturers are likely to gain wider acceptance.
- The total value of the smartphone market is projected to increase from an estimated $484.81 billion in 2022 to $792.51 billion by the year 2029.
Conclusion
Smartphone Brands Statistics: The global smartphone market is extremely competitive, with Apple and Samsung continually competing for the leading position in market share, although rankings may change every quarter. Companies such as Xiaomi, vivo, and OPPO are significant contenders that demonstrate considerable growth, especially in emerging markets, and are increasingly challenging Apple and Samsung. In certain regions, the leaders in the market can differ, and brands frequently focus on various strategies, such as high-end devices or budget-friendly options, to enhance their market share.