Quick Navigation
Company Overview
PepsiCo Statistics: PepsiCo, Inc. is a leading global beverage and convenient foods company with a diverse portfolio of iconic brands, including Lay’s, Doritos, Cheetos, Gatorade, Pepsi-Cola, Mountain Dew, Quaker, and SodaStream. The company operates through its owned operations, authorized bottlers, contract manufacturers, and third-party partners. PepsiCo’s business is structured into 7 reportable segments: Frito-Lay North America (FLNA), encompassing its branded convenient foods in the Canada and United States; Quaker Foods North America (QFNA), covering branded convenient foods such as cereals, rice, and pasta in the U.S. and Canada; PepsiCo Beverages North America (PBNA), representing beverage operations in the U.S.; and Canada.
Latin America (LatAm), including beverage and convenient food businesses across Latin American markets; Europe, comprising beverage and convenient food operations across European countries; Africa, Middle East and South Asia (AMESA), covering beverage and convenient food businesses in those regions; and Asia Pacific, Australia, New Zealand, and China Region (APAC), managing operations across these territories.
PepsiCo maintains a strong international presence in more than 200 countries and territories through an extensive network of manufacturing plants, distribution centers, and research and development facilities located in Canada, Australia, China, India, New Zealand, Pakistan, Thailand, Belgium, Denmark, Finland, France, Germany, Iceland, Italy, Luxembourg, Netherlands, Norway, Poland, Portugal, Russia, Spain, Sweden, Türkiye, Ukraine, the United Kingdom, West Balkans, Brazil, Colombia, Mexico, the Middle East, and South Africa. As of December 28, 2024, the company employed approximately 319,000 people worldwide, including around 134,000 employees within the United States.
History of PepsiCo, Inc.
1800’s
- 1893: Caleb Bradham, a young pharmacist from New Bern, North Carolina, begins creating a series of soft drink recipes at his drugstore soda fountain, allowing customers to sample his early experiments.
- 1898: One of Braham’s creations, originally called “Brad’s Drink,” made from carbonated water, sugar, rare oils, vanilla, and cola nuts, is officially renamed Pepsi-Cola on August 28, 1898. The beverage also received its first logo this year.
1900’s
- 1902: The immense popularity of Pepsi-Cola drives Bradham to establish the first Pepsi-Cola Company and apply for a trademark with the U.S. Patent Office in Washington, D.C. The brand begins advertising in local newspapers.
- 1903: Bradham moves bottling operations from his pharmacy to a rented warehouse, selling 7,968 gallons of syrup during the first operational year under the slogan “Exhilarating, Invigorating, Aids Digestion.”
- 1904: A new building known as the “Bishop Factory” is purchased for $5,000, allowing expansion of bottling and syrup production. Annual sales rise to 19,848
- 1905–1907: Pepsi establishes its first franchises in North Carolina cities and registers trademarks in Canada and Mexico. By 1907, syrup sales exceeded 100,000 gallons, supported by a growing network of 40 bottling franchises.
- 1908: Pepsi modernizes its delivery fleet, transitioning from horse-drawn carts to motor vehicles, one of the earliest beverage companies to do so.
- 1909: Legendary race car driver Barney Oldfield endorses Pepsi in national newspapers, branding it as a “refreshing and invigorating” drink.
- 1910: The company hosts its first national bottlers’ convention in New Bern, symbolizing its growing franchise structure.
- 1923–1931: Financial challenges during the Great Depression led to multiple bankruptcies and ownership changes. In 1931, the Loft Candy Company, led by Charles G. Guth, acquired Pepsi, reformulating the syrup and reviving the brand.
- 1934: Pepsi introduces the 12-ounce bottle, sold for five cents, offering double the volume for the same price as competitors, an innovation that drives nationwide success amid the Depression.
Further
- 1935–1939: Operations move to Long Island City, New York, and profits exceed 1 million. The “Twice as Much for a Nickel” campaign becomes an advertising landmark, and Pepsi’s first national radio jingle, “Nickel, Nickel,” is introduced.
- 1940s: Pepsi’s branding evolves with patriotic red, white, and blue bottle caps during World War II. By 1941, Pepsi-Cola was listed on the New York Stock Exchange.
- 1950s: Under Alfred N. Steele’s leadership, Pepsi became a major competitor to Coca-Cola, modernizing marketing and introducing the “bottle cap” logo. The “Light Refreshment” campaign of 1953 reflects changing consumer tastes.
- 1960–1965: Pepsi’s “For Those Who Think Young” and “Pepsi Generation” campaigns reshape its image for younger audiences. The company acquired Mountain Dew in 1964 and merged with Frito-Lay in 1965, forming PepsiCo, Inc.
- 1970s: Pepsi introduces the two-liter plastic bottle and opens its first manufacturing plant in the S.S.R. By 1976, it becomes the largest soft drink brand sold in U.S. supermarkets.
- 1980–1989: Pepsi expands globally, enters China through a manufacturing partnership, and introduces major innovations, including Pepsi Free and Wild Cherry Pepsi. The “Choice of a New Generation” campaign dominates pop culture through music and celebrity endorsements.
- 1990s: Pepsi pioneers sustainability by using recycled PET bottles, forms a partnership with Lipton Tea, and launches Crystal Pepsi. It merged Pepsi Foods International and Pepsi-Cola International into a single entity, PepsiCo, in 1996.
- 1997: PepsiCo spins off its restaurant division, forming Tricon Global Restaurants, Inc. (now Yum! Brands), which includes KFC, Pizza Hut, and Taco Bell.
- 1998: Pepsi celebrates its 100th anniversary, marking a century of continuous innovation in beverages and snacks.
2000’s
- 2001: PepsiCo merges with The Quaker Oats Company, bringing Gatorade into its product lineup and expanding its nutrition-oriented portfolio.
- 2010: PepsiCo acquires Wimm-Bill-Dann, Russia’s largest food and beverage company, becoming one of its largest international acquisitions.
- 2018: The acquisition of SodaStream International Ltd. strengthens PepsiCo’s position in the growing at-home beverage segment.
- 2020: PepsiCo completes the acquisition of Pioneer Foods Group in South Africa, reinforcing its footprint across Africa.
- 2021: PepsiCo sells Tropicana, Naked, and other juice brands to PAI Partners, realigning its focus toward low-calorie and functional beverages.
- 2022: The company unveils the Pep+ (PepsiCo Positive) sustainability platform, targeting net-zero emissions by 2040 and promoting regenerative agriculture.
- 2024: PepsiCo advances its digital transformation and AI-driven sustainability initiatives, enhancing efficiency across global manufacturing, logistics, and marketing operations.
(Source: Company Website)
Financial Analysis
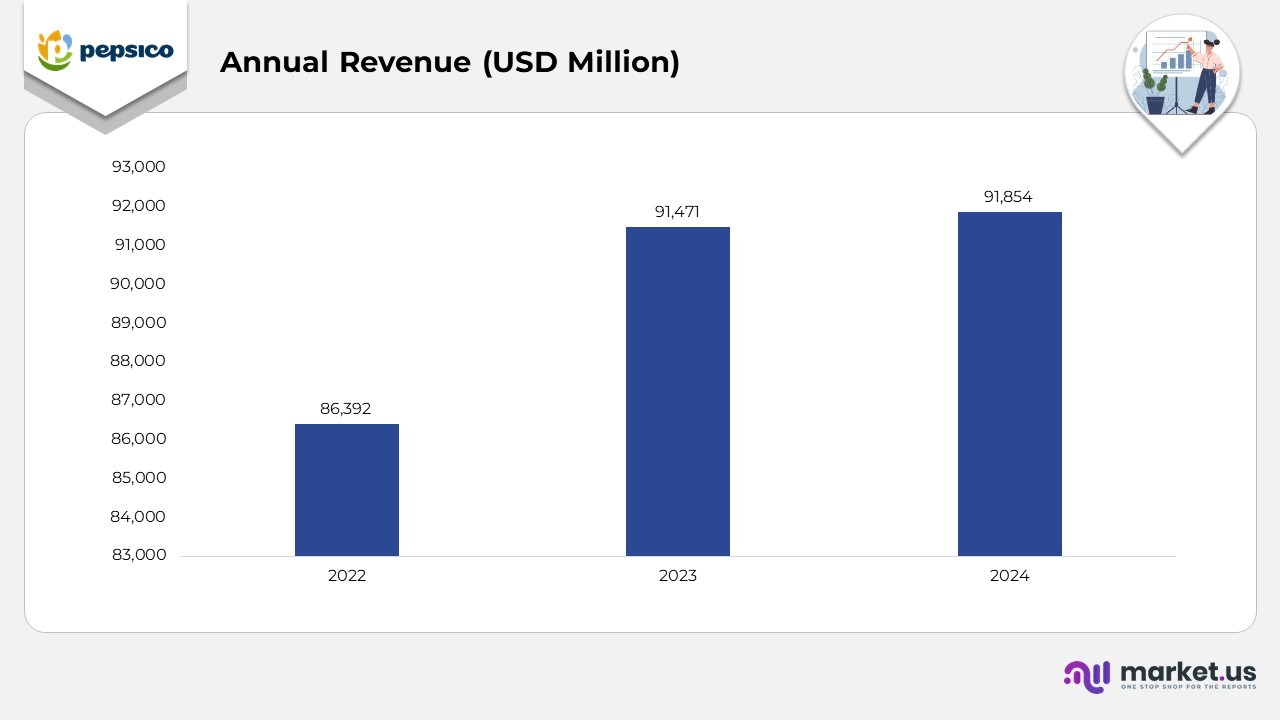
- In 2022, PepsiCo reported annual revenue of USD 86.4 billion, reflecting a strong performance driven by steady global demand for beverages and convenient foods, despite inflationary pressures.
- In 2023, revenue rose to USD 91,471 million, representing 5.9% year-over-year growth compared to 2022. The increase was supported by pricing adjustments, portfolio premiumization, and resilient demand across developed and emerging markets.
- In 2024, annual revenue reached USD 91.854 billion, marking a 4% growth from 2023. The modest rise indicates market stabilization after significant expansion the previous year, with gains balanced by cautious consumer spending and currency fluctuations across key markets.
Geographical Revenue
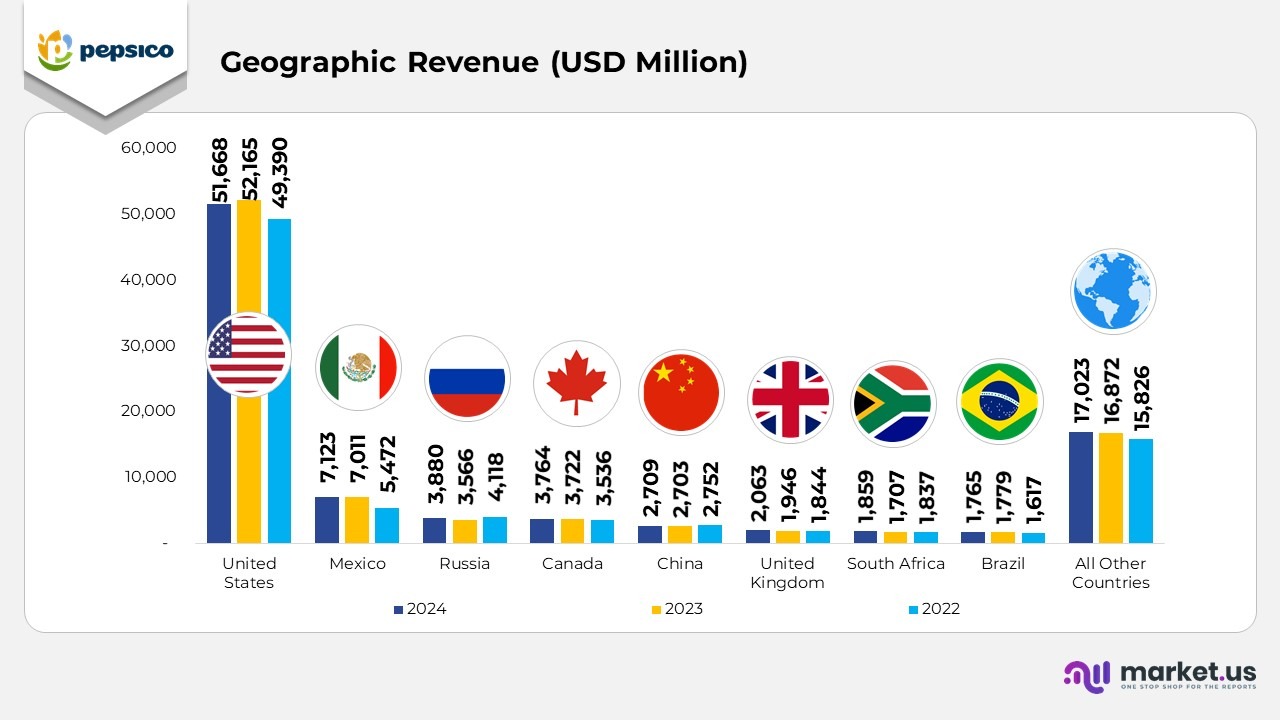
- In 2024, the United States generated USD 51,668 million, slightly lower than USD 52,165 million in 2023 but higher than USD 49,390 million in 2022, reflecting stable performance in PepsiCo’s core market despite pricing normalization.
- In 2024, Mexico recorded USD 7,123 million, up from USD 7,011 million in 2023 and USD 5,472 million in 2022, indicating consistent growth supported by expanding consumption of snacks and beverages.
- In 2024, Russia achieved USD 3,880 million, rising from USD 3,566 million in 2023, though below the USD 4,118 million recorded in 2022, indicating a partial recovery amid regional market challenges.
- In 2024, Canada reported USD 3,764 million, an increase from USD 3,722 million in 2023 and USD 3,536 million in 2022, demonstrating stable year-on-year progress within North America.
- In 2024, China contributed USD 2,709 million, slightly above USD 2,703 million in 2023 but marginally lower than USD 2,752 million in 2022, reflecting balanced growth under moderate demand conditions.
- In 2024, the United Kingdom posted USD 2,063 million, up from USD 1,946 million in 2023 and USD 1,844 million in 2022, supported by strong retail performance and innovation in low-calorie beverages.
- In 2024, South Africa generated USD 1,859 million, compared with USD 1,707 million in 2023 and USD 1,837 million in 2022, highlighting continued regional resilience and expansion in African markets.
- In 2024, Brazil recorded USD 1,765 million, slightly lower than USD 1,779 million in 2023 but higher than USD 1,617 million in 2022, driven by growth in energy and juice categories.
- In 2024, all other countries collectively contributed USD 17,023 million, up from USD 16,872 million in 2023 and USD 15,826 million in 2022, underscoring a broad-based international growth momentum.
(Source: PepsiCo, Inc. SEC Filings)
Pepsico Statistics Segmental Revenue
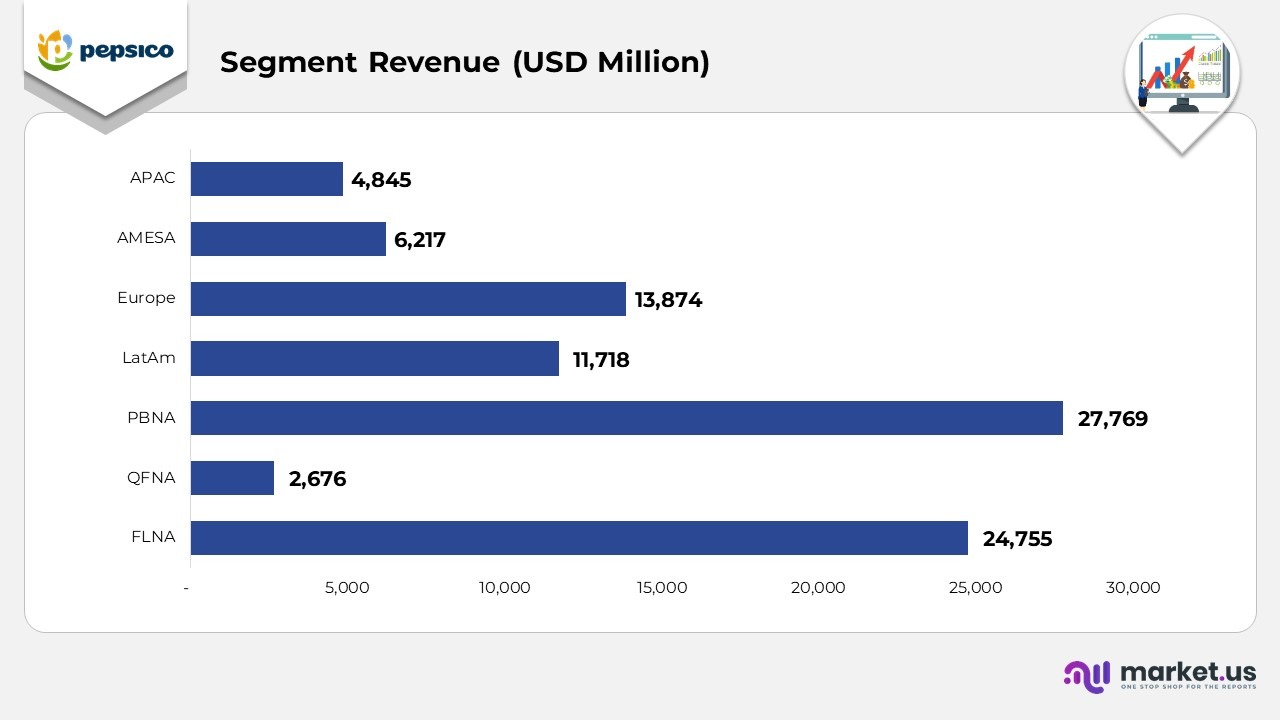
- In 2024, Frito-Lay North America reported USD 24,755 million, a 4.5% increase from 2023. Driven by steady demand for salty snacks and product innovation across the U.S. and Canada.
- In 2024, Quaker Foods North America (QFNA) generated USD 2,676 million, representing a 3.0% increase over 2023. Driven by innovation in healthy breakfast cereals and value-pack formats.
- In 2024, PepsiCo Beverages North America (PBNA) achieved USD 27,769 million, representing 3.3% growth compared to 2023, driven by increased sales of energy, hydration, and functional beverages.
- In 2024, Latin America (LatAm) generated USD 11,718 million, representing a strong 7.5% year-over-year increase driven by higher pricing, volume recovery, and market expansion in key economies such as Mexico and Brazil.
- In 2024, Europe reported USD 13,874 million, a 9% increase from 2023. Fueled by sustained demand for healthier snacks and low-calorie beverages.
- In 2024, the Africa, Middle East, and South Asia (AMESA) region generated USD 6,217 million, a 4.1% increase from 2023, driven by a recovery in out-of-home consumption and strong brand positioning.
- In 2024, the Asia Pacific, Australia, New Zealand, and China region (APAC) posted USD 4,845 million, representing 1% growth over 2023, driven by increased demand for ready-to-drink and premium beverage categories.
FLNA (Frito-Lay North America)
- Net revenue declined by 1%, primarily due to lower organic volume, which was partly offset by favourable pricing strategies.
- Unit volume fell 5%, led by mid-single-digit declines in Cheetos and Tostitos, and low-single-digit declines in Lay’s and variety packs; this was partially offset by double-digit growth in Miss Vickie’s and Chester’s.
- Operating profit decreased by 7%, primarily due to higher operating expenses, strategic investments, and lower volume. Although productivity gains and effective pricing provided partial relief.
QFNA (Quaker Foods North America)
- Net revenue decreased by 14%, primarily due to a reduction in organic volume following the Quaker Recall.
- Unit volume declined 14%, with double-digit decreases across bars, oatmeal, pancake mixes, and ready-to-eat cereals; recall-related product losses were the primary driver.
- Operating profit plunged 38%, reflecting lower sales, higher costs, and recall-related charges, partially mitigated by productivity initiatives, insurance recovery gains, lower marketing costs, and pricing efficiency.
PBNA (PepsiCo Beverages North America) PepsiCo Statistics
- Net revenue rose 5%, driven by effective pricing, partially offset by a decline in organic volume.
- Unit volume declined by 3%, with non-carbonated beverages down 4% and carbonated soft drinks down 2%. Water, Lipton RTD teas, and Gatorade showed weaker performance.
- Operating profit decreased by 11%, primarily due to higher operating costs, restructuring charges, impairment costs associated with TBG investments, and increased marketing spending, partially offset by productivity savings and pricing leverage.
LatAm (Latin America) PepsiCo Statistics
- Net revenue increased 5%, supported by pricing strength, partially offset by a 3% foreign exchange impact and a slight decline in volume.
- The volume of convenient foods fell 2%, with steep declines in Peru and Argentina, offset by modest growth in Brazil. Beverage volume rose slightly, led by growth in Brazil, Mexico, Guatemala, and Chile.
- Operating profit decreased marginally, reflecting cost pressures, indirect tax reserves, and currency weakness, partially offset by lower commodity costs, pricing actions, and efficiency gains.
Europe PepsiCo Statistics
- Net revenue increased 5%, driven by stronger pricing and organic volume growth, partially offset by a 2% currency impact.
- The volume of convenient foods rose 2%, supported by growth in Russia and the UK. Although tempered by declines in France and the Netherlands. Beverage volume also grew 2%, with similar regional variations.
- Operating profit surged 163%, primarily due to lapping prior-year impairment charges related to SodaStream, along with productivity savings, lower restructuring costs, and strong top-line performance.
AMESA (Africa, Middle East & South Asia) PepsiCo Statistics
- Net revenue increased by 1%, reflecting solid pricing and volume growth, offset by a 9% drag from foreign exchange.
- Convenient foods volume increased 2%, led by mid-single-digit growth in South Africa and double-digit gains in India. Offset by declines in Pakistan and the Middle East.
- Beverage volume increased by 1%, with strong double-digit growth in India offset by declines in Nigeria, Pakistan, and the Middle Eastern
- Operating profit declined by 1%, primarily due to higher input costs, unfavourable exchange rates, and packaging inflation. These were partially offset by productivity gains and revenue growth.
APAC (Asia Pacific, Australia, New Zealand & China) PepsiCo Statistics
- Net revenue grew 1%, supported by organic volume growth, offset by a 2% currency impact and modestly lower pricing.
- Convenient foods volume increased 4%, led by double-digit growth in Thailand and mid-single-digit gains in Australia and China. Beverage volume rose 1%, driven by strong growth in Thailand, Vietnam, and the Philippines, offset by softer sales in China.
- Operating profit advanced 14%, supported by efficiency gains, higher volumes, lower input costs, and the absence of prior-year impairment charges related to Be & Cheery, partially offset by higher operational spending.
(Source: PepsiCo, Inc. SEC Filings)
PepsiCo Patent Portfolio
| Patent Title | Patent No. / Publication No. | Filed Date | Patent Date |
|---|---|---|---|
| Modular refrigeration system for storing products | 12442581 | September 8, 2022 | October 14, 2025 |
| Systems and methods for dosing a flowable solid | 12436015 | August 19, 2022 | October 7, 2025 |
| System and method for operating a heating element of an appliance | 12414649 | April 12, 2021 | September 16, 2025 |
| Systems and methods for dispensing a beverage | 12415715 | February 10, 2023 | September 16, 2025 |
| Compositions providing slow release of caffeine | 12398137 | June 17, 2022 | August 26, 2025 |
| Method of providing sustained energy | 20250235164 (Application) | January 21, 2025 | July 24, 2025 |
| Beverage dispenser with beverage-level indicator | 12351448 | October 28, 2022 | July 8, 2025 |
| Dispenser | D1083477 | December 12, 2023 | July 15, 2025 |
| Bottle | D1082540 | July 12, 2023 | July 8, 2025 |
| Bottle | D1081265 | December 15, 2023 | July 1, 2025 |
| Dispenser | D1086776 | July 29, 2024 | August 5, 2025 |
| Dispenser | D1086777 | October 30, 2024 | August 5, 2025 |
| Display screen or portion thereof with an animated graphical user interface | D1087142 | July 22, 2024 | August 5, 2025 |
| Bottle | D1088884 | January 27, 2025 | August 19, 2025 |
| Cooler | D1092153 | February 6, 2024 | September 9, 2025 |
| Container preform | D1096269 | Jun 1, 2023 | Oct 7, 2025 |
| Vending machine | D1098269 | July 1, 2024 | October 14, 2025 |
| Bottle | D1098920 | October 19, 2023 | October 21, 2025 |
| Bottle | D1098921 | October 19, 2023 | October 21, 2025 |
| Bottle | D1098922 | August 15, 2023 | October 21, 2025 |
(Source: Justia Patents)
Recent Developments
- In October 2025, PepsiCo introduced the Global Farmer Awards, a worldwide initiative celebrating exceptional farmers, farming families, and agricultural advisors across its global supply chain. The program aims to foster resilience, innovation, and sustainable growth within farming communities connected to PepsiCo’s operations.
- In September 2025, PepsiCo launched the Supporting Trusted Engagement and Partnership (STEP) Up for Agriculture initiative. This aims to enhance the capacity, reach, and sustainability of farmer-support organizations throughout North America. This initiative underscores the company’s long-term commitment to agricultural development and food system resilience.
- In July 2025, PepsiCo unveiled the Pepsi Prebiotic Cola, a first-of-its-kind innovation aligning with evolving consumer preferences for wellness-oriented beverages while maintaining the signature cola experience.
- In July 2025, PepsiCo’s iconic brand, Mountain Dew, rolled out the “Thirst Guards” campaign, designed to deliver ice-cold refreshment directly to fans at major lake destinations nationwide, thereby enhancing brand engagement through experiential marketing.
Moreover
- In May 2025, PepsiCo entered into a strategic agreement with Amazon Web Services (AWS) to accelerate its enterprise-wide digital transformation, leveraging cloud technology, data analytics, and artificial intelligence to improve operational agility and customer experiences.
- In April 2025, PepsiCo renewed and expanded its partnership as an official UEFA Women’s Football sponsor through 2030, securing rights for the UEFA Women’s Champions League (2025–2030) and UEFA Women’s EURO 2029. The collaboration, featuring Pepsi, Lay’s, and Gatorade, aims to drive fan engagement, support grassroots football, and empower women in sports globally.
- In March 2025, PepsiCo announced the acquisition of Poppi, a fast-rising prebiotic soda brand, for USD 1.95 billion, including USD 300 million in expected tax benefits, resulting in a net purchase price of USD 1.65 billion. The move strengthens PepsiCo’s position in the functional beverage segment.
- In November 2024, PepsiCo completed an agreement to acquire the remaining 50% stake in Sabra Dipping Company, LLC, reinforcing its focus on expanding better-for-you and convenient snacking options to meet growing consumer demand for healthy, on-the-go foods.
(Source: PepsiCo, Inc. Press Releases)