
Quick Navigation
- Introduction
- Editor’s Choice
- General Virtual Events Statistics
- Successful Virtual Events Statistics
- Cost of Virtual Events Statistics
- Virtual Events Attendance, Engagement, and Audience Behavior Trends Statistics
- Virtual Events Engagement Trends Statistics
- Virtual Events Promotion Statistics
- Virtual Event Statistics By Technology
- Virtual Events Return On Investment Statistics
- Why Virtual Events Continue to Stay Popular: Statistics
- Virtual Events Planning and Scheduling Trends Statistics
- Virtual Event Marketing Strategy and Promotion
- Attendee Engagement and Content Design Trends in Virtual Events
- In-Person and Hybrid Event Planning Statistics
- Conclusion
Introduction
Virtual Events Statistics: Virtual events have swiftly become a vital component of contemporary business strategy, revolutionizing how organizations engage, collaborate, and communicate with audiences worldwide. Recent data indicate a strong upward trend in their adoption across industries, fueled by their scalability, cost-effectiveness, and capacity to deliver tailored, engaging experiences.
Once viewed as a temporary solution, virtual events have evolved into a strategic differentiator, with enterprises harnessing AI-driven insights, real-time analytics, and interactive tools to enhance participant engagement and optimize ROI. The seamless blend of hybrid formats, immersive digital environments, and data-informed planning underscores how virtual events have surpassed physical limitations to establish themselves as a cornerstone of digital transformation, redefining the global landscape of marketing, education, and customer engagement.
Editor’s Choice
- Around 30% of trade shows in 2021 incorporated a mix of in-person and virtual formats, reflecting the growing popularity of hybrid events.
- Over 50% of marketing professionals continue to prefer traditional face-to-face gatherings over fully virtual or hybrid formats, citing stronger networking and engagement opportunities.
- The ideal session length for virtual events is about 20 minutes, as nearly 68% of participants remain attentive within that timeframe.
- Nearly 49% of event organizers believe that the success of an event depends largely on the quality and engagement of the people involved.
- To enhance interactivity and enjoyment, 59% of event planners integrate gaming elements and participation-based activities into their programs.
- By 2024, approximately 59% of events are expected to be hosted in person, with 20% adopting hybrid structures, signalling a significant shift in event execution strategies.
- About 58% of marketers report challenges in maintaining audience attention throughout virtual sessions.
Moreover
- To boost engagement, 30% of organizers offer prizes while 59% incorporate games or contests during events.
- A vast 91% of large-scale event hosts generate revenue through sponsorship-based sessions and brand collaborations.
- Roughly 20% of trade shows in 2021 were conducted exclusively online, demonstrating the growing reliance on digital platforms.
- By 2022, about 40% of all events transitioned fully to virtual environments.
- Nearly 80% of virtual events are open-access and free to attend, increasing their global reach and participation levels.
- Webinars have become a critical marketing channel for nearly 99% of companies, emphasizing their value in lead generation and brand awareness.
- Around 76% of marketers identify email marketing as the most effective approach for driving event registrations and participation.
- The global virtual events market was valued at approximately USD 94.04 billion in 2020, showcasing its rapid expansion and economic significance.
- An estimated 41% of small event organizers prefer Zoom as their primary platform for hosting virtual sessions, citing its accessibility and reliability.
General Virtual Events Statistics
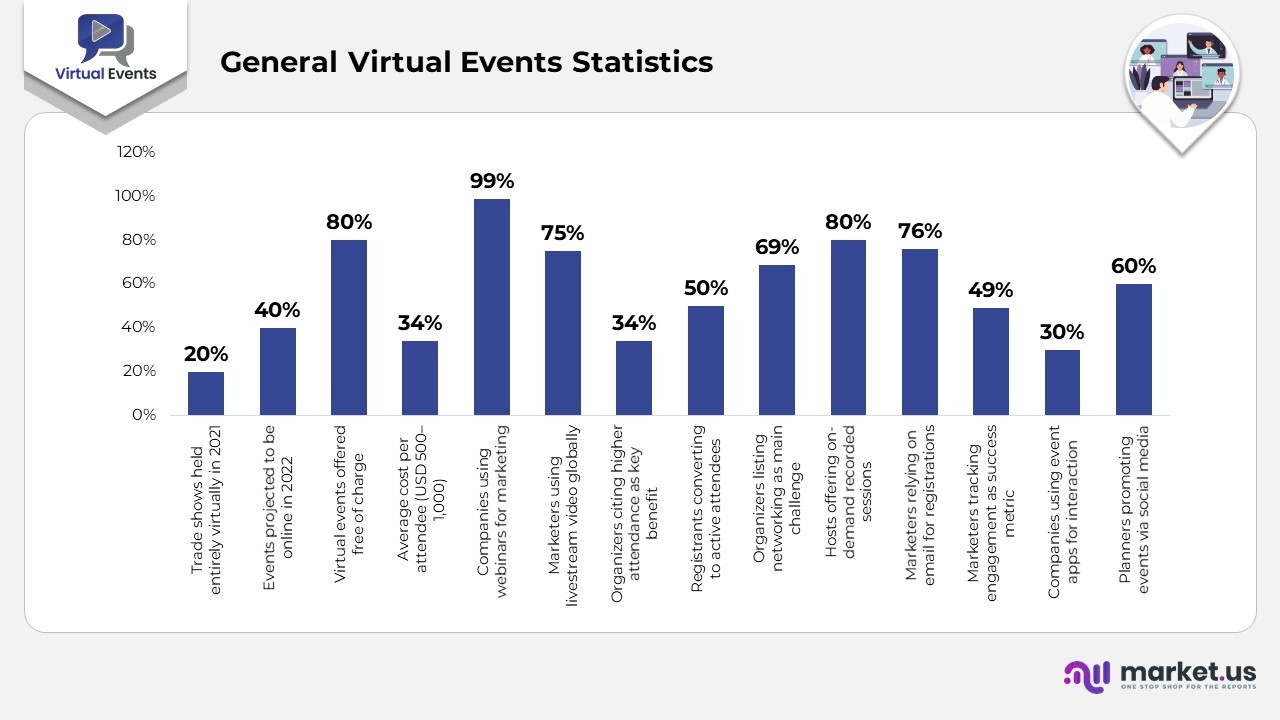
- Around 20% of all trade shows in 2021 were organized entirely as virtual events, marking a clear shift toward digital-first engagement.
- Nearly 40% of events were projected to take place online in 2022, emphasizing the sustained growth of virtual and hybrid formats.
- Approximately 80% of virtual events are hosted free of charge, thereby increasing accessibility and participation among global audiences.
- Nearly 34% of marketers estimate the average virtual event cost per attendee to range between USD 500 and USD 1,000, reflecting the continued investment in high-quality digital experiences.
- Webinars have become an essential marketing tool for 99% of companies, solidifying their role in lead generation and customer education.
- Approximately 75% of marketers worldwide leverage livestream video as a primary digital engagement medium.
- Around 34% of event organizers identify increased attendance as the most valuable outcome of transitioning to virtual events.
- Nearly 50% of individuals who register for virtual events actually attend, highlighting strong participation rates.
- Networking remains the biggest challenge for organizers, with 68.8% citing it as their top difficulty in virtual event environments.
- On average, organizers secure around 14 sponsorships per virtual event, demonstrating the growing appeal of digital sponsorship opportunities.
- Roughly 80% of virtual event hosts provide on-demand access to at least one recorded session, extending audience engagement beyond the live event.
- Approximately 76% of marketers consider email marketing the most effective tool for driving registrations to virtual events.
- Nearly 49% of marketers view participant engagement as the primary indicator of success for measuring virtual event performance.
- Around 30% of companies use dedicated event applications to enhance attendee interaction and overall experience.
- Nearly 60% of event planners utilise social media platforms as key channels for promoting and driving event registrations.
(Source: Statista, Bizzabo, Markletic, EventMB, Exhibitor Online, LAI Live, Eventtus, 99Firms.com)
Successful Virtual Events Statistics
- Salesforce World Tour 2020 transitioned to a virtual format in March 2020, recording over 2 million total views and attracting 80,000 livestream participants. The swift shift to an online platform was executed just 10 days before the event, marking it as one of the earliest large-scale digital transitions during the pandemic.
- Cvent’s Annual Conference 2020 achieved remarkable growth after moving online, hosting 42,000 participants, a significant increase of 37,500 attendees compared to 2019. The event leveraged Cvent’s proprietary Virtual Attendee Hub, enabling attendees to experience the product in real time while setting new benchmarks for digital conferencing success.
- Tomorrowland Around the World 2020, a Belgium-based music festival, attracted 1 million online attendees, more than double its typical 400,000 physical visitors. The event featured 8 virtual stages and 60 performers, integrating gamification within a digital island setting, showcasing an immersive, next-generation approach to virtual entertainment.
Further,
- Approximately 57% of all online events are structured as single-day programs, with an average of 20 sessions per event. Two-day events account for 14%, while 3-day events make up 9%, reflecting a preference for concise yet high-impact formats.
- Only 7% of participants prefer virtual events that exceed 1 hour, with 55% expressing a desire for sessions of 30 minutes or less. Organizers often include breaks every 25 minutes to combat virtual fatigue and sustain engagement.
- Roughly 33% of event organizers have experienced financial losses or workforce reductions due to market disruptions. Their main challenges include deciding between cancellation, postponement, or digital conversion; renegotiating contracts; and managing unpredictable planning conditions.
- Nearly 40% of virtual event attendees cite poor internet connectivity as their primary frustration, followed by camera malfunctions (20%), audio issues (30%), and distracting backgrounds (12%). These technical barriers remain the most common obstacles to delivering a seamless digital experience.
(Source: Social Tables, Hire Space, Bizzabo, GovExec, Eventsforce)
Cost of Virtual Events Statistics
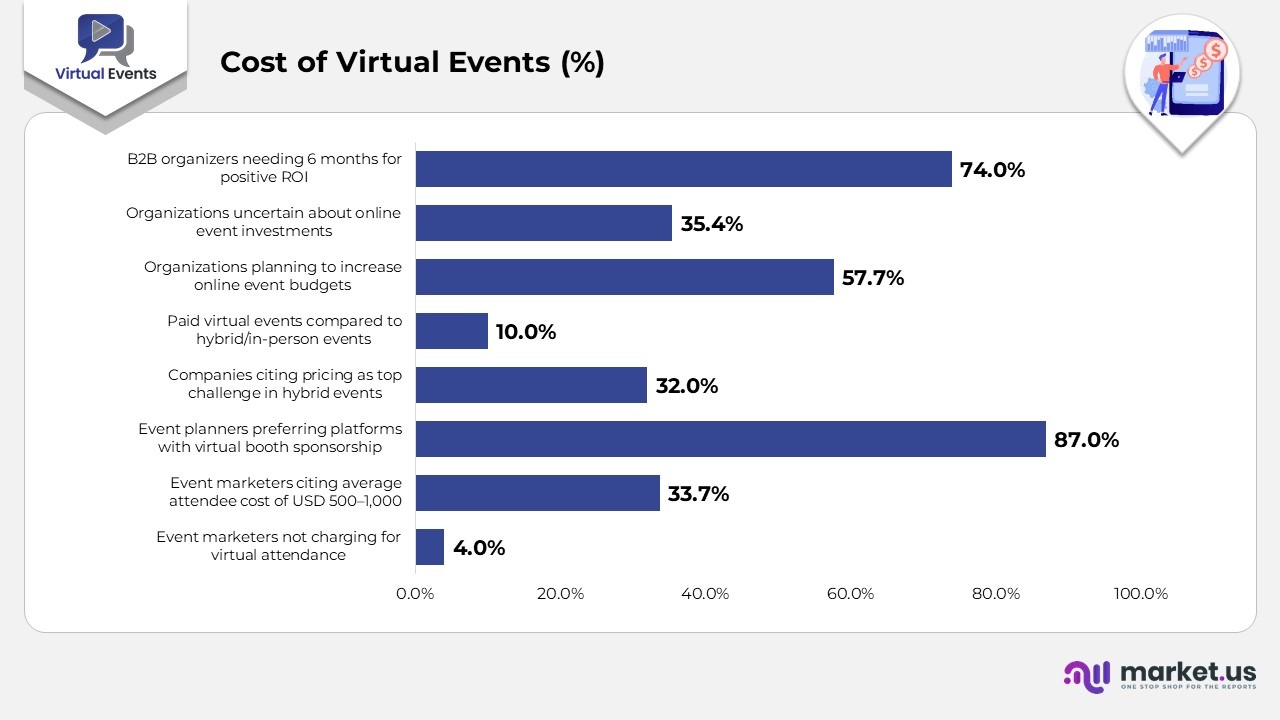
- Around 4% of event marketers do not charge any fee for virtual event attendance, reflecting the accessibility and inclusivity of online formats.
- Hosting a small virtual event with approximately 10–100 participants typically costs between USD 50 and USD 250 per month, while large-scale events with 500–2,500+ attendees may require budgets ranging from USD 625 to USD 8,000 per month.
- Approximately 7% of event marketers report that the average cost per attendee for virtual events ranges from USD 500 to USD 1,000, indicating the premium placed on high-quality production and engagement.
- The average sponsorship package for a virtual event is valued at approximately USD 8,456, underscoring the growing importance of sponsorships in event monetization.
- Nearly 87% of event planners prefer using platforms that support virtual booth sponsorships, allowing brands to showcase their products and connect with attendees effectively.
- Approximately 32% of companies identify pricing challenges as their primary obstacle when managing hybrid events, underscoring the complexity of balancing virtual and in-person costs.
- The cost of small virtual events (up to 250 attendees) generally ranges between USD 3,000–15,000, while larger events may cost anywhere from USD 5,000–30,000, depending on technology, production, and scale.
- Only 10% of virtual events are paid, compared to more than 25% of hybrid or in-person events, illustrating the dominance of free-access online formats.
- Around 7% of organizations plan to increase their budgets for online events, while 35.4% remain uncertain about future investments.
- Nearly 74% of B2B virtual event organizers report needing 6 months to achieve a positive return on investment (ROI), indicating that long-term engagement and post-event conversions are key to profitability.
(Source: EventMB, Markletic, Bizzabo, LAI Live, Statista)
Virtual Events Attendance, Engagement, and Audience Behavior Trends Statistics
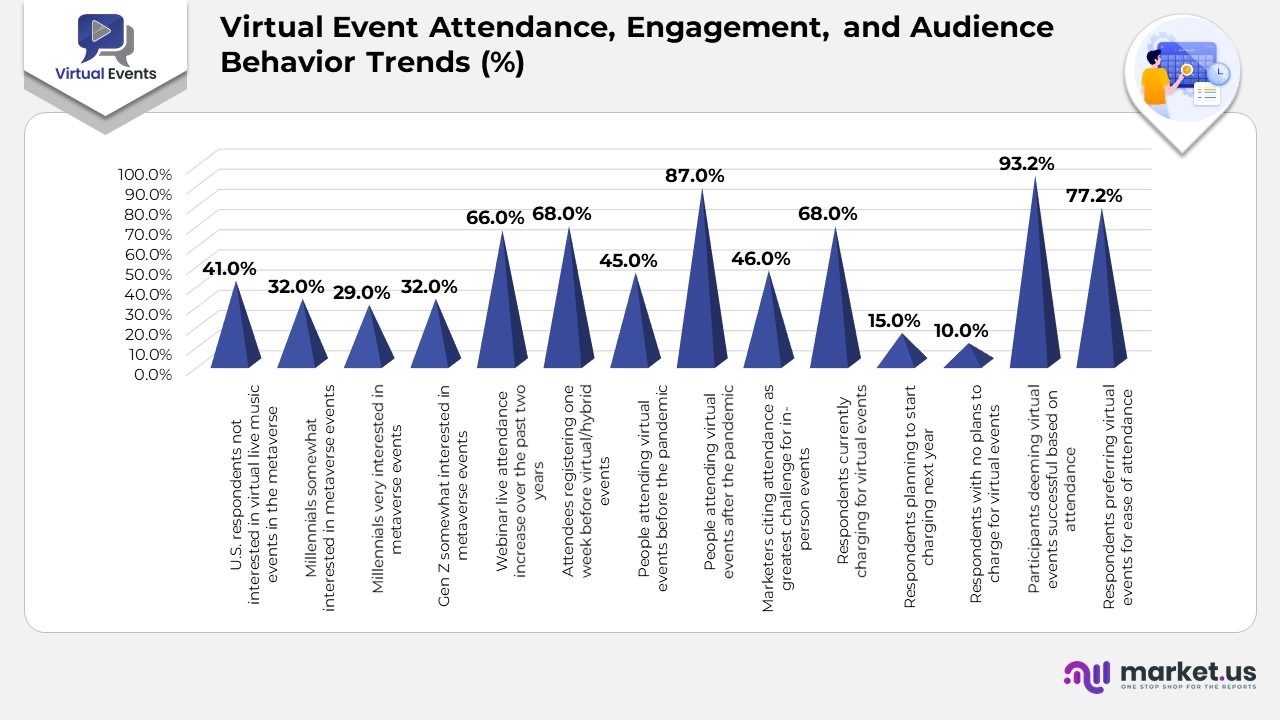
- Around 41% of U.S. respondents expressed no interest in attending virtual live music events in the metaverse, while 32% of Millennials were somewhat interested, 29% were very interested, and 32% of Gen Z were somewhat interested, with Baby Boomers being the least interested.
- Over the past two years, live webinar attendance has increased by 66%, indicating strong growth in online participation engagement.
- More than 68% of attendees register for virtual or hybrid events one week before the event date, reflecting spontaneous decision-making behavior.
- Before the pandemic, only 45% of people attended virtual events; this number rose to 87% following COVID-19, marking a major behavioral shift.
- For 46% of marketers, attendance remains the greatest challenge in organizing in-person events.
- The average number of attendees for virtual events is 1,356, compared to 908 for traditional in-person meetings.
- Around 68% of respondents currently charge for virtual events and plan to continue doing so, while 15% plan to start charging next year, and 10% have no plans to charge.
- Nearly 93.2% of participants considered their virtual events successful based on attendance metrics.
- Approximately 77.2% of respondents prefer virtual events because of their ease of attendance and flexibility.
(Source: Statista, Bizzabo, Markletic, EventMB, LAI Live)
Virtual Events Engagement Trends Statistics
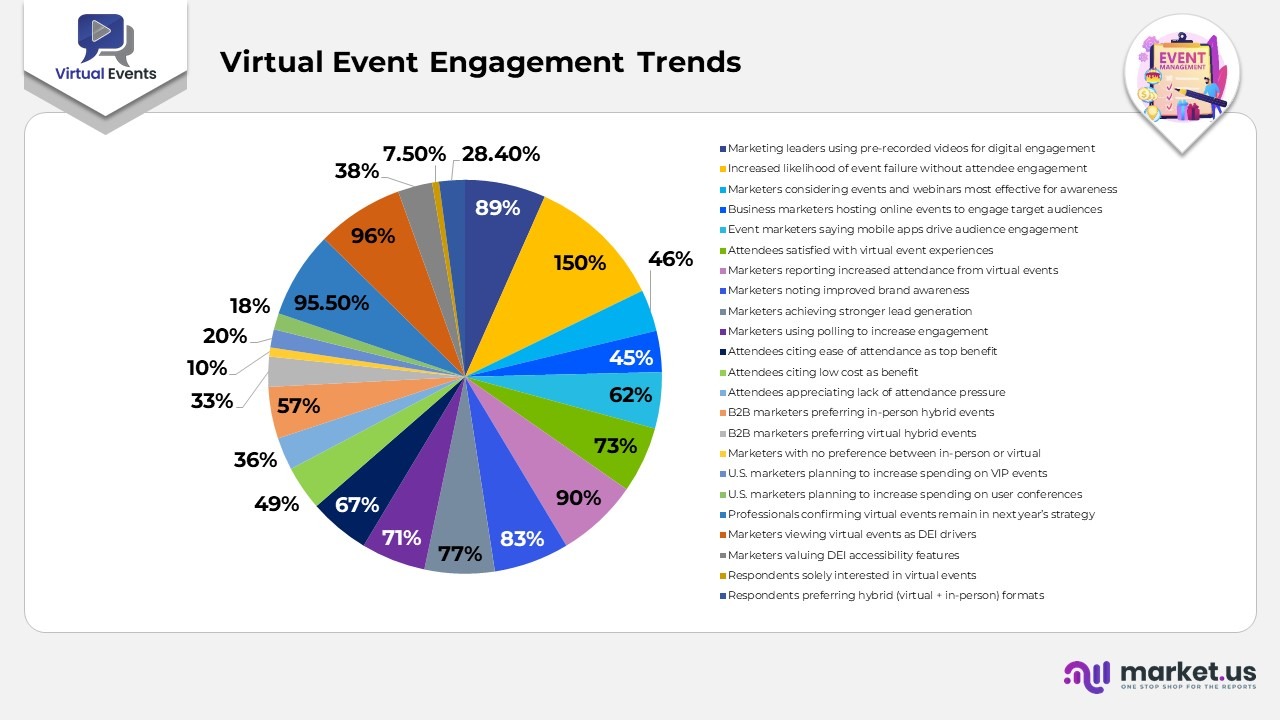
- Approximately 89% of marketing leaders incorporate pre-recorded videos into their digital consumer engagement strategies.
- Virtual events are 150% more likely to be unsuccessful when they lack attendee engagement, emphasizing the importance of interaction-driven formats.
- Nearly 46% of marketers believe that events and webinars are the most effective tools for generating product awareness and customer interest.
- About 3% of business marketers host online events primarily to engage with their target audience.
- Around 62% of event marketers say that a mobile app helps determine audience engagement in virtual events.
- Approximately 73% of attendees are satisfied with their virtual event experiences, showing consistent participant approval.
- Virtual events deliver strong outcomes, with 90% of marketers reporting increased attendance, 83% noting improved brand awareness, and 77% achieving stronger lead generation results.
- Nearly 71% of marketers use polling to increase audience engagement during virtual sessions.
- According to 67% of virtual event attendees, the top benefit is ease of attendance, followed by 49% citing low cost, and 36% appreciating the lack of pressure to attend in person.
- Over 57% of B2B marketers prefer attending the in-person version of a hybrid event, while 33% favor the virtual version, and 10% have no preference.
- Roughly 20% of U.S. marketers plan to increase spending on VIP events, 18% on user conferences, while none intend to raise budgets for virtual events.
- A significant 5% of professionals confirmed that virtual events will remain part of their event strategy in the coming year.
- About 96% of marketers view virtual events as a key driver for advancing DEI goals, with 38% valuing accessibility features such as captions, sign language, and audio descriptions.
- Only 5% of respondents are solely interested in hosting virtual events, while 28.4% prefer combining virtual and in-person elements for hybrid formats.
(Source: Statista, Bizzabo)
Virtual Events Promotion Statistics
- Approximately 52% of event planners utilise Facebook as their primary marketing channel for promoting virtual events.
- Nearly 27% of organisations that avoided virtual events cited uncertainty about how to attract attendees as the reason.
- About 52% of organizations reported equal or higher attendance compared to in-person events.
- Approximately 70% of organizations that achieved significantly higher attendance credited the inclusion of a guest speaker.
- Around 76% of marketers identify email marketing as the most effective tool for driving event registrations.
(Source: EventMB, WildApricot, Markletic)
Virtual Event Statistics By Technology
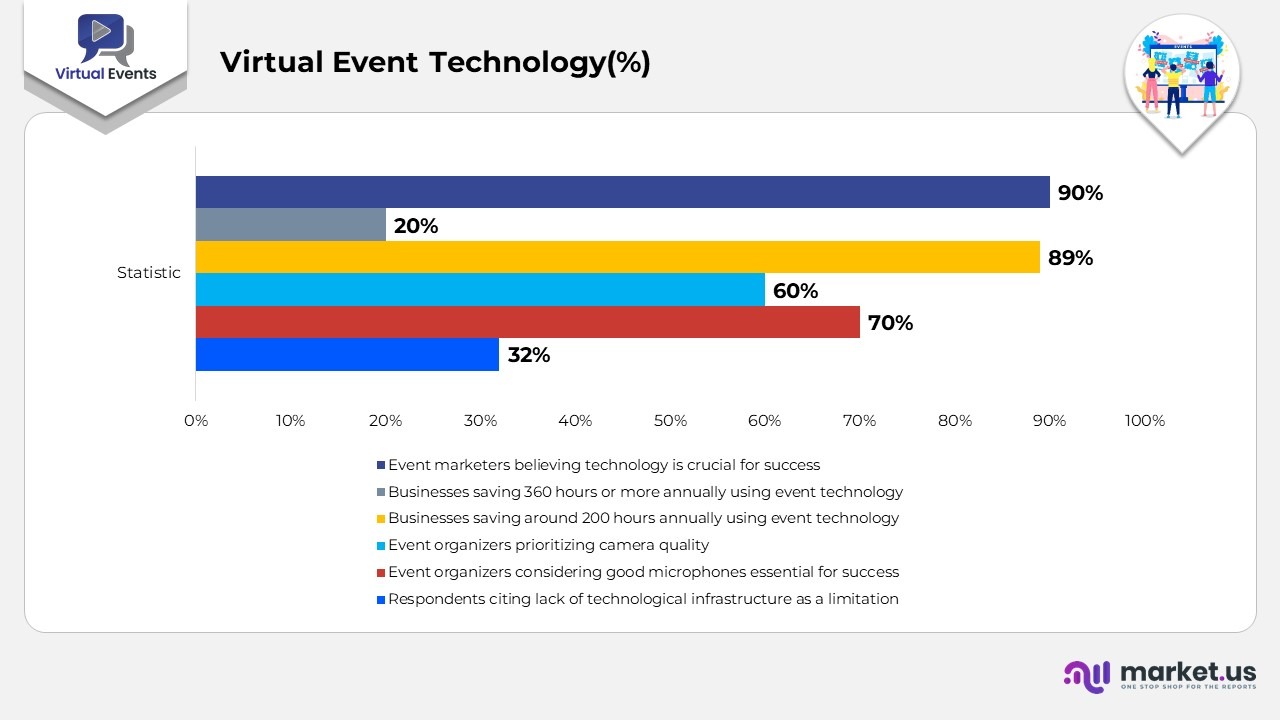
- Around 32% of respondents who did not host virtual events cited the lack of technological infrastructure as a major limitation.
- Nearly 70% of event organizers consider good microphones essential for event success, compared to 60% who prioritize camera quality.
- Approximately 89% of businesses using event technology save about 200 hours annually, while 20% save 360 hours or more.
- The biggest frustration during virtual events remains poor internet connectivity.
- Around 90% of event marketers believe technology plays a crucial role in enhancing overall event success.
(Source: WildApricot, Markletic, Bizzabo)
Virtual Events Return On Investment Statistics
- Approximately 84% of organizations that hosted virtual events reported lower expenses compared to those hosting in-person events.
- There is no direct correlation between event spending and revenue generation.
- Successful revenue generators were 46% more likely to feature a donation page throughout their virtual events.
- Organizations that met or exceeded their revenue goals tended to charge admission and secure sponsorships.
(Source: WildApricot)
Why Virtual Events Continue to Stay Popular: Statistics
- Around 77.2% of respondents cited ease of attendance as the primary reason for preferring virtual events.
- Nearly 64.9% valued the global reach of virtual events, which allows participants from different regions to connect without the barriers of travel.
- About 47.4% of participants considered low cost a major factor influencing their decision to attend.
- Approximately 14% of respondents considered sponsorship opportunities the most appealing aspect of virtual events.
- Approximately 62% of attendees attended virtual events for educational or informational purposes.
- Approximately 26% joined primarily for networking opportunities.
- Nearly 10% of participants chose virtual events purely for fun and entertainment.
(Source: vFairs, Statista)
Virtual Events Planning and Scheduling Trends Statistics
- Around 65% of event planners have never participated in organizing a virtual event, revealing a significant learning gap in digital event management.
- Nearly 74% of brand marketers believe they need to invest more in digital solutions such as online marketing expertise, while 59% emphasize the need for improved data solutions like analytics tools and ROI measurement systems.
- About 69% of marketers plan their webinars at least 3 months in advance, indicating that strategic scheduling is key to successful audience engagement.
- Approximately 68% of event marketers view hybrid event platforms—capable of managing virtual and in-person experiences as essential to their upcoming strategies.
- The most popular day to host a webcast is Thursday, while those scheduled on Friday achieve the longest viewing duration.
- The preferred day for hosting virtual events is Wednesday, aligning with midweek engagement peaks.
- The optimal time to run a webinar is 11 a.m. PST (2 p.m. EST), as it minimizes scheduling conflicts across major U.S. time zones.
(Source: Event Manager Blog, Freeman, ON24, Bizzabo, Intrado)
Virtual Event Marketing Strategy and Promotion
- Around 48% of organizations reported that their CEO is now more actively involved in shaping the marketing strategy for virtual and digital events.
- For small virtual events, planners typically require 3–6 weeks for effective promotion, whereas 65% of marketers managing large events need more than six weeks to achieve desired registration levels.
- Approximately 65% of organizers deliver up to five marketing touches per webinar experience to maximize participation and engagement.
- Approximately 76% of marketers consider email marketing the most effective channel for driving event registrations.
- Mid-week emails sent on Tuesday, Wednesday, and Thursday account for nearly 65% of total webinar registrations.
- The average no-show rate for virtual event attendees stands at 35%, reflecting the challenge of maintaining live participation.
- For webcast attendance:
- 39% of registrants attend live.
- 12% of those who missed the live session view it on-demand.
- 9% of live attendees return to view the on-demand content.
- Overall, 25% of total attendees engage on demand.
- For virtual event attendance:
- 45% of registrants attend live.
- Approximately 10% of those who miss live sessions watch the on-demand content.
- 17% of live attendees rewatch content on demand.
- 20% of total attendees participate on-demand.
- Over 33% of marketers find it challenging to integrate sponsors effectively into digital event programs.
(Source: Freeman, Markletic, ON24, Intrado)
Attendee Engagement and Content Design Trends in Virtual Events
- Around 81% of professionals agree that digital events must integrate networking and engagement opportunities alongside educational content to keep participants involved.
- Nearly 66% of those hosting digital experiences identify audience engagement as their biggest challenge, primarily due to distractions, limited networking opportunities, poorly adapted content, and minimal interaction.
- On average, 55% of registered participants successfully convert into active attendees, showing steady engagement rates for virtual formats.
- For webcast participation:
- The average view time for a live 60-minute webcast is 46 minutes.
- The average view time for an on-demand 60 -minute webcast is 31 minutes.
- About 50% of top-performing marketers use Simulive webinar features, combining pre-recorded content with live interaction to enhance engagement.
- Nearly 70% of webinars include downloadable resources or interactive materials to sustain participant involvement.
- Around 86% of online events are accessed via desktops or laptops, while mobile access continues to rise, growing by 2% in 2019.
(Source: Freeman, ON24, Intrado, Communiqué)
In-Person and Hybrid Event Planning Statistics
- Nearly 9 out of 10 event planners anticipate a rise in both onsite and offsite in-person meetings in 2025, signaling a steady rebound in physical events as global restrictions ease and networking demand resurges.
- In-person gatherings continue to dominate attendee preferences, with 8 in 10 participants favoring live events over virtual or hybrid formats due to the tangible experience and stronger relationship-building opportunities they provide.
- By early 2024, event professionals planned to attend an average of 4 regional trade shows, slightly down from 46 the previous year. Despite this minor dip, participation remains significantly higher than the pre – 2019 average of fewer than 30 shows per year, indicating a long-term market recovery.
- Around 87% of attendees consider discovering new products a key reason for attending live events. In comparison, 65% say in-person interactions help them better understand offerings—underscoring the continued importance of experiential marketing.
- Cost remains a defining factor in venue selection, with 97% of planners willing to switch to a secondary venue for savings of 20% or less, yet 94% would pay more for preferred venues, highlighting the strength of established planner–venue relationships.
Moreover
- The largest expense areas for planners include food and beverages (73%), audiovisual setups (66%), and venue costs (29%), reflecting the shift toward immersive, high-quality event experiences.
- Approximately 26% of planners report that a poor attendee experience would deter them from returning to a venue, prompting an increased focus on service quality and attendee comfort.
- Nearly 49% of planners are sourcing unique or special event venues, marking a 32% rise since 2023. This trend is driven by efforts to elevate attendee engagement (34%) and optimise budgets (37%) through competitive pricing and strategic location choices.
- Rising operational costs remain a concern, with 65% citing higher-than-expected food and beverage prices and 61% facing increased accommodation expenses when sourcing venues.
- For most planners, the ideal request-for-proposal (RFP) response time from hotels or venues is under four days, yet 39% report delays in communication—often linked to industry-wide staffing shortages, as acknowledged by 32% of respondents.
- Venue sourcing challenges persist, with 23% of planners citing difficulty assessing whether a space fits their event needs, and 21% struggling to evaluate venue specifications, technical capabilities, and available amenities effectively.
(Source: Cvent, Statista)
Conclusion
Virtual events have evolved far beyond their pandemic-driven beginnings, emerging as a transformative force in global communication and experience design. Today, they are not just digital substitutes but strategic ecosystems that blend accessibility, creativity, and measurable intelligence. The statistics reveal a powerful trend: organizations are redefining engagement by fusing data, interactivity, and human connection into seamless, borderless experiences.
The convergence of AI, analytics, and immersive technologies has transformed the way audiences engage, learn, and network. Rather than replicating physical gatherings, virtual events now extend them, creating dynamic, always-on environments that nurture continuous collaboration and brand loyalty. As hybrid and virtual experiences mature, the future of events lies in flexibility: where physical energy meets digital precision, and personalization replaces standardization. Virtual events have become the new global meeting ground, offering intelligence, inclusivity, and infinite scalability. The next phase will be defined not by the number of people attending.