
Quick Navigation
- Introduction
- Editor’s Choice
- Growth of Android Users Over the Years
- Worldwide Market Share Trends of Android vs. iOS
- Android Adoption Trends Across the United States
- Global Android Smartphone Vendor Market Breakdown Statistics
- Android Apps Statistics
- Most Downloaded Android Apps Worldwide Statistics
- Android Version Adoption and Distribution Statistics
- Current Adoption Landscape of Android Versions Worldwide Statistics
- Comparing App Spending Habits of iPhone VS Android Users Statistics
- Popular App Categories Among iPhone vs Android Users Statistics
- iOS vs Android Ratings for Leading Banking Apps Statistics
- Android App Performance for Popular Finance Apps Statistics
- Worldwide Smartphone Shipments and Market Performance
- Conclusion
Introduction
Android Statistics: Android is the world’s most widely adopted mobile operating system, supporting a vast ecosystem of smartphones across both developed and emerging markets. Its open-source structure, affordability across device categories, and deep integration with global app services continue to accelerate adoption. With billions of active users, Android has a significant impact on digital behaviour across mobile payments, entertainment, communication, and online commerce. These Android statistics highlight user patterns, market share distribution, device choices, and evolving trends that reflect how Android shapes the modern mobile landscape.
Editor’s Choice
- Android powers 3.9 billion users globally, cementing its position as the leading mobile operating system.
- It controls 73.9% of the global mobile OS market, demonstrating strong worldwide penetration.
- In the US, Android holds a 42.51% share of the mobile operating system market.
- 24.51% of the Android version market is led by Android 14, making it the most widely used version of Android.
- Samsung leads the Android vendor ecosystem with a 30.8% market share.
- The platform supports over 3.5 billion active users worldwide.
- Nearly 3-quarters of all smartphones globally run on Android.
- More than 1 billion Android smartphones were shipped over the last year.
- Samsung remains the top Android manufacturer, followed by Xiaomi and Oppo as major contributors to global shipments.
- Android holds 72% of the global smartphone market, while iOS accounts for 28%.
- Android’s market share has risen by 70% since 2009, whereas iPhone’s share has fallen by 9%.
- Globally, 2x more people use Android devices than iPhones.
Moreover
- Both platforms attract users of all genders, but men tend to lean more toward Android, while women show a slight preference for iPhones.
- Even with Android’s broad global reach, Gen Z and Millennials remain more inclined toward iPhones.
- The average annual income is higher for iPhone users, at $53,251, compared to $37,040 for Android users.
- iPhone users spend 3x more time on their devices than Android users.
- Android enjoys 91% user loyalty, slightly higher than the 88% loyalty among iPhone users.
- Approximately 60% of iPhone users retain their devices for at least two years, whereas only 43% of Android users do the same.
- Google Play Store offers 20% more apps than Apple’s App Store.
- Gaming apps dominate both platforms; however, iOS users tend to prefer business and lifestyle apps, while Android users tend to lean toward education apps.
- Consumers spent nearly 2x more on the Apple App Store than on Google Play in 2023.
- Data recovery after security breaches is more successful for iPhone users at 75%, compared to 55% for Android users.
- Almost 50% of iPhone workers consider AI features important when purchasing a phone, compared to 2 in 10 Android users.
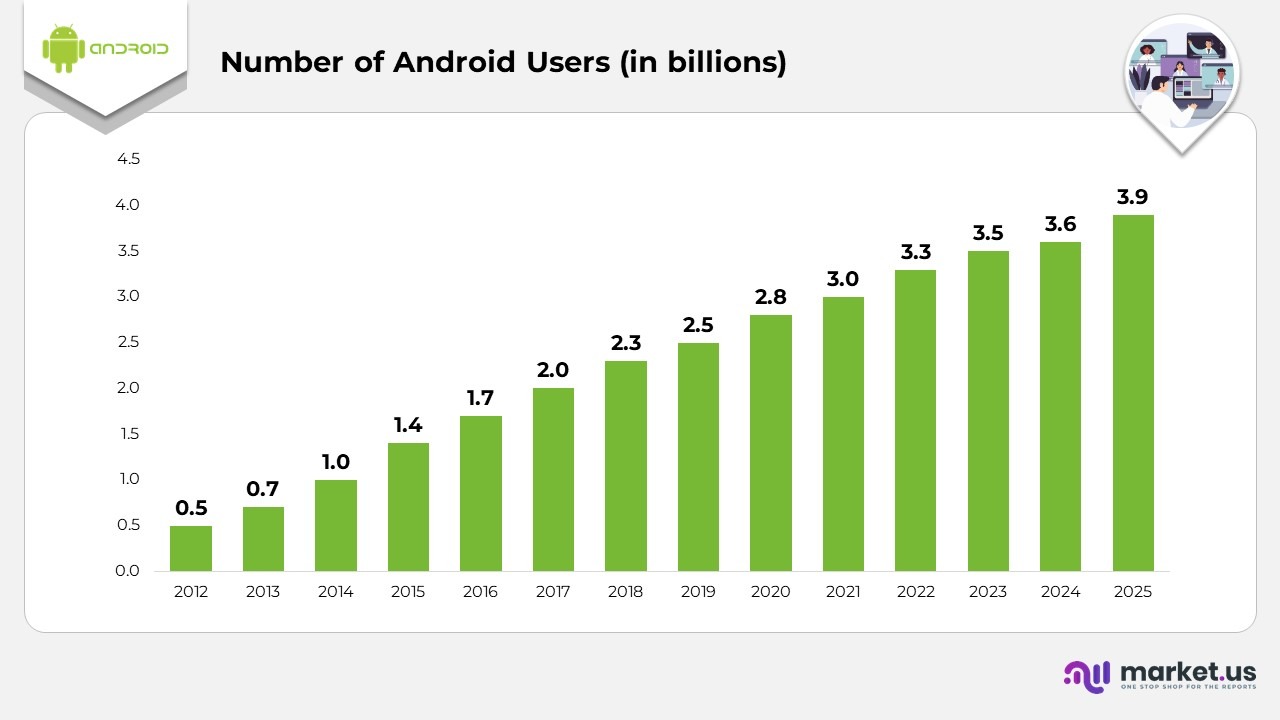
Growth of Android Users Over the Years
- Today, the global Android community exceeds 9 billion users, making it the most widely used mobile OS worldwide.
- Android first appeared in 2008, with a broader public rollout in 2011, marking the start of its rapid global expansion.
- Within just one year of rollout, Android reached 500 million users in 2012, reflecting strong early adoption.
- Android crossed the 1 billion user milestone in 2014, establishing its dominance in the smartphone industry.
- Over the years, Android has shown consistent annual growth, adding hundreds of millions of users each year.
- In 2012, the Android user base reached 5 billion, marking the early phase of global adoption.
- By 2013, the number of users had grown to 0.7 billion, reflecting an accelerating expansion.
- In 2014, Android crossed the 1 billion milestone, solidifying its dominance.
- The user count reached 1.4 billion in 2015, demonstrating strong year-over-year momentum.
- Android users increased to 7 billion in 2016, driven by the affordability of smartphones.
- In 2017, the user base reached 2 billion, doubling in just five years.
- Numbers rose further to 3 billion in 2018 as adoption expanded across emerging markets.
- Android reached 5 billion users in 2019, maintaining consistent growth.
- The user base grew to 8 billion in 2020, supported by rising digital connectivity.
- In 2021, Android surpassed 3 billion users worldwide.
- Usage expanded to 3 billion in 2022, driven by wider smartphone penetration.
- The count increased to 5 billion in 2023, reflecting the continued strength of the ecosystem.
- In 2024, the number of Android users reached 6 billion, nearing the 4 billion mark.
- By 2025, the global Android community reached 9 billion, marking its highest adoption level to date.
(Source: AppMySite, Demandsage, Business of Apps)
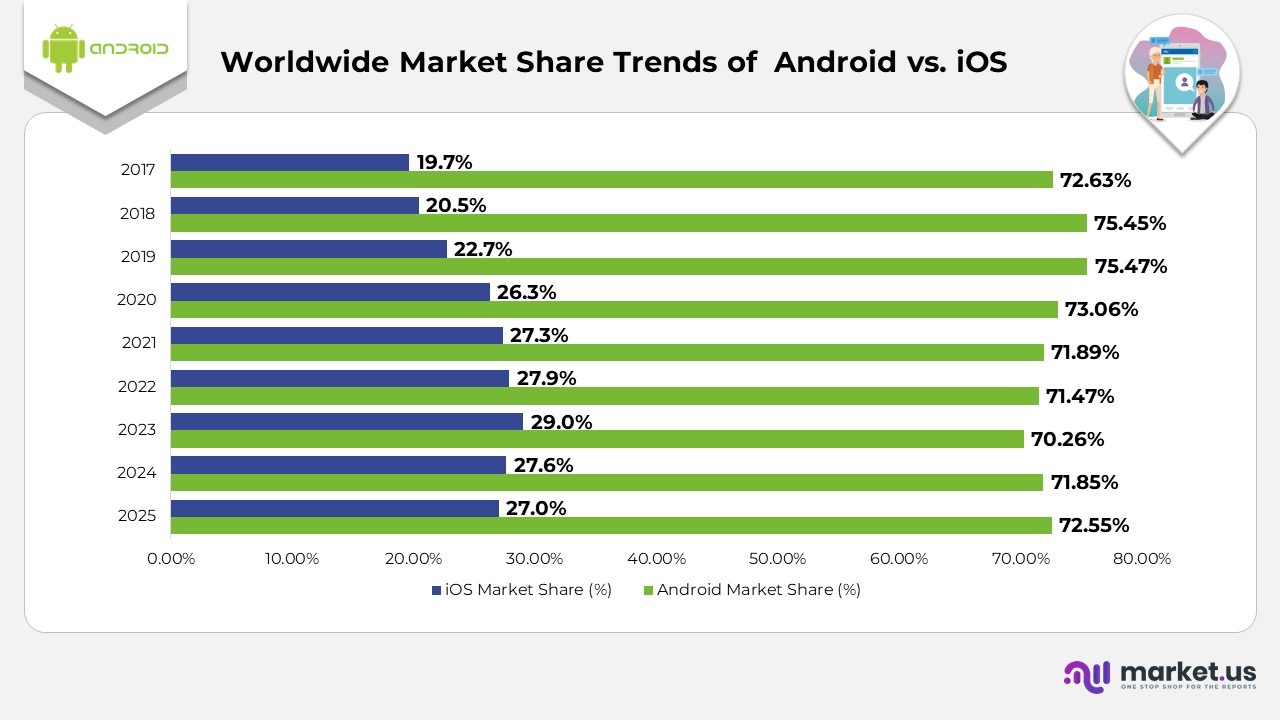
- Globally, Android controls nearly 72% of the smartphone operating system market, while iOS accounts for around 28%, indicating a long-standing competitive balance.
- In 2025, Android leads with 72.55%, whereas iOS holds 27.04%, reflecting Android’s continued dominance.
- The 2024 figures show Android at 71.85% and iOS at 27.6%, indicating slight year-to-year shifts but stable competition.
- In 2023, Android captured 70.26%, while iOS climbed to 29.02%, marking one of its strongest years to date.
- In 2022, Android’s market share reached 71.47%, compared to iOS at 27.85%, maintaining a familiar gap.
- The 2021 distribution saw Android at 71.89% and iOS at 27.34%, continuing their global pattern.
- In 2020, Android’s market share rose to 73.06%, while iOS followed at 26.28%, indicating strong momentum for Android.
- The 2019 market showed Android at 75.47% and iOS at 22.71%, one of the widest margins between the two.
- In 2018, Android had a 75.45% share, with iOS at 20.47%, highlighting a peak year for Android’s market share.
- For 2017, Android held a 72.63% market share, compared to iOS at 19.65%, reflecting early-stage competition in the decade.
(Source: StatCounter, DemandSage)
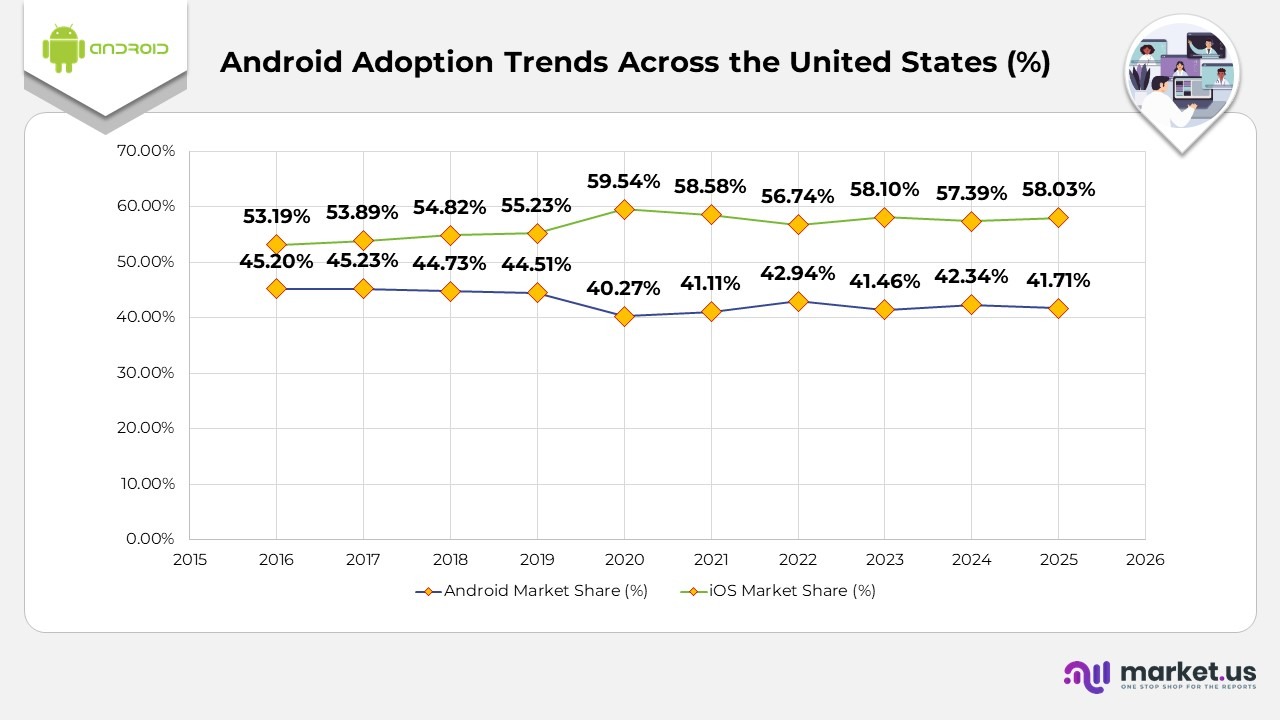
Android Adoption Trends Across the United States
- In the United States, Android accounts for 34% of the mobile OS market, while iPhones lead with 57.39%, reflecting a strong preference for Apple devices.
- For 2025, Android holds 71%, compared with iOS at 58.03%, showing consistent national trends.
- In 2024, Android stands at 34%, while iOS maintains 57.39%, continuing Apple’s lead.
- In 2023, Android captured 41.46%, while iOS accounted for nearly 1%.
- In 2022, Android’s market share rose to 42.94%, while iOS recorded 74%.
- The 2021 market reflected Android at 11%, compared with iOS at 58.58%, showing a minor gap expansion.
- For 2020, Android posted 27%, while iOS reached 59.54%, reinforcing Apple’s stronger US footprint.
- In 2019, Android held 51%, as iOS stood at 55.23%, indicating a more balanced split than today.
- During 2018, Android represented 73%, while iOS accounted for 54.82%, maintaining a tighter spread.
- In 2017, Android held a 45.23% market share, compared to iOS at 89%, marking one of Android’s strongest years in the US.
- For 2016, Android reached 2%, while iPhones held 53.19%, continuing Apple’s national preference trend.
(Source: StatCounter, DemandSage)
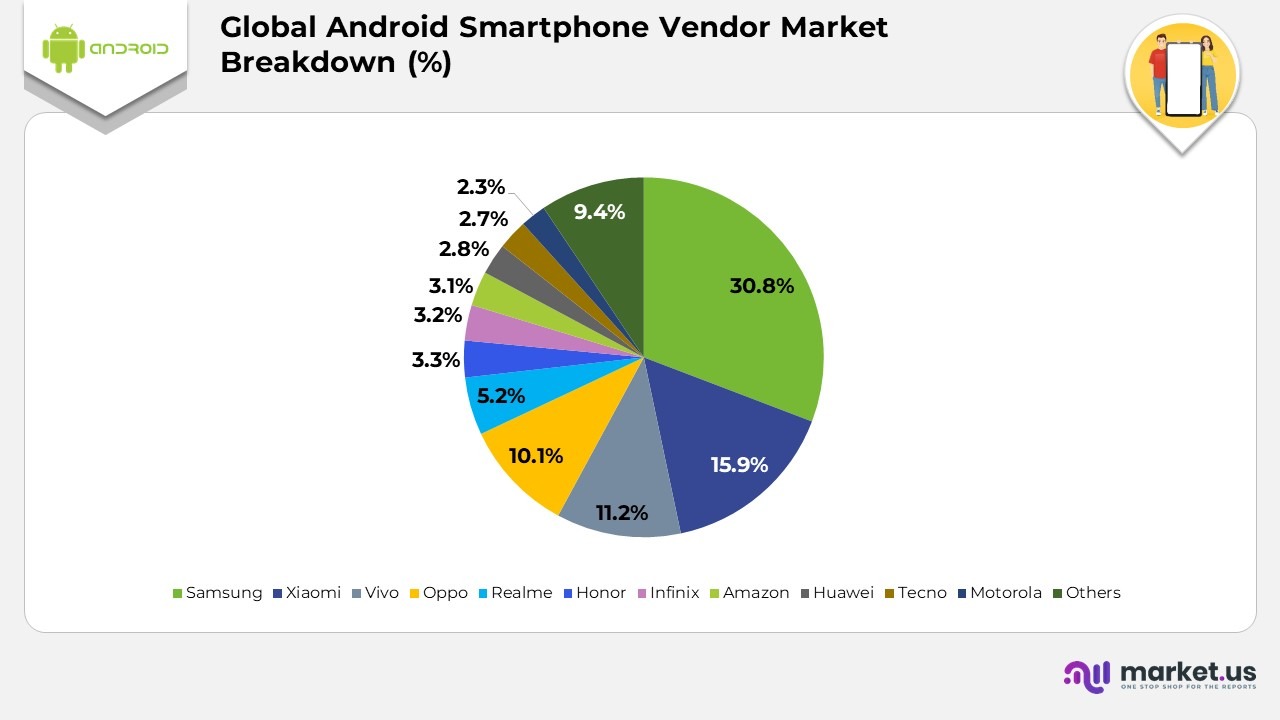
Global Android Smartphone Vendor Market Breakdown Statistics
- Samsung leads the global Android vendor landscape with a dominant 30.8% share, making it the top contributor to Android device shipments.
- Xiaomi holds the second position, capturing 15.9% of the market and maintaining strong growth across Asia and Europe.
- Vivo accounts for 11.2%, driven by strong demand for mid-range and camera-focused devices.
- Oppo follows closely with 10.1%, benefiting from its expanding portfolio and international presence.
- Realme secures 5.2% market share, driven by budget-friendly models targeted at younger consumers.
- Honour holds a 3.3% market share, marking a steady comeback following its brand restructuring.
- Infinix contributes 3.2%, with a particularly strong presence in Africa and select Asian markets.
- Amazon ranks with 3.1%, largely due to its Fire devices ecosystem.
- Huawei maintains a 2.8% market share, despite reduced availability in several countries.
- Tecno represents 2.7%, supported by its strong focus on emerging markets.
- Motorola holds a 2.3% market share, sustained by its affordable, US-focused lineup.
- Other Android vendors collectively account for 9.4%, representing a diverse mix of regional manufacturers.
(Source: AppBrain, DemandSage)
Android Apps Statistics
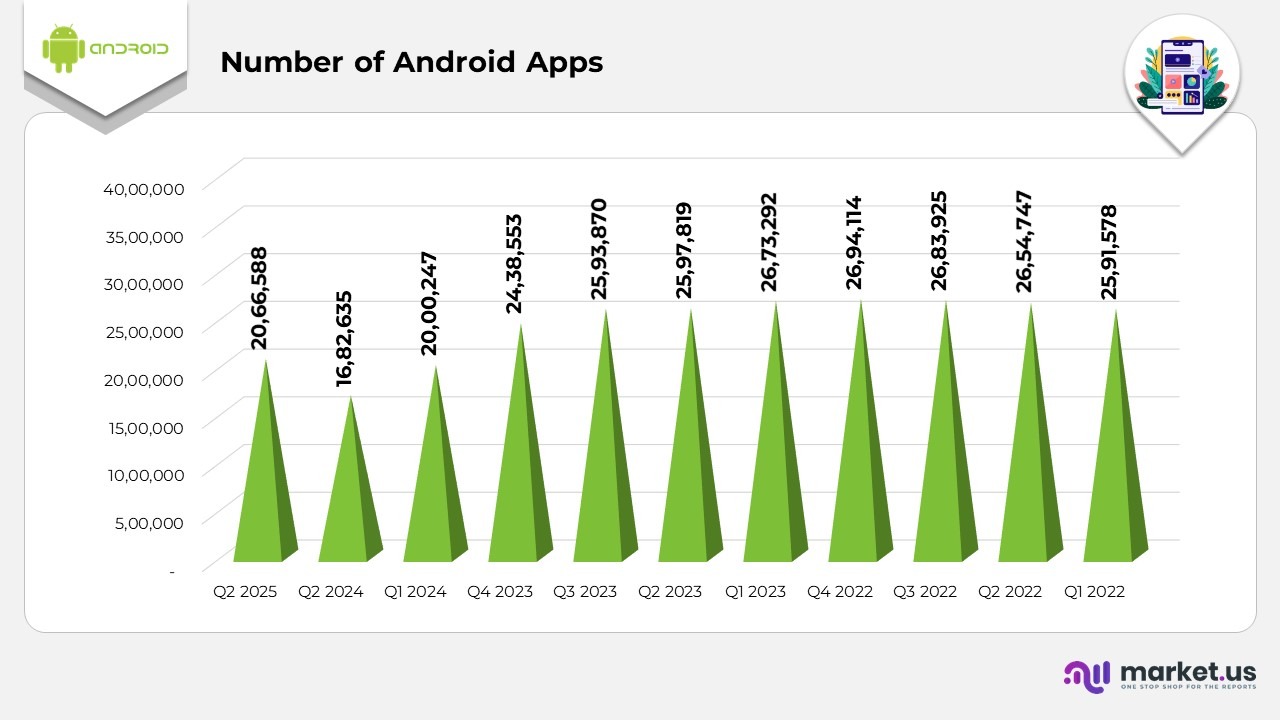
- The Google Play Store currently hosts over 06 million apps, making it one of the largest digital app ecosystems globally.
- In Q2 2025, the number of available apps reached 2,066,588, indicating a resurgence in developer activity.
- By Q2 2024, Google Play offered 1,682,635 apps, showing a slight dip before rebounding the following quarter.
- During Q1 2024, the platform listed 2,000,247 apps, marking a return to the two-million mark.
- In Q4 2023, the number of available apps stood at 2,438,553, driven by strong releases across the gaming and utility categories.
- Q3 2023 recorded 2,593,870 apps, marking a peak in yearly app availability.
- For Q2 2023, Play Store listings totaled 2,597,819, maintaining robust momentum.
- Q1 2023 saw the store hosting 2,673,292 apps, one of the highest counts in recent years.
- In Q4 2022, app availability reached 2,694,114, reflecting sustained expansion.
- Q3 2022 recorded 2,683,925 apps, maintaining a stable catalog size.
- During Q2 2022, the Play Store featured 2,654,747
- In Q1 2022, listings stood at 2,591,578, marking the early stages of continued growth.
(Source: AppBrain, DemandSage)
Most Downloaded Android Apps Worldwide Statistics
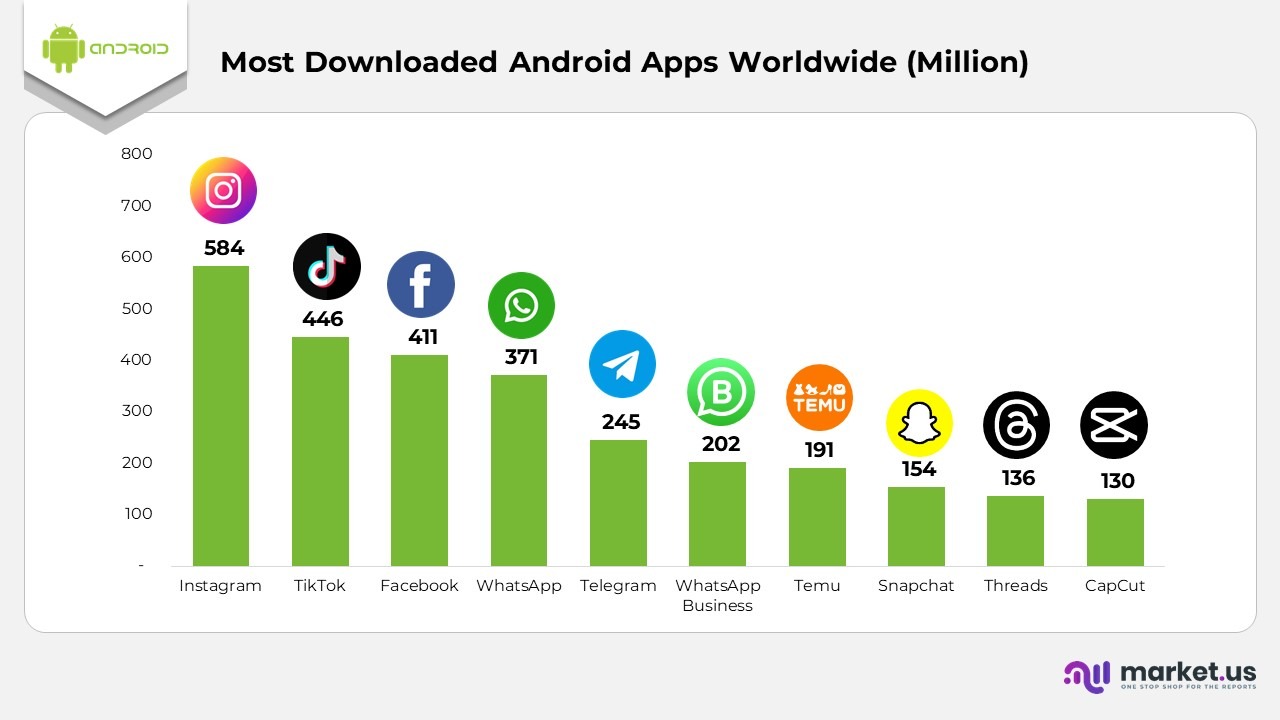
- Instagram leads the global Google Play rankings with 584 million downloads, making it the most downloaded Android app worldwide.
- TikTok follows in second place with 446 million downloads, maintaining its strong global user pull.
- Facebook ranks third, recording 411 million downloads across Android devices.
- WhatsApp remains one of the top communication apps, with 371 million.
- Telegram continues to grow, reaching 245 million downloads in the Play Store.
- WhatsApp Business has gained significant traction among small enterprises, crossing 202 million.
- Temu stands out in the e-commerce segment with 191 million.
- Snapchat continues to attract younger audiences, reaching 154 million.
- Threads has amassed 136 million downloads, driven by users seeking text-based social interaction.
- CapCut, a popular video editing app, has achieved 130 million global downloads.
(Source: DesignRush, DemandSage)
Android Version Adoption and Distribution Statistics
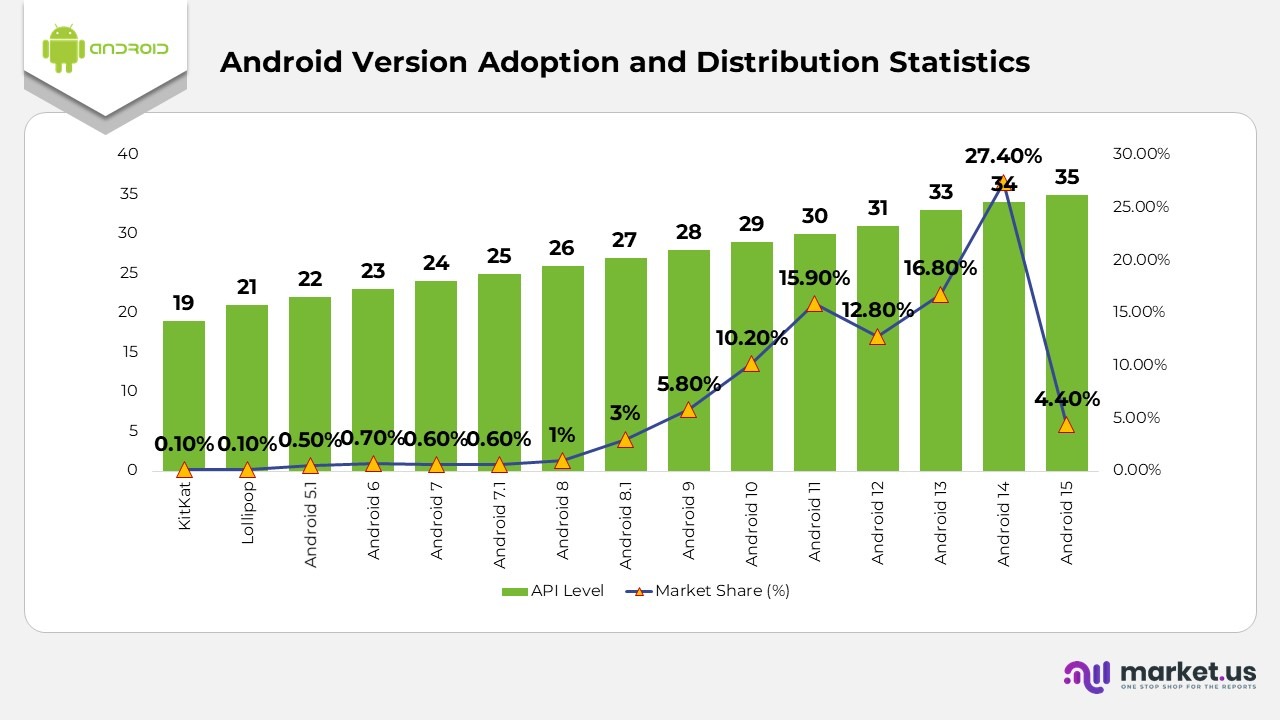
- Older Android versions, such as KitKat (API 19) and Lollipop (API 21), each account for only 1% of active devices.
- Android 5.1 (API 22) remains on 0.5% of devices, while Android 6 (API 23) maintains a 7% distribution.
- Both Android 7 (API 24) and Android 7.1 (API 25) hold 6% each, reflecting minimal legacy usage.
- Android 8 (API 26) represents 1%, with Android 8.1 (API 27) slightly higher at 3%.
- Android 9 (API 28) remains present on 8% of devices, marking one of the strongest older versions of the operating system.
- Android 10 (API 29) remains widely used, accounting for 10.2% of the market share.
- Android 11 (API 30) powers 9% of devices, making it one of the most widely used versions in circulation.
- Android 12 (API 31) accounts for 8%, maintaining a stable adoption rate.
- Android 13 (API 33) remains strong with 8% distribution across active devices.
- Android 14 (API 34) leads the market with 4%, making it the most used version currently.
- The latest Android 15 (API 35) has already reached 4%, showing growing early adoption.
(Source: Composable Horizons LLC)
Current Adoption Landscape of Android Versions Worldwide Statistics
- Legacy versions such as Android KitKat (API 19) and Android Lollipop (API 21) each account for just 1% of active devices.
- Android 5.1 (API 22) still appears on 5% of devices.
- Android 6 (API 23) represents 7% of the current distribution.
- Android 7 (API 24) and Android 7.1 (API 25) each hold 6%, reflecting limited remaining usage.
- Android 8 (API 26) stands at 1%, while Android 8.1 (API 27) captures 3%.
- Android 9 (API 28) is present on 8% of active devices.
- Android 10 (API 29) continues to maintain a strong share at 2%.
- Android 11 (API 30) powers 9% of devices globally.
- Android 12 (API 31) accounts for 8% of the user base.
- Android 13 (API 33) shows solid adoption with 8% usage.
- Android 14 (API 34) leads all versions with a dominant 4% share.
- The latest Android 15 (API 35) has already reached 4%, indicating steady early adoption.
(Source: Composable Horizons LLC)
Comparing App Spending Habits of iPhone VS Android Users Statistics
- Consumer spending on mobile apps is projected to reach $142 billion on the App Store in 2025, while spending on Google Play among Android users is expected to total $65 billion.
- In 2025, iPhone users are expected to account for 6% of all global mobile app spending, with Android users contributing the remaining 31.4%.
- In 2021, App Store purchases amounted to $85 billion, compared to Google Play’s $47 billion.
- Spending increased in 2022, with iPhone users reaching $92 billion, while Android users recorded $45 billion.
- By 2023, App Store spending climbed to $108 billion, and Google Play spending rose to $51 billion.
- In 2024, consumer purchases are estimated at $124 billion on the App Store and $58 billion on Google Play.
- For 2025, spending is forecasted at $142 billion for iPhone users and $65 billion for Android users.
- Looking ahead to 2026, App Store spending is projected to hit $161 billion, while Google Play spending is expected to reach $72 billion.
(Source: Sensor Tower, Semrush Inc)
Popular App Categories Among iPhone vs Android Users Statistics
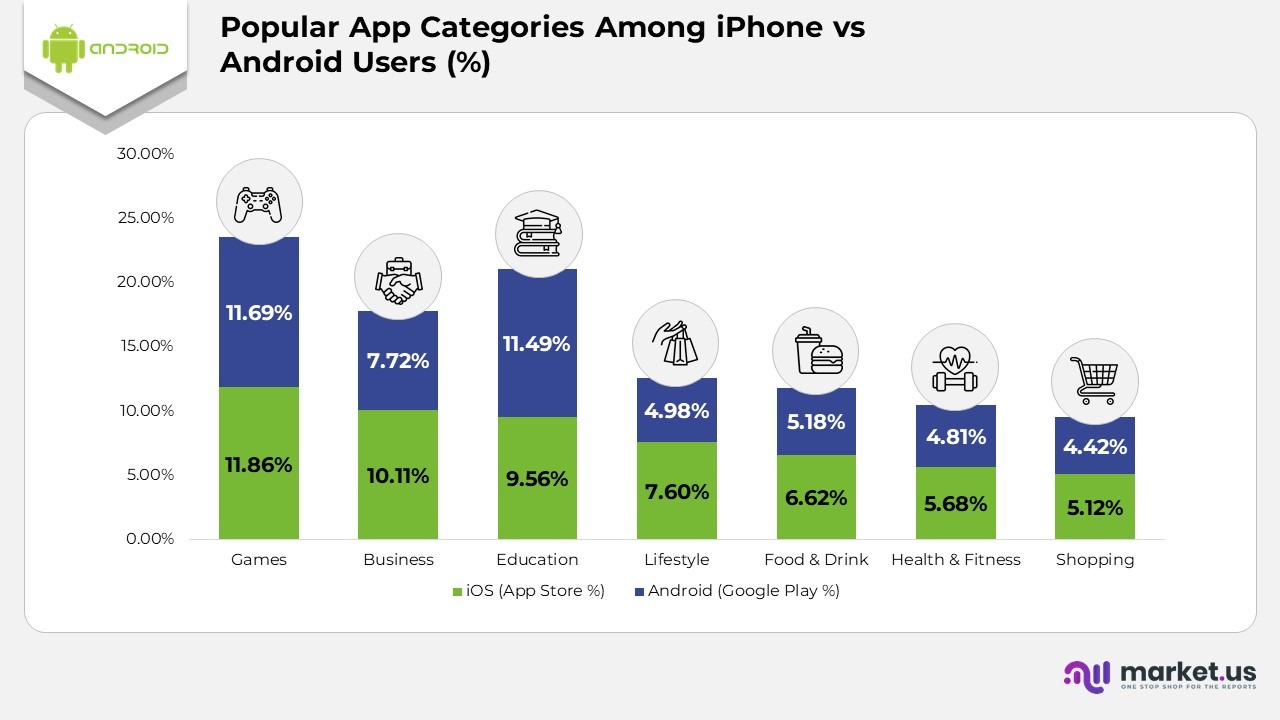
- Games are the top choice on both platforms, accounting for 11.86% of App Store apps and 11.69% on Google Play.
- iPhone users show a strong interest in business apps, which hold 10.11%, followed by education apps at 9.56%.
- Other notable categories for iOS include lifestyle at 7.6%, food & drink at 6.62%, health & fitness at 5.68%, and shopping apps at 5.12%.
- Android users favor education apps the most, with 11.49% choosing them slightly more than the gaming category.
- Business apps on Android account for 7.72% of users, making them the second-most-preferred category on the platform.
- Food & drink apps hold 5.18% among Android users, while health & fitness apps represent 4.81%.
- Lifestyle apps account for 4.98% of Android usage, and shopping apps are used by 4.42%, both of which are lower than their iOS counterparts.
- Overall, preference patterns differ across platforms, but gaming clearly dominates on both the App Store and Google Play.
(Source: neontri)
iOS vs Android Ratings for Leading Banking Apps Statistics
- Bank of America holds an iOS rating of 8 and an Android rating of 4.6, with iPhone users reporting better stability than Android users.
- PNC scores 9 on iOS and 4.7 on Android, supported by smoother budgeting tools on iPhones and slower updates on Android.
- Chase is rated 8 on iOS and 4.5 on Android, with iOS users noting stronger performance while Android users experience slowdowns and freezes.
- Capital One receives 9 on iOS and 4.5 on Android, as iPhone users find transfers more reliable and Android reviews mention recurring bugs.
- Wells Fargo earns 9 on iOS and 4.7 on Android, where both platforms perform well, but Android users report minor inconsistencies.
- Ally Bank holds a rating of 4.7 on iOS and 4.4 on Android, with iOS users praising the usability while Android users feel the app is less feature-rich.
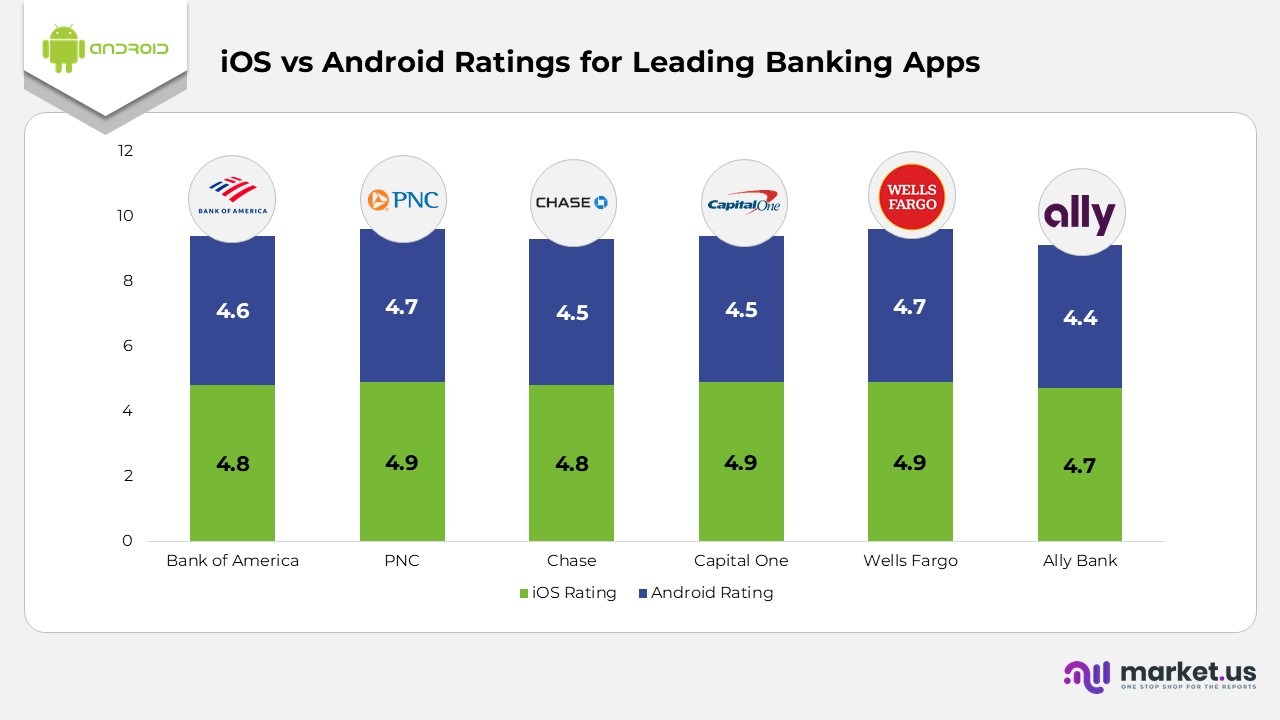
(Source: neontri)
Android App Performance for Popular Finance Apps Statistics
- PayPal holds an Android rating of 0, with users reporting interface issues and occasional reliability problems.
- Revolut is rated 8 on Android, though users mention the app feels more complex compared to the iOS version.
- Robinhood carries an Android score of 2, with feedback highlighting small glitches and less stability.
- Coinbase has an Android rating of 4, and users commonly cite delays during the verification process.
- Monzo receives a rating of 7 on Android, but reviewers point out bugs and missing features compared to iOS.
- Venmo is rated 1 on Android, with users frequently noting bugs and slower update rollouts.
(Source: neontri)
Worldwide Smartphone Shipments and Market Performance
- Samsung led global shipments in Q2 2025 with 0 million units and a 19.7% market share, rising from 53.8 million units and 18.4% a year earlier, achieving 7.9% year-over-year growth.
- Apple ranked second with 4 million shipments and a 15.7% share, slightly up from 45.7 million units and 15.6% in Q2 2024, marking a modest 1.5% annual increase.
- Xiaomi shipped 5 million devices, maintaining a 14.4% market share, which is nearly unchanged from the 42.3 million units and 14.5% share reported the previous year, indicating a slight 0.6% growth rate.
- Vivo recorded 1 million shipments and a 9.2% share, improving from 25.9 million units and an 8.8% share last year, achieving 4.8% year-over-year growth.
- Transition shipped 1 million phones, representing an 8.5% share, which is slightly lower than the 25.5 million units and 8.7% share in Q2 2024, resulting in a 1.7% decline.
- All other brands combined shipped 1 million units with a 32.6% market share, down from 99.1 million and 33.9% last year, reflecting a -3.1% decrease.
- The global smartphone market totalled 295.2 million shipments, achieving 100% market coverage, up from 292.2 million units in the previous year, reflecting an overall growth of 1.0%.
(Source: International Data Corporation)
Conclusion
Android Statistics: Android maintains a commanding position in the global smartphone landscape, driven by its massive user community, wide range of device options, and strong foothold in both mature and emerging markets. Its continually growing app ecosystem, increasing uptake of the latest Android releases, and sustained market advantage reinforce its impact on how users interact with mobile technology worldwide.
While spending patterns, app preferences, and update behavior differ between Android and iOS users, Android’s overall scale and reach remain unparalleled. With ongoing innovation across devices and software, Android is set to play an even more influential role in shaping user behavior, digital engagement, and the future direction of the mobile industry.