Quick Navigation
- Introduction
- Editor’s Choice
- Historical Facts
- General Digital Marketing Statistics and Facts
- Email Marketing Statistics
- Social Selling Statistics
- eCommerce and Online Shopping Statistics
- SEO Statistics
- AI in Digital Marketing Statistics
- Social Media Marketing Statistics
- Influencer Marketing Statistics
- Online Advertising Statistics
- Meme Marketing Statistics
- Video Marketing Statistics
- Digital Marketing Fun Facts
- Recent Developments
- Digital Marketing Future Predictions
- Conclusion
Introduction
Digital Marketing Statistics: Digital marketing refers to the promotion of products and services through online channels and digital technologies to engage with both potential and existing customers.
It includes a diverse array of strategies, such as search engine optimisation (SEO), social media marketing, email marketing, and paid online advertising, all designed to connect with and engage audiences in the digital spaces they frequent.
Statistics regarding digital marketing indicate significant growth and prevalence, with the global market anticipated to surpass $1.3 trillion by 2033, and mobile advertising projected to represent over 70% of advertising expenditures by 2028.
Notable facts highlight the essential nature of an online presence for consumers (97% conduct online research prior to making a purchase), the efficiency of SEO (90% of web pages receive no organic traffic), the widespread use of video content (over 90% of companies utilize it), and the growing influence of AI (51% of organizations employ generative AI for operational enhancements).
Editor’s Choice
- Digital marketing began in 1990 with the development of the Archie search engine, which functioned as an index for FTP sites.
- Digital marketing is projected to grow at a compound annual growth rate of 10% from 2025 to 2028.
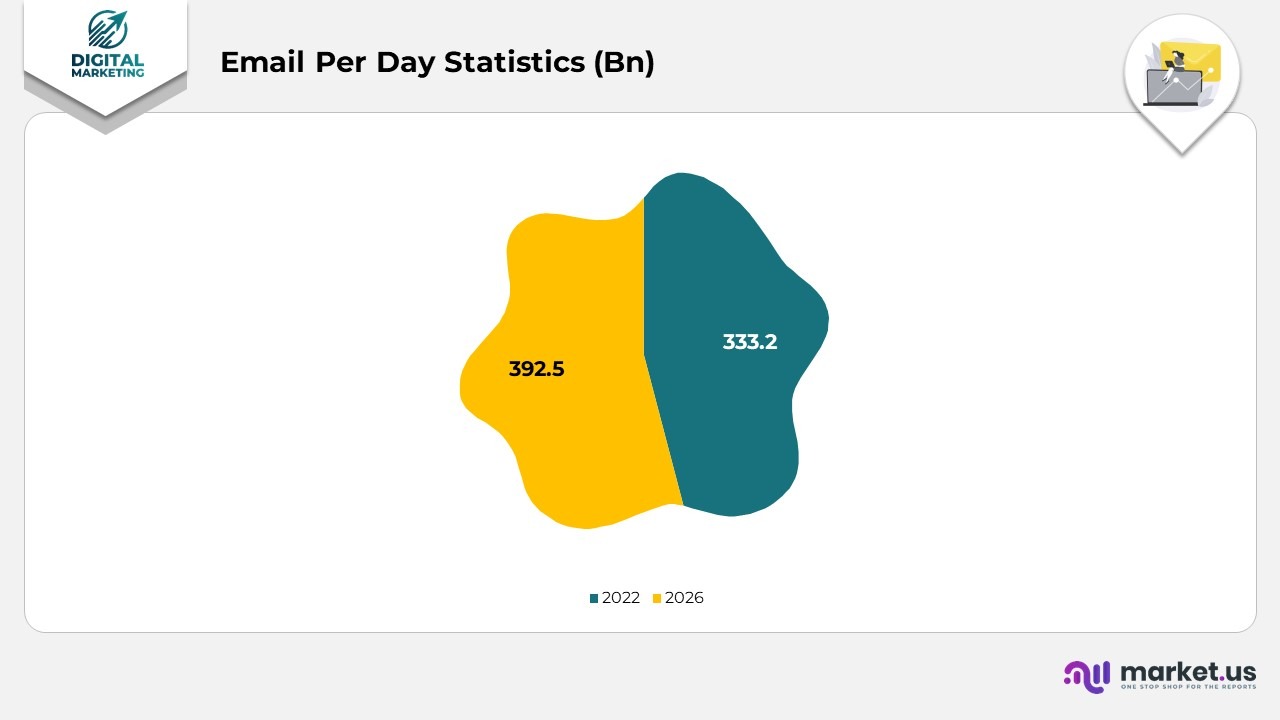
- In 2022, a total of 333.2 billion emails were dispatched each day, with forecasts indicating an increase to 392.5 billion by the year 2026.
- The total number of social media users globally has exceeded 4.95 billion.
- Over 2.14 billion individuals globally participate in online shopping, which constitutes 27% of the worldwide population.
- Google handles 99,000 searches each second, resulting in 8.5 billion searches daily and around 2 trillion searches annually.
- The typical American adult dedicates over two hours daily to social media.
- The influencer market is valued at $14 billion.
Historical Facts
- Digital marketing began in 1990 with the development of the Archie search engine, which functioned as an index for FTP sites.
- The inaugural clickable banner advertisement, known as the “You Will” campaign by AT&T, was launched in 1994, achieving a remarkable click-through rate of 44% among viewers within the first four months.
- The introduction of pay-per-click (PPC) advertising by Google AdWords in 2000 enabled businesses to focus on specific keywords, thereby enhancing the measurability and cost-effectiveness of digital marketing.
- The mid-2000s marked the rise of social media platforms, including Facebook (2004), YouTube (2005), and Twitter (2006).
- In 2007, marketing automation was introduced as a solution to the continuously changing marketing landscape.
- The growth of digital media was projected at 4.5 trillion online advertisements served annually, with digital media expenditures experiencing a 48% increase in 2010.
- Data from 2012 and 2013 indicated that digital marketing continued to expand.
- The Global Web Index estimated that by 2018, slightly over 50% of consumers utilised social media for product research.
- As of 2021, LinkedIn has emerged as one of the most utilised social media platforms among business leaders, recognised for its professional networking features.
General Digital Marketing Statistics and Facts
- Digital marketing is projected to grow at a compound annual growth rate of 10% from 2025 to 2028.
- The digital display sector is anticipated to grow at a CAGR of 15%, while search is expected to increase at a CAGR of 12%.
- In the past year, 65% of companies have increased their digital marketing budgets.
- The expenditure on digital marketing budgets in companies rose by 15% between 2021 and 2022.
- For every dollar invested, email marketing generates approximately $41 in revenue.
- Small businesses report that email marketing provides the highest return on investment among all marketing channels.
- More than 20% of companies believe that the volume of insights produced is the primary determinant of the effectiveness of their marketing platforms.
- Marketers believe that the best return on investment is achieved through SEO and content marketing.
- Digital marketing platforms account for 70% of total marketing expenditures.
- Digital marketing constitutes 60% of all marketing efforts.
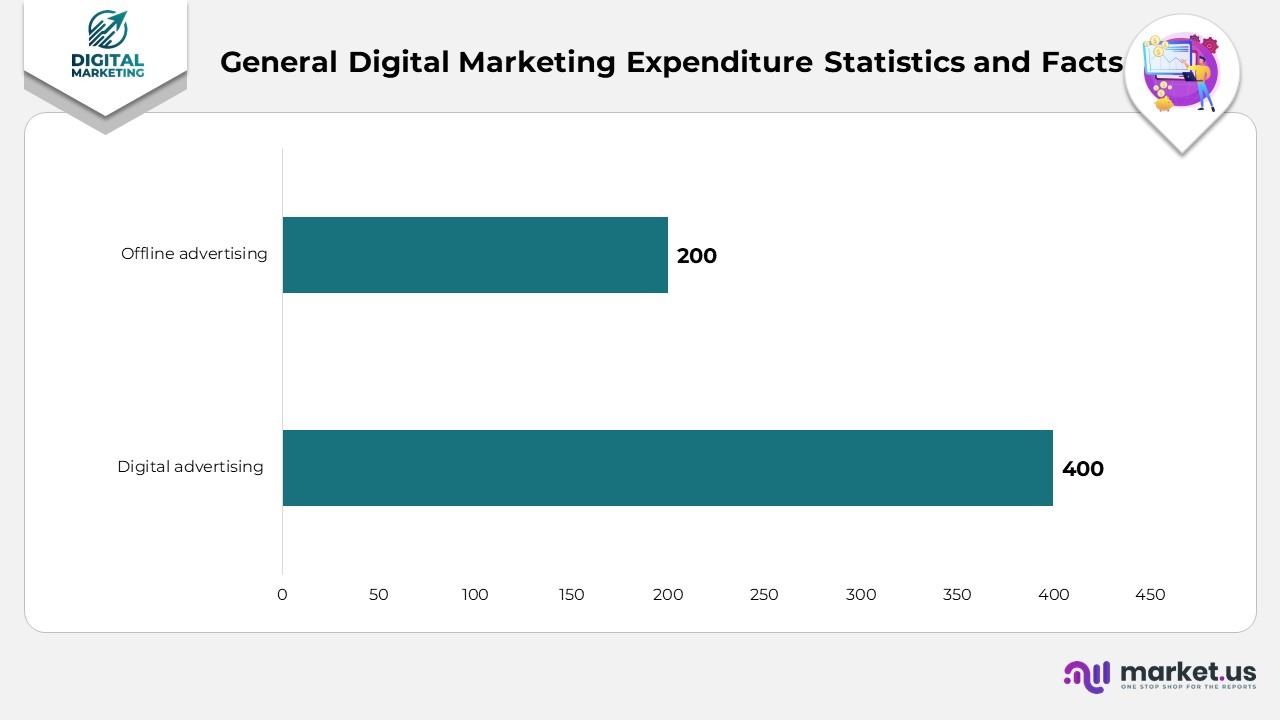
- In 2025, total digital advertising expenditure was approximately $400 billion, in contrast to $200 billion for offline advertising.
Moreover
- As of 2025, over 4.7 billion individuals are actively using the internet.
- Worldwide, there are more than 3.5 billion social media users, with projections indicating an increase to 4.41 billion by 2025.
- An average investment of $1 in email marketing results in a return of $38 on investment.
- It is projected that by 2026, over 82% of web traffic will be comprised of video content.
- In 2025, global e-commerce sales reached $3.9 trillion, and they are forecasted to increase to $6.5 trillion by 2026.
- The most effective digital marketing strategies for lead generation include search engine optimisation (SEO) and pay-per-click advertising (PPC).
- More than 50% of global web traffic is produced by mobile devices.
- The influencer market is anticipated to reach a value of $20.18 billion by 2025.
- As of 2026, over 5.4 billion individuals utilise email worldwide.
- Emails directed to business contacts generally achieve a 24% open rate.
- Business emails usually have a click-through rate (CTR) of approximately 3%.
- The open rates for emails featuring personalised subject lines can increase by 50%.
Email Marketing Statistics
- In 2022, a total of 333.2 billion emails were dispatched each day, with forecasts indicating an increase to 392.5 billion by the year 2026.
- In the year 2020, the revenue generated by the email marketing sector was estimated at $7.5 billion, with projections anticipating a growth to $17.9 billion by 2027.
- The return on investment associated with email marketing is remarkably high, averaging $36 for every dollar invested.
- The click-through rates for email marketing exceed those of Twitter and Facebook by a factor of 50 to 100.
- More than half of marketers (51%) regard email marketing as their most effective tool.
- Email marketing is considered crucial by 44% of Chief Marketing Officers (CMOs), who dedicate 8% of their marketing budgets to this channel.
- Automated email campaigns account for 31% of all orders generated through email.
- According to 78% of marketers, segmenting subscribers is the leading strategy for email campaigns.
- Email campaigns typically achieve an open rate of 21.3% and a click-through rate of 2.62%.
- Personalised emails lead to a 14% increase in click-through rates and a 10% rise in conversions.
Further
- Emails that include a preheader attain a 32.95% open rate, in contrast to 25.72% for those that do not.
- Welcome emails and other single-message autoresponders enjoy a remarkable 94% open rate and a 31.43% click-through rate.
- The average open rate for emails across various industries stands at 21.33%.
- A considerable number of Americans (59%) report that the emails they receive lack usefulness.
- Half of all consumers (50.2%) are likely to engage with emails that provide discounts.
- A preference for weekly emails is expressed by 78.5% of brand followers.
- Regular newsletters from brands have an impact on the purchasing decisions of 27% of consumers in the US.
- Implementing responsive design in emails can result in a 5-15% boost in click rates.
- A significant 25.7% of email users favor viewing their emails in dark mode.
- Over half of the population (63.3%) checks their email at least twice a day, with 25.4% doing so more than five times daily.
Social Selling Statistics
- The total number of social media users globally has exceeded 4.95 billion.
- An astonishing 93.5% of internet users around the world engage with social media on a monthly basis.
- The social media environment is experiencing swift expansion, with approximately 9.6 new users joining every second.
- Users spend an average of 2 hours and 27 minutes daily on social media platforms.
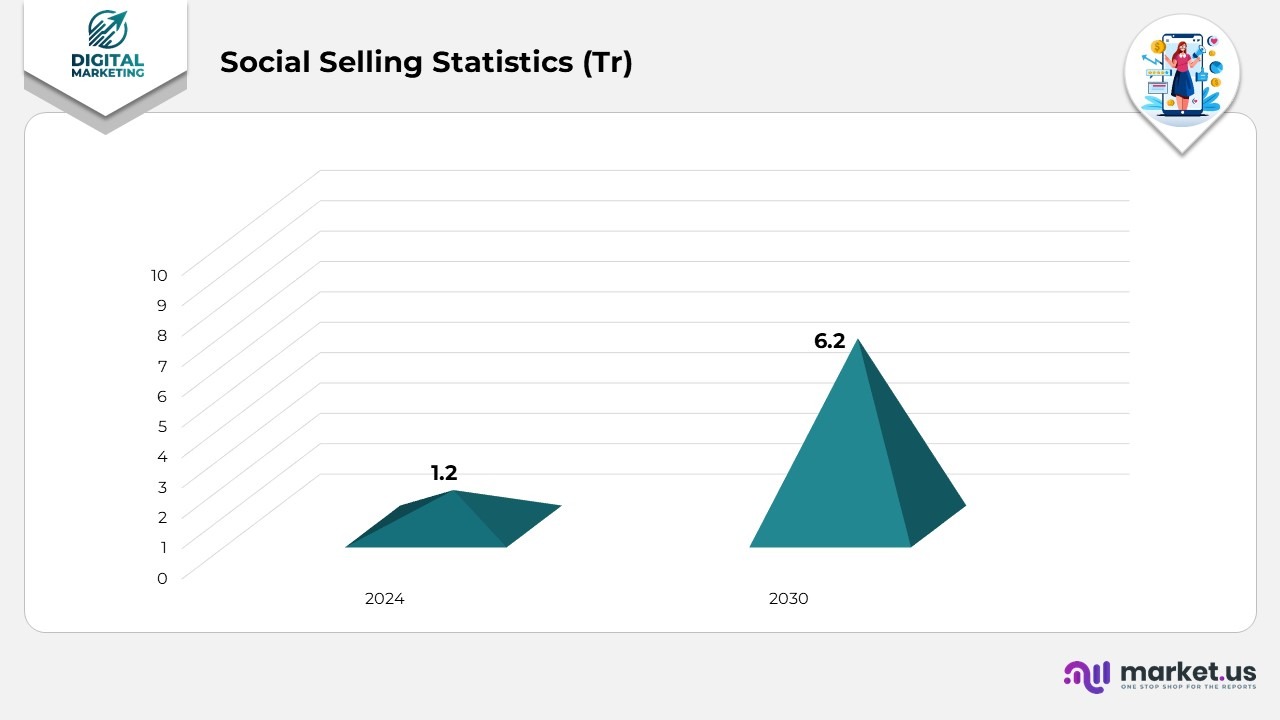
- Projections indicate that social commerce revenues could surpass $1.2 trillion by 2024, potentially rising to $6.2 trillion by 2030.
- One out of every four brands has begun to participate in direct sales through social media channels.
- Facebook is the favored shopping platform for 31% of online shoppers, whereas Instagram is preferred by 39% of Gen-Z consumers.
- Almost half (43%) of consumers find new products via social networks.
- Approximately 30% of younger demographics, such as Gen Z and Millennials, have recently completed purchases directly through social media platforms.
- Social media acts as the main avenue for 35% of Gen Z to engage with brands and products.
- By the year 2023, 80% of social media marketers expect brands to prominently showcase influencers or creators.
- Within the 18-54 age demographic, 21% of social media users have been swayed by influencers to make purchases in the past few months.
eCommerce and Online Shopping Statistics
- Over 2.14 billion individuals globally participate in online shopping, which constitutes 27% of the worldwide population.
- Forecasts suggest that the global e-Commerce sector could surpass $8 trillion by 2027.
- The projected annual growth rate for e-Commerce sales is expected to hit 10.1% by 2024, greatly exceeding the 2% growth anticipated for traditional retail sales.
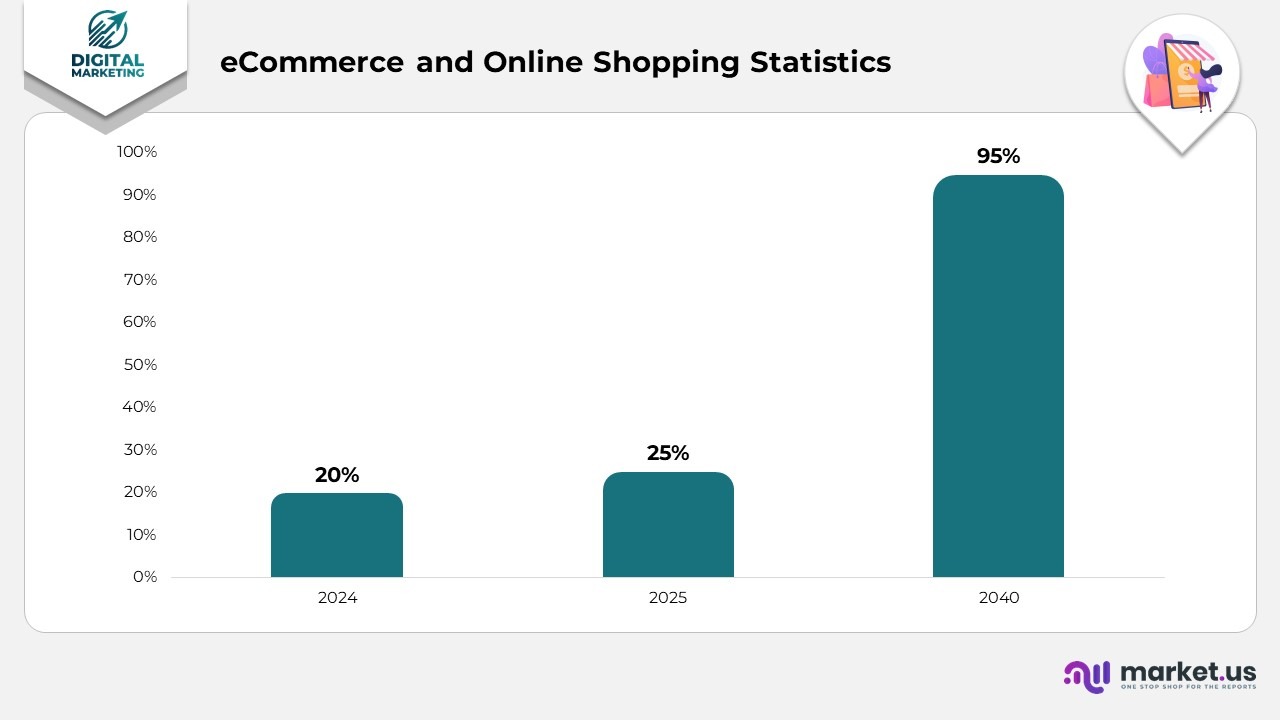
- In 2024, online retail represents 20% of total retail sales, with estimates indicating an increase to 25% by 2025.
- Projections indicate that by 2040, a significant majority (95%) of purchases will occur online.
- 56% of consumers favor online shopping due to its 24/7 accessibility.
- Nearly half of Gen Z consumers (46%) are prepared to spend more to shop at their favorite online retailers.
- For 53% of American consumers, engaging in shopping through social media on a weekly basis has become a common practice.
- A significant portion of shoppers, 46%, would switch retailers to ensure product availability.
- The total number of online stores across the globe has exceeded 12 million.
- The value of the livestream e-commerce industry is projected to reach around $50 billion by the end of 2023.
SEO Statistics
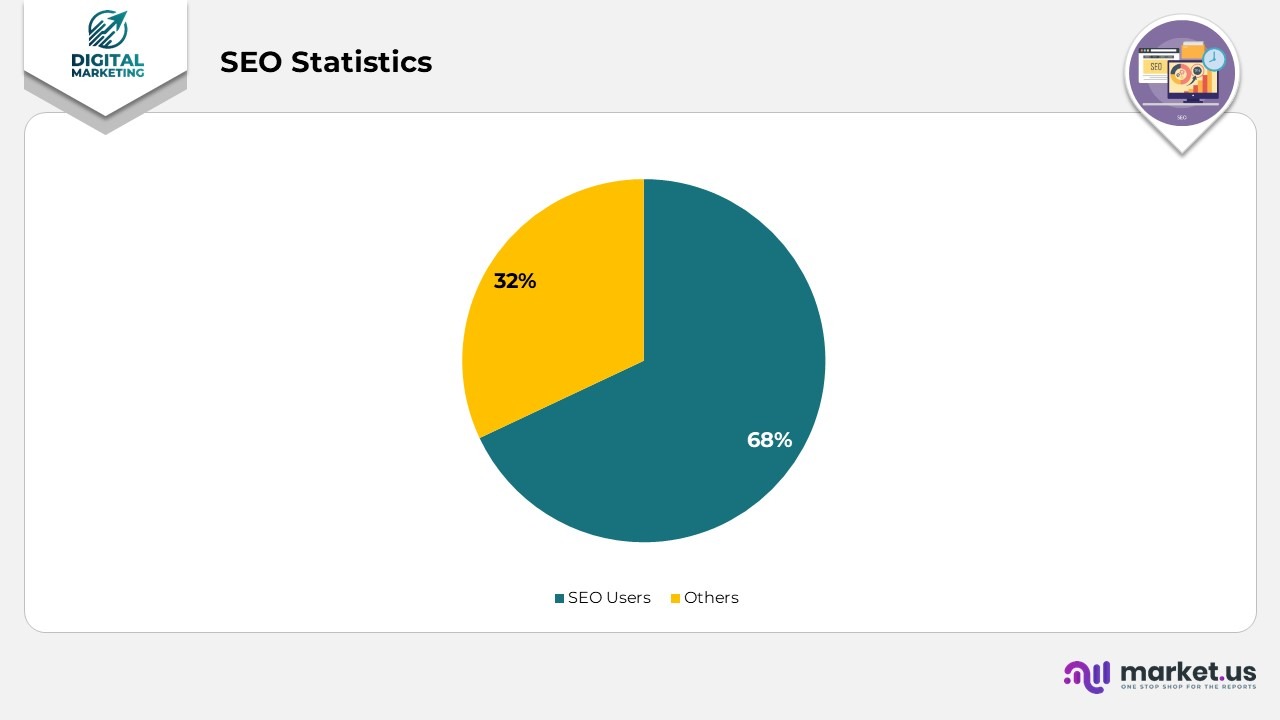
- 68% of online experiences initiate with a search engine.
- Google handles 99,000 searches each second, resulting in 8.5 billion searches daily and around 2 trillion searches annually.
- SEO generates over 1,000% more traffic compared to organic social media.
- 29% of marketers utilise a search-optimised website and blog to draw in and convert leads.
- SEO is regarded as the primary source of high-quality leads, with 35% of marketers crediting their most valuable leads to this channel.
- 51% of companies consider refreshing outdated content to be the most effective content marketing strategy.
- Websites that maintain active blogs produce 97% more backlinks than those that do not.
- 88% of marketers employing SEO intend to either increase or sustain their investment this year.
- 54% of SEO professionals incorporate AI and automation into their work.
- 37% of marketers leverage AI to streamline labour-intensive SEO tasks, reflecting a shift towards more automated SEO practices.
- 84% of bloggers report that AI has influenced their SEO strategies, highlighting the increasing role of technology in content creation and optimisation.
- SEO leads are eight times more likely to convert than those generated through traditional marketing.
AI in Digital Marketing Statistics
- 55% of senior executives in prominent global sales and marketing firms are of the opinion that artificial intelligence (AI) will significantly influence marketing optimisation, including A/B testing and SEO strategies.
- 97% of leaders concur that artificial intelligence (AI) and machine learning (ML) will empower organisations to analyse social media data and insights with greater efficiency.
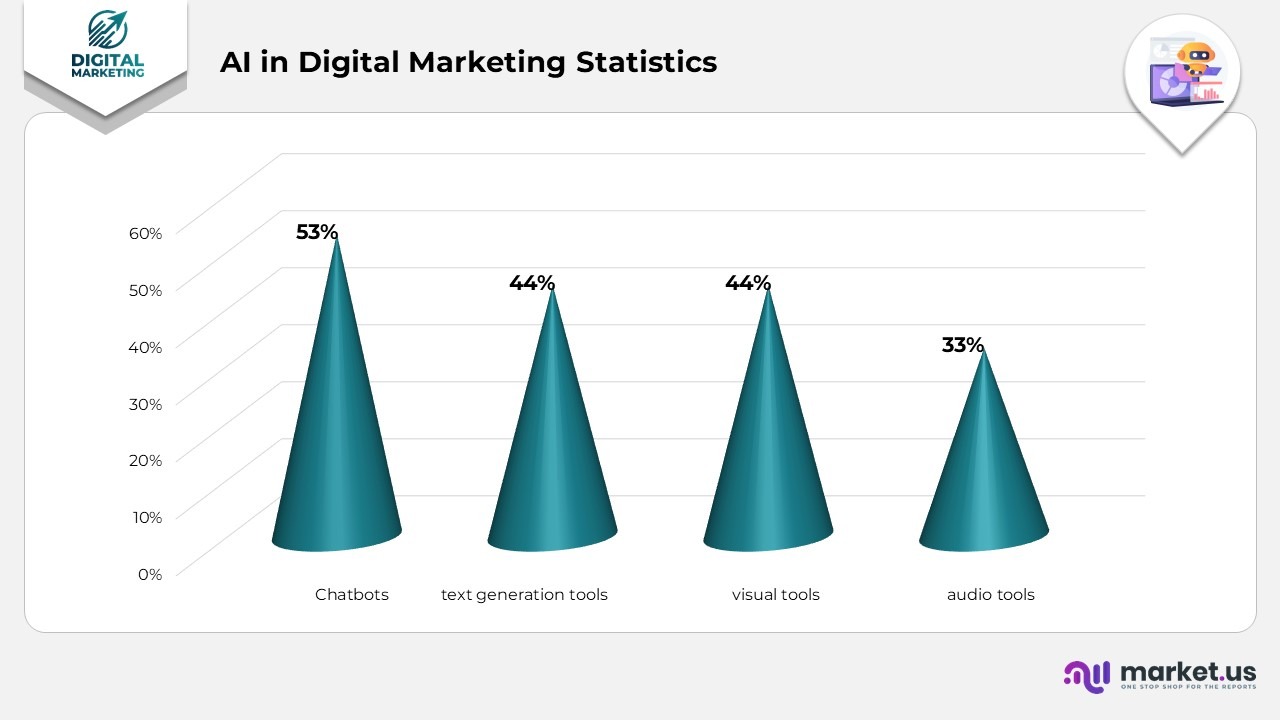
- The most widely utilised form of AI among marketers includes Chatbots (53%), text generation tools (44%), visual tools (44%), and audio tools (33%).
- 84% of bloggers and SEOs report that AI and automation have influenced their SEO strategies for the year 2023.
- 84% of marketers assert that AI and automation are highly effective in aligning web content with search intent, with 80% noting improvements in user experience on their sites, and 74% indicating enhancements in their SERP rankings.
- 45% of marketers employ AI for content creation, while 20% utilise it for copywriting.
- Marketers leveraging generative AI for content creation save an average of over 3 hours per piece.
- In 96% of cases, AI-generated content is insufficiently complete for independent publication.
- 31% of marketers utilise AI for crafting social media posts.
- 92% of businesses are implementing AI-driven personalisation to foster growth within their organisations.
- 61% of sales professionals believe that generative AI will enable them to better serve their customers.
- 84% of sales personnel using generative AI claim it contributes to increased sales within their organisations by enhancing and expediting customer interactions.
- 51% of marketers are convinced that AI improves the effectiveness of email marketing compared to traditional approaches.
Social Media Marketing Statistics
- The typical American adult dedicates over two hours daily to social media.
- 91% of individuals access social media platforms via mobile devices. Consequently, it is essential to incorporate social media into your mobile marketing strategy.
- Nearly half of social media users depend on recommendations from influencers regarding brands. Explore our influencer marketing analysis to discover how to leverage this trend.
- Given that fewer than 5% of businesses utilize Facebook video advertisements, there exists a significant opportunity for companies aiming to differentiate themselves.
- On Instagram, 90% of users are subscribed to at least one business account.
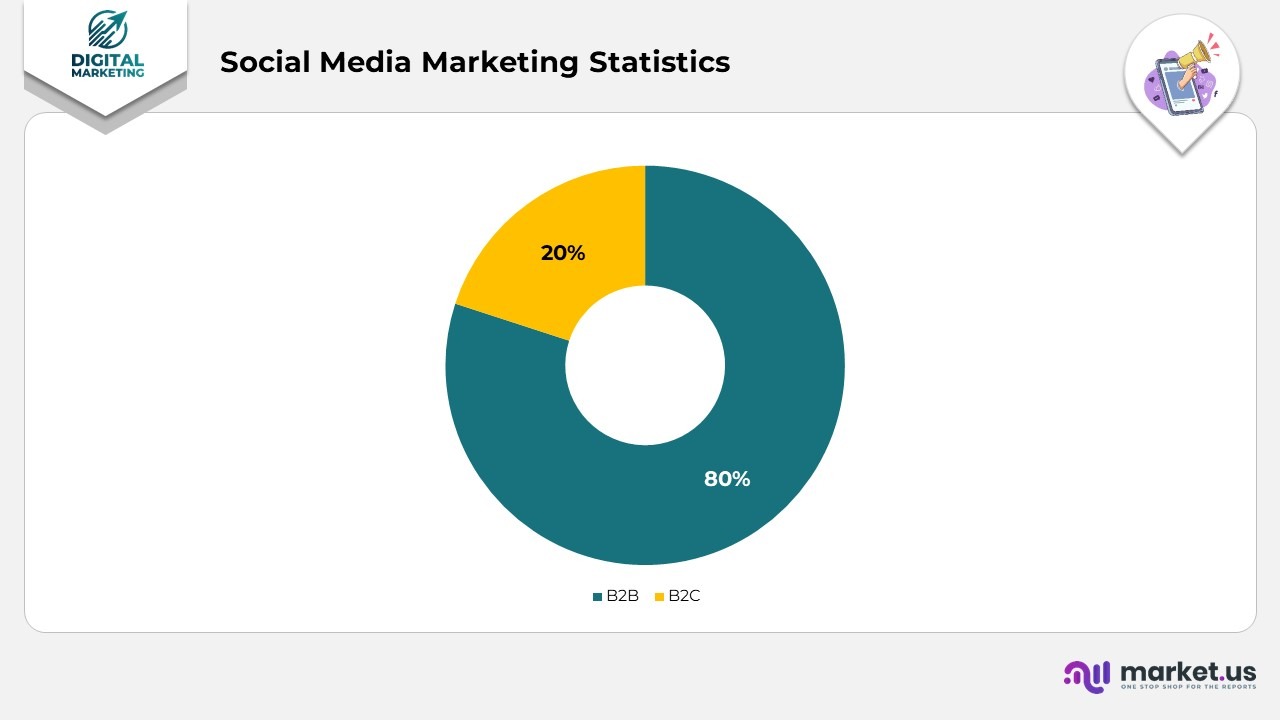
- More than 80% of B2B companies engage in organic social media marketing and Twitter advertising through Twitter.
- Snapchat boasts 265 million daily active users who access the app over 30 times each day.
- Users of Snapchat are more likely to purchase products or services through their mobile devices, showing a 60% higher tendency to make impulse buys.
- The average swipe-up rate for advertisements on Snapchat is 50%, with the cost per swipe varying between $0.30 and $1.00.
Influencer Marketing Statistics
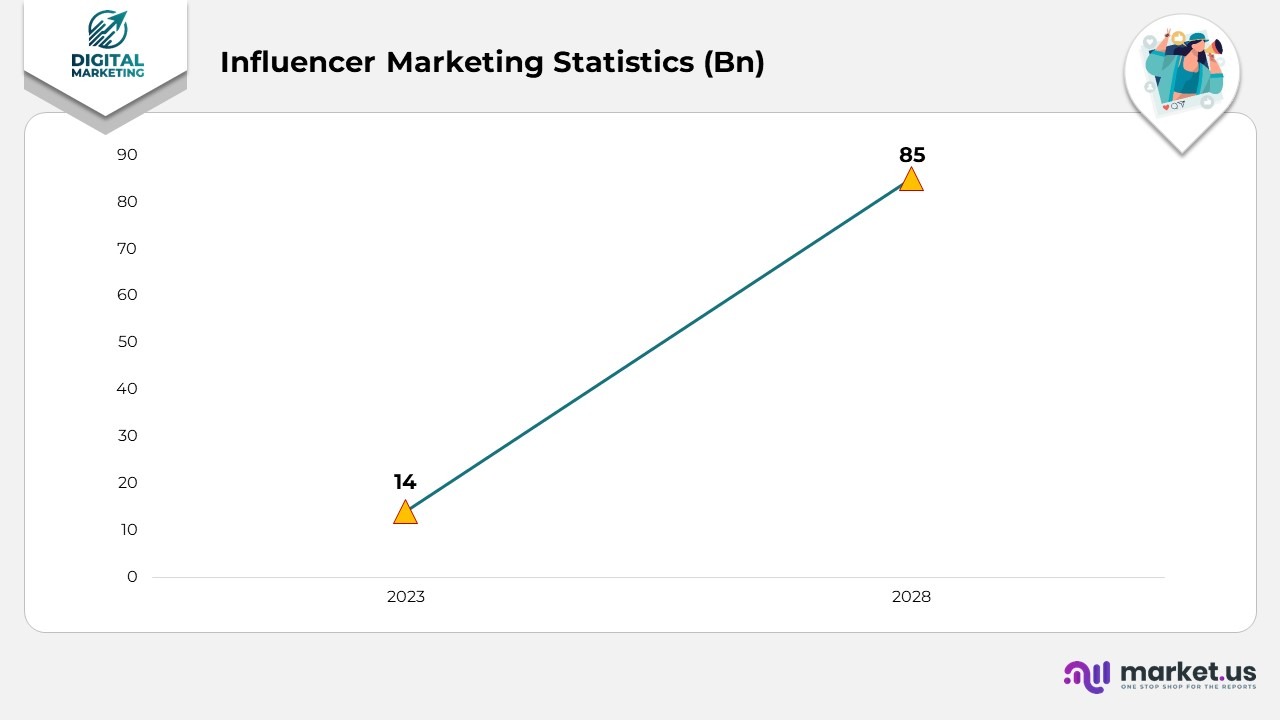
- The influencer market is valued at $14 billion.
- Influencer marketing yields a 650% return on investment, allowing marketers to earn $6.5 for each dollar spent.
- In terms of effectiveness, influencer marketing has surpassed print advertising.
- Approximately 56% of marketers in the United States and the United Kingdom utilize Instagram for influencer collaborations.
- Marketers favor micro-influencers over mega-influencers.
- By the year 2028, the influencer marketing sector is projected to reach a valuation of $85 billion.
Online Advertising Statistics
- 46% of clicks on web pages continue to be directed towards the top three PPC advertisements, underscoring the ongoing significance of effective PPC metrics.
- Advertisements have the potential to enhance brand visibility by 80%, illustrating a vital component of the growth statistics in digital marketing.
- Over 50% of users are still unable to differentiate between PPC advertisements and organic search results.
- Worldwide digital marketing statistics indicate that advertising expenditures are projected to surpass $250 billion by the year 2024.
- Video marketing statistics forecast that global spending on video advertisements will reach $60 billion by 2024.
- Mobile marketing statistics anticipate that expenditures on mobile advertisements will greatly exceed those on desktop advertisements in 2024.
- The average click-through rate (CTR) for Google Ads remains consistent, ranging from 3% to 5% (Clicta Digital), whereas the average CTR for Facebook Ads is approximately 0.90%.
Meme Marketing Statistics
- At least 60% of individuals using social media primarily engage with the platform for comedic content.
- On average, a millennial encounters approximately 30 memes daily.
- Among the 55% of Gen-Zers and Millennials who distribute memes, 38% follow accounts that are exclusively focused on memes.
- Memes rank as the second most frequently shared type of content on social media, following videos.
- The click-through rate (CTR) for a meme campaign exceeds that of email marketing by 14%.
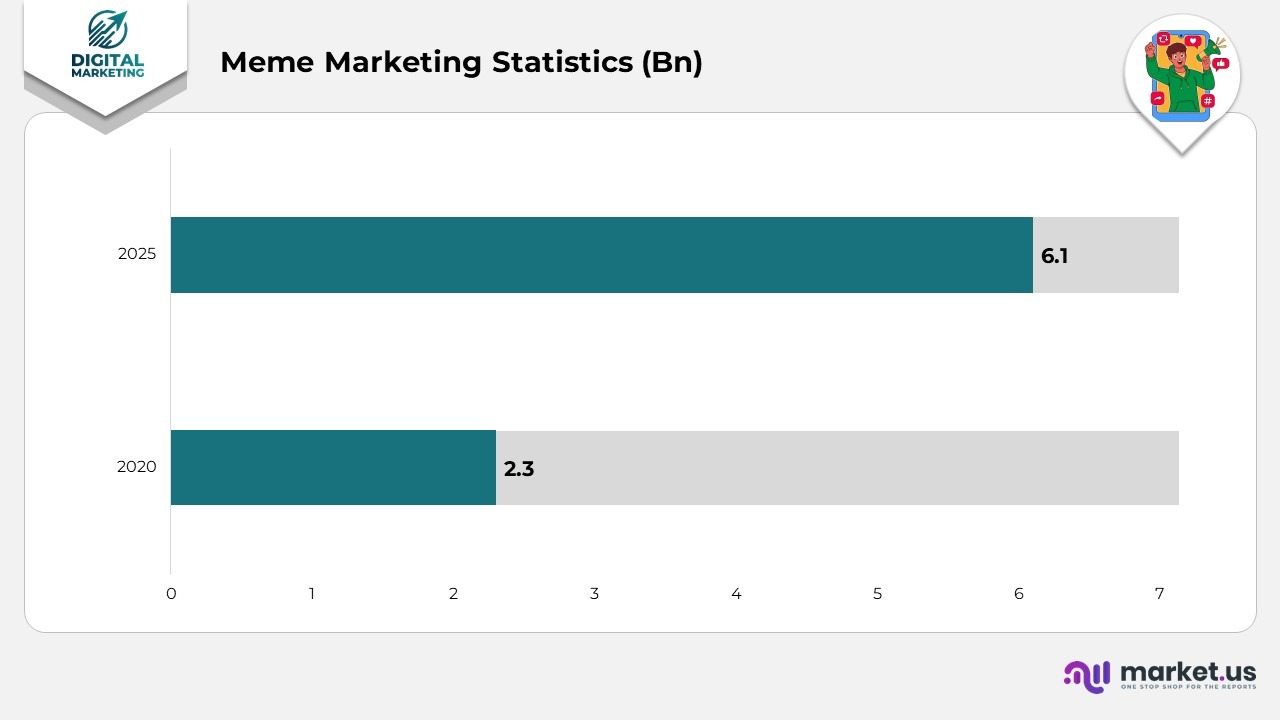
- In the year 2020, the worldwide meme industry was assessed to be worth $2.3 billion, with projections indicating it will expand to $6.1 billion by the year 2025.
Video Marketing Statistics
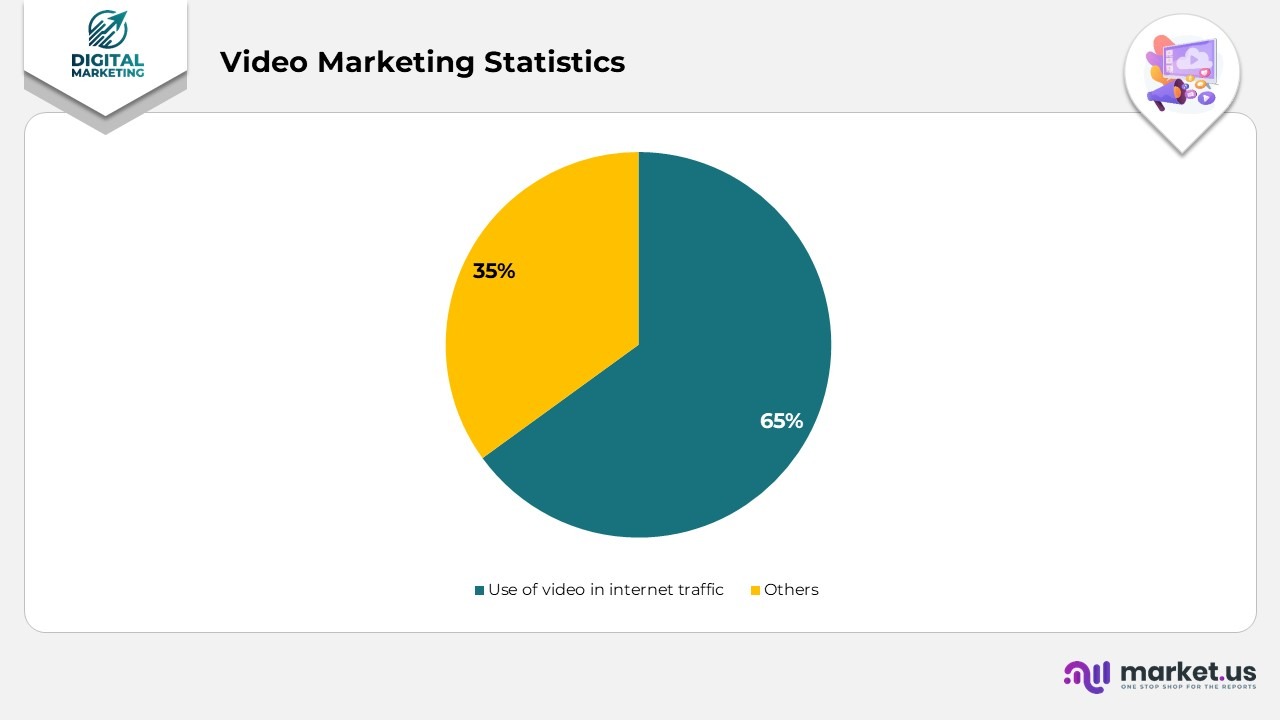
- The use of video accounts for 65% of all internet traffic.
- Individuals are expected to spend approximately 18 hours each week viewing videos.
- After watching a marketing video, 82% of consumers have made the decision to buy a product or service.
- Videos shared on social media are disseminated 12 times more frequently than photos and text combined on the platform.
- 75% of marketers have employed AI tools to aid in the creation of marketing videos.
- In 2024, video testimonials are the most favored form of video marketing, with 39% of marketers having produced them.
- The optimal day for posting on YouTube is Monday, followed by Tuesday and Wednesday.
- TikTok boasts the highest engagement rate per post among all social media platforms, standing at 4.25%.
Digital Marketing Fun Facts
- 68% of online experiences actually commence with a search engine.
- The typical consumer’s attention span is merely 8 seconds, which is shorter than that of a goldfish!
- Over 42% of individuals will discard an email if it is not optimized for mobile devices.
- Content featuring relevant images receives 94% more views compared to content without images.
- YouTube accounts for over 25% of the total global mobile traffic by volume.
- Blogs that have titles consisting of 6-13 words draw the highest and most consistent traffic.
- Almost 40% of marketers reported that the COVID-19 pandemic influenced their plans to incorporate video into their strategies.
- Instagram is the leading social media platform that individuals utilize to engage with their preferred brands.
Recent Developments
- The transition to a future without cookies is gaining momentum, as Google intends to eliminate third-party cookies in Chrome by the latter half of 2024.
- Meta introduced Threads in July 2023 and currently asserts that it has 100 million monthly users, a figure that is still increasing.
Digital Marketing Future Predictions
- Augmented Reality represents a significant advancement in the marketing industry. According to Market Research Future (MRFR), the global augmented reality market is projected to attain a value of $461.25 billion by the year 2030.
- By 2026, digital marketing is expected to emphasise a collaboration between humans and artificial intelligence, propelled by hyper-personalisation, automation powered by AI, and a strong focus on fostering trust through data privacy and transparency.
Conclusion
Digital marketing is an industry that is expanding swiftly, with a global market size expected to exceed $1.3 trillion by 2033, fueled by mobile, video, and search advertising. Key statistics highlight the significance of adopting a mobile-first strategy, the ongoing supremacy of search engines such as Google, and the efficacy of content, especially video. For companies, digital marketing provides quantifiable benefits such as enhanced reach, improved customer engagement, and greater brand recognition, rendering a robust online presence crucial for achieving success.