
Introduction
Apparel Industry Statistics: The apparel we choose to wear can be deeply personal, reflecting our emotions, identity, and cultural background, while also being influenced by worldwide trends, including economic factors, sustainability issues, and popular culture. Manufacturers and retailers strive to anticipate and even shape these trends to secure a competitive edge in the $1.8 trillion global apparel market.
The international apparel market is a vast and ever-evolving sector, estimated to be worth around $1.79 trillion in 2024, with projections indicating growth to $2.26 trillion by 2030. Significant trends encompass a movement towards sustainability, a heightened integration of technology such as AI and IoT in production processes, and the increasing impact of emerging economies. Prominent players and regions, particularly the USA and EU, significantly affect global trade dynamics, with countries like India serving as crucial manufacturing centers.
Editor’s Choice
- The worldwide apparel market was estimated to be valued at approximately $1.77 trillion in 2024.
- Louis Vuitton, based in France, leads the luxury brand valuation landscape with an impressive worth of USD 124,822 million.
- The apparel sector constitutes 1.65% of the global GDP.
- In 2024, the leading sportswear brands in the United States saw Nike dominate brand awareness, recognized by 96% of respondents, closely trailed by Adidas at 95%.
- Each year, 92 million tons of textiles are discarded globally.
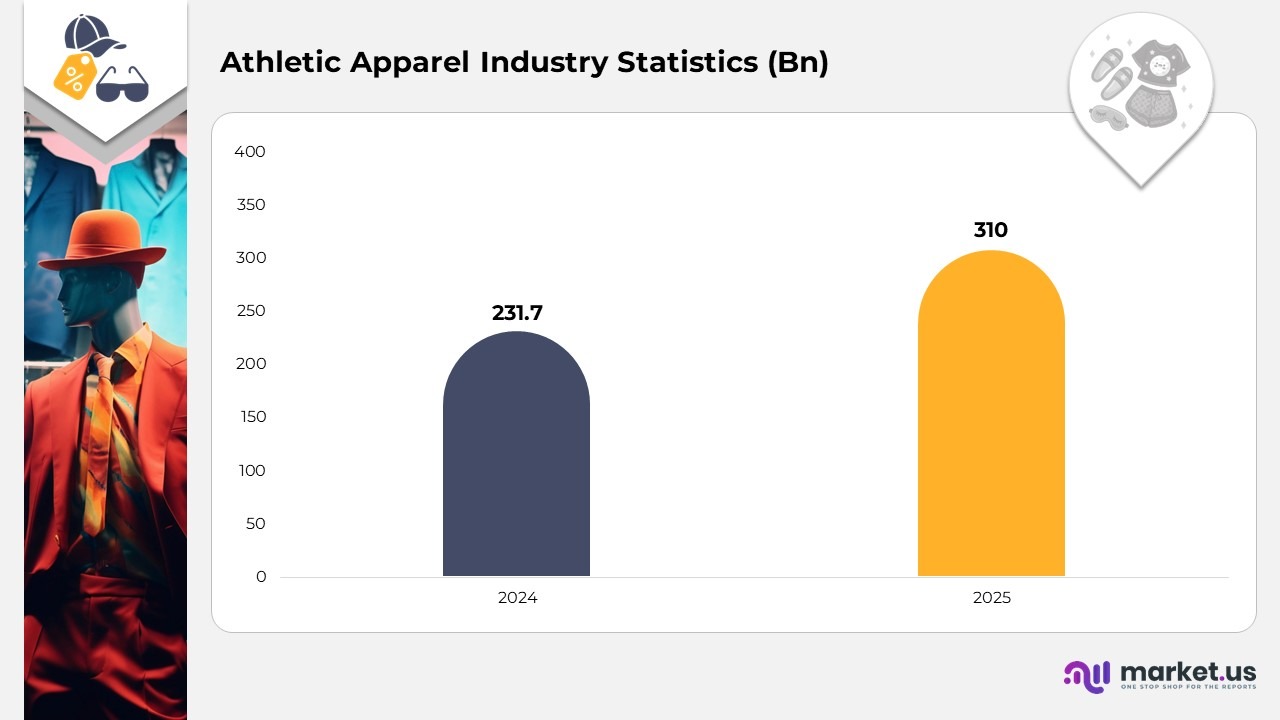
- The sports and fitness clothing sector is expected to achieve sales of $231.7 billion by 2024.
- In 2020, mobile sales represented 66% of the overall e-commerce sales within the fashion sector, indicating a significant lead over desktop sales, which made up 34%.
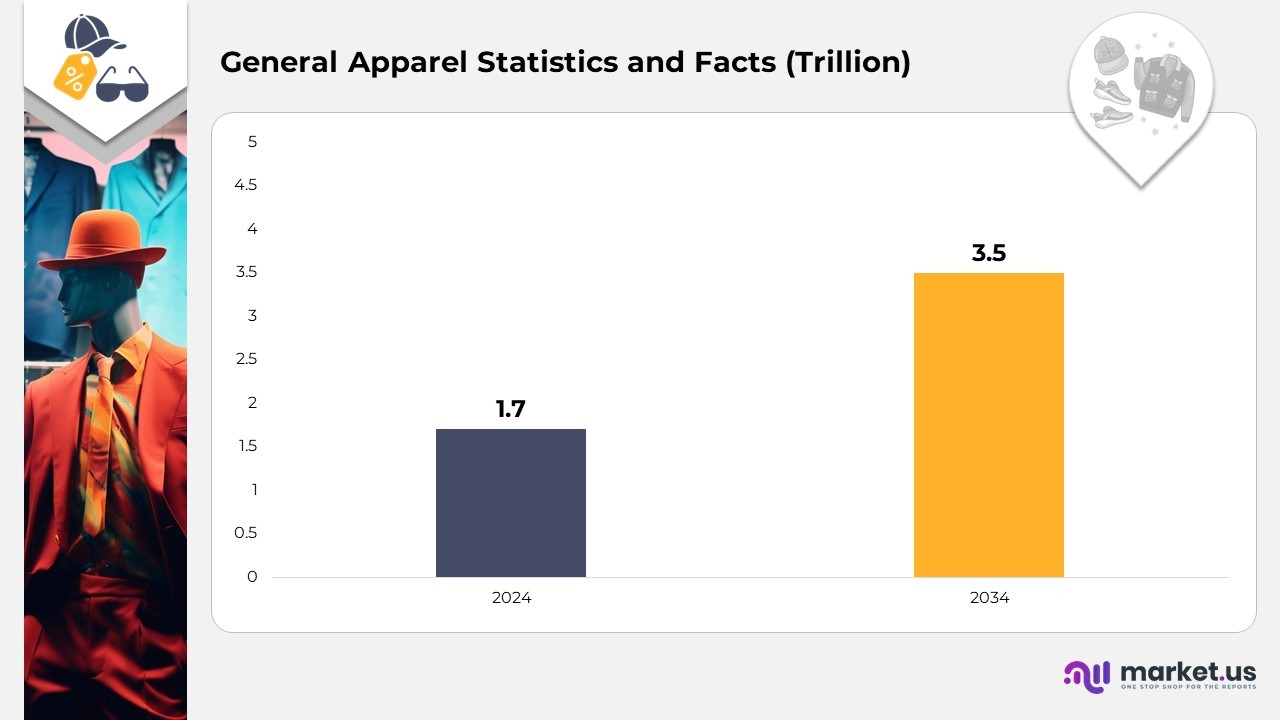
General Apparel Statistics and Facts
- The worldwide apparel market was estimated to be valued at approximately $1.77 trillion in 2024.
- Over 100 billion garments are manufactured globally each year.
- The fashion and textile sector employed roughly 430 million individuals around the globe in 2025.
- The global e-commerce apparel market is anticipated to expand to as much as $3.5 trillion by 2034.
- Worldwide, 57% of all internet users have purchased clothing online (2024).
- The women’s apparel category represents the largest segment of the apparel industry, with a market volume of $940 billion in the global market.
- The production of a single cotton T-shirt can necessitate 2,700 liters of water.
- It is estimated that 85% of all textiles are either incinerated or disposed of in landfills each year.
- The secondhand apparel market is projected to reach $367 billion by 2029, surpassing the growth of traditional apparel.
- 80% of retail executives anticipate that new trade policies or tariffs will disrupt their apparel supply chains (2025).
- China was the leading exporter in 2023, shipping approximately $301 billion in garments.
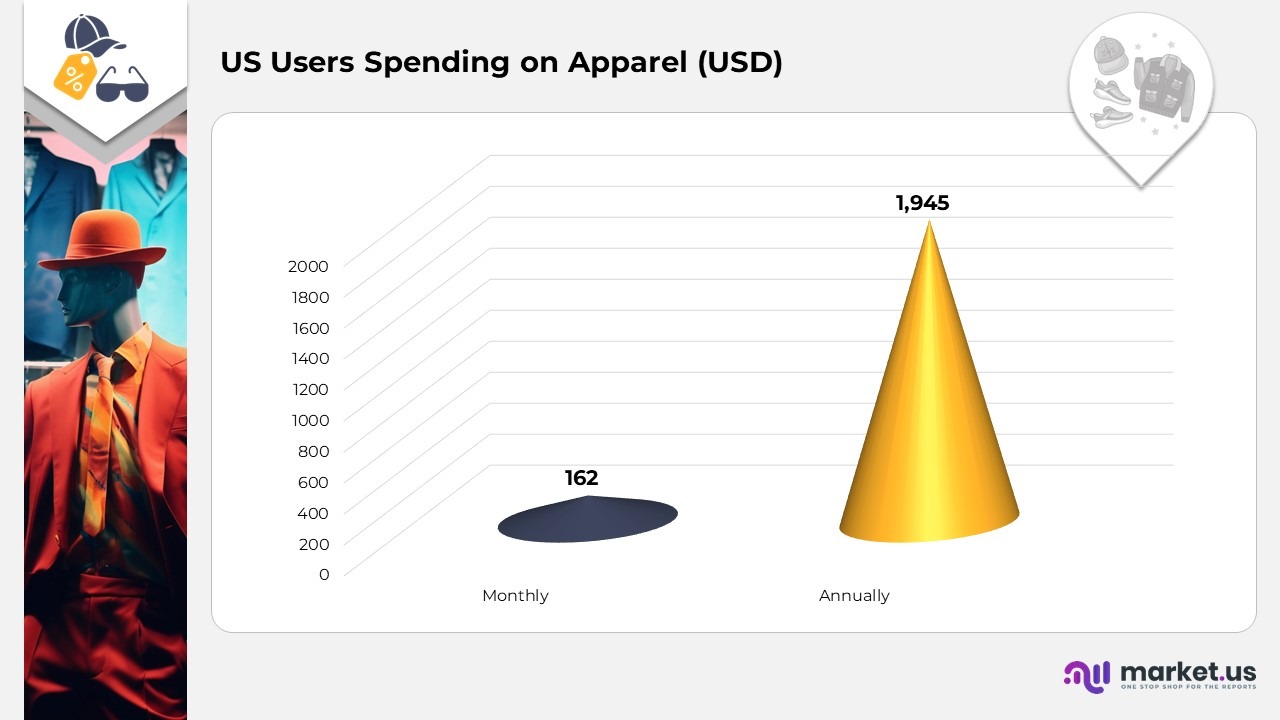
- S. households spent an average of about $162 monthly on clothing (approximately $1,945 annually).
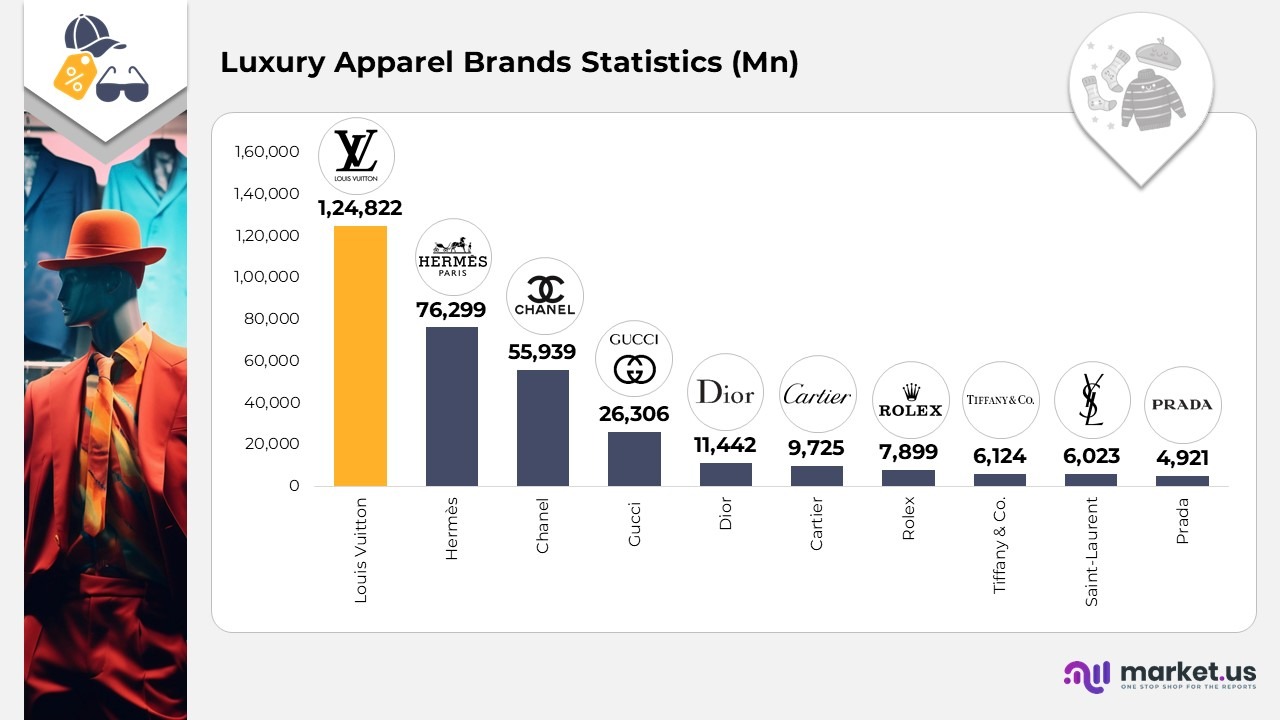
Luxury Apparel Brands Statistics
- Louis Vuitton, based in France, leads the luxury brand valuation landscape with an impressive worth of USD 124,822 million.
- Hermès, also situated in France, closely follows with a brand valuation of USD 76,299 million, which signifies its prestigious standing in the luxury goods industry.
- Chanel, another legendary French brand, has a valuation of USD 55,939 million.
- Gucci exemplifies Italy’s presence in the luxury sector, possessing a brand value of USD 26,306 million.
- Dior, with its rich history in haute couture, is valued at USD 11,442 million.
- Cartier, celebrated for its exquisite jewelry and timepieces, bolsters France’s luxury image with a brand valuation of USD 9,725 million.
- Rolex, headquartered in the United Kingdom, boasts a brand value of USD 7,899 million.
- Tiffany & Co., the United States’ hallmark of luxury jewelry, commands a valuation of USD 6,124 million.
- Saint-Laurent/Yves Saint Laurent, another esteemed French label, possesses a brand value of USD 6,023 million and is celebrated for its modern and iconic creations that resonate with fashion enthusiasts.
- Prada, originating from Italy, completes the list with a brand value of USD 4,921 million.
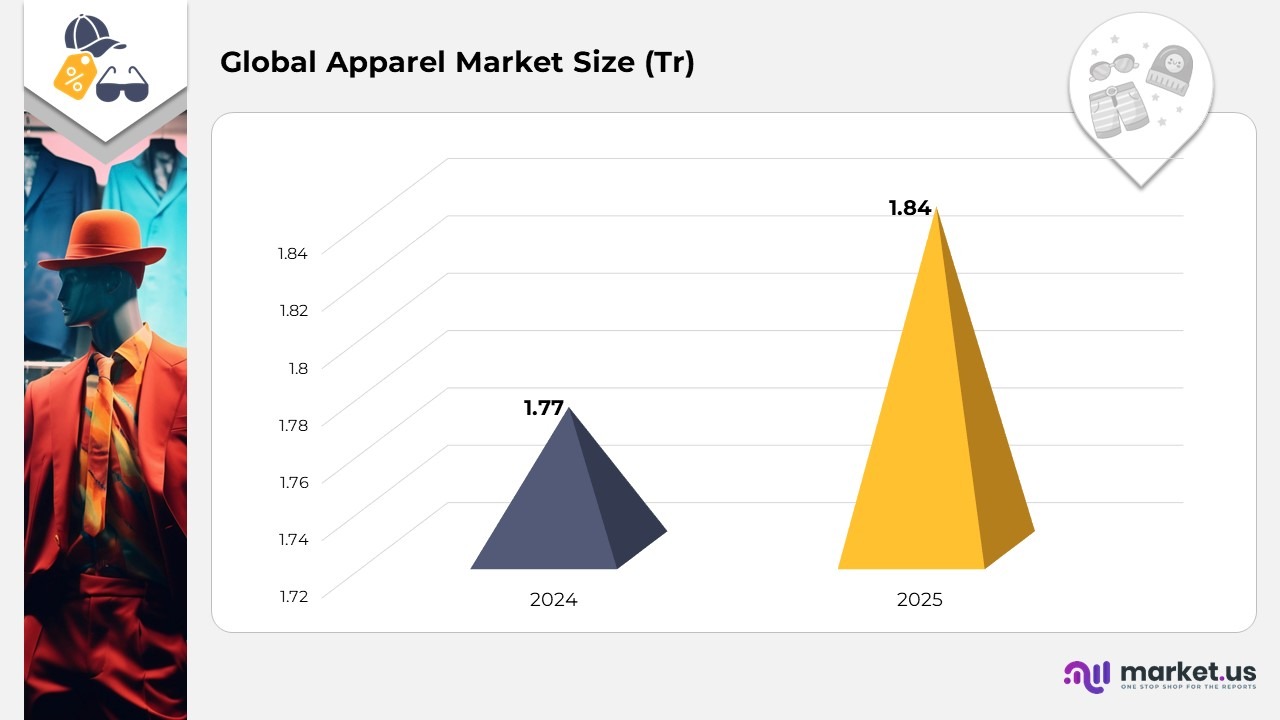
Global Apparel Market Size
- The apparel market is projected to reach a valuation of $1.84 trillion by 2025, representing 1.65% of the global gross domestic product. It is anticipated that the market will experience a compound annual growth rate (CAGR) of 2.81% from 2025 to 2028.
- The apparel sector constitutes 1.65% of the global GDP.
- In 2020, the apparel market faced a significant decline due to the Covid-19 pandemic, resulting in an 11.46% decrease in market size compared to the previous year.
- The United States apparel market is estimated to be worth $365.70 billion in 2025, with a projected CAGR of 2.11% from 2025 to 2028.
- Currently, the global women’s apparel market is valued at $930 billion and is expected to surpass the $1 trillion threshold by 2027.
- The men’s apparel market is valued at $587.61 billion, while the children’s apparel market stands at $274.25 billion.
- In the United States, retail clothing sales average $25.63 billion per month. According to the most recent data, retail clothing sales in the US reached $25.84 billion in April 2024.
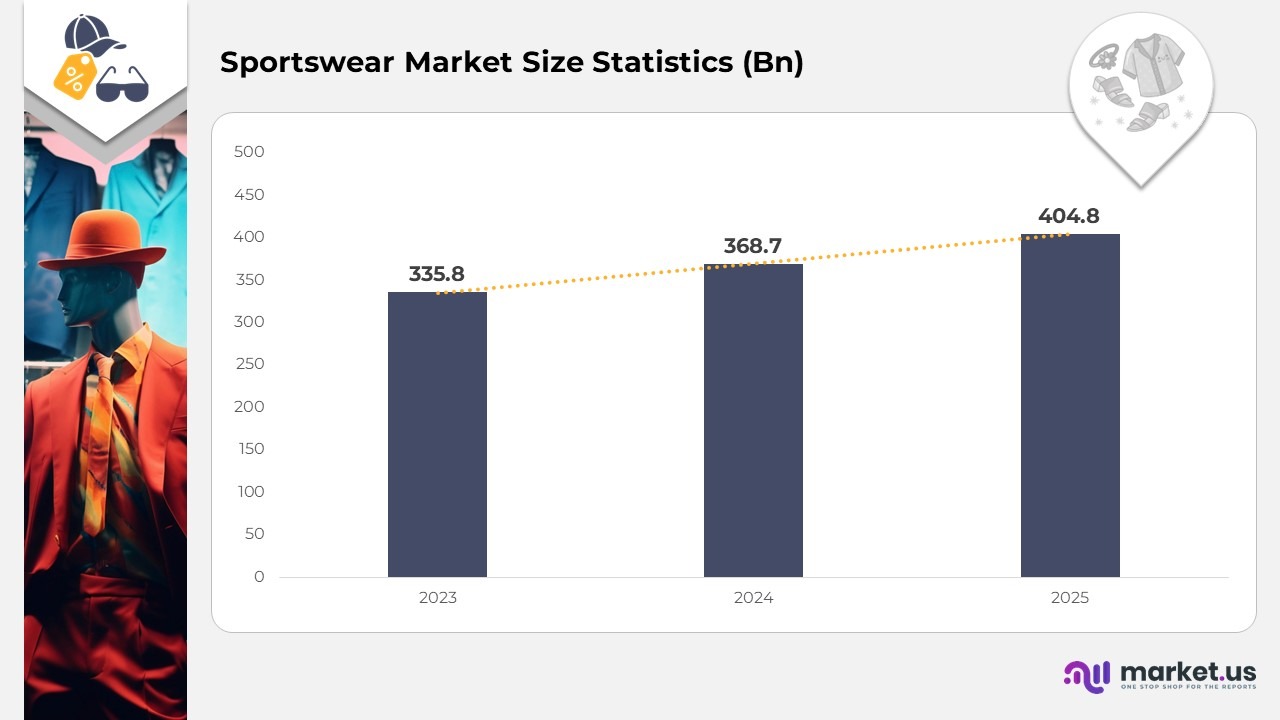
Sportswear Market Size Statistics
- In 2023, the market size is projected to be USD 335.8 billion, with a forecasted increase to USD 368.7 billion in 2024.
- This positive trend is expected to continue, reaching USD 404.8 billion in 2025 and USD 444.5 billion by 2026.
- By 2027, the market is anticipated to grow further to USD 488.1 billion, with significant growth expected through the end of the decade.
- The market size is predicted to reach USD 535.9 billion in 2028, USD 588.4 billion in 2029, and USD 646.1 billion by 2030.
- Growth is set to accelerate in the early 2030s, with the market size projected to reach USD 709.4 billion in 2031, USD 778.9 billion in 2032, and culminating at USD 855.3 billion by 2033.
Sportswear Brand Trends Statistics
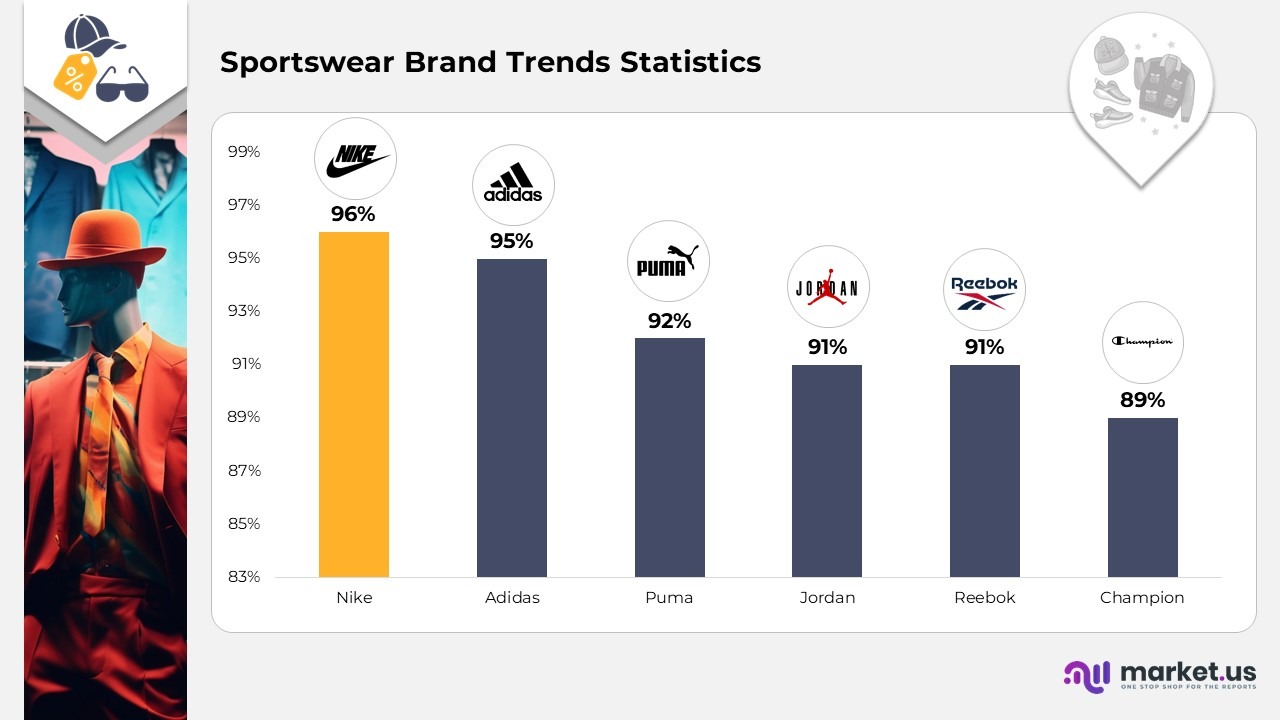
- In 2024, the leading sportswear brands in the United States saw Nike dominate brand awareness, recognized by 96% of respondents, closely trailed by Adidas at 95%.
- Puma maintained a robust position with 92% awareness, while both Jordan and Reebok were acknowledged by 91% of respondents.
- Champion and Under Armour also exhibited significant awareness levels, at 89% and 88%, respectively.
- FILA had an awareness rate of 85% and New Balance was recognized by 87% of respondents.
- Wilson achieved a commendable 77% recognition, whereas ASICS and Speedo were known to 65% and 63% of respondents, respectively.
- Lower awareness levels were noted for Russell Athletic (45%) and Titleist (44%), followed by Callaway with 41% awareness.
- New Era was familiar to 37% of respondents, and Umbra to 32%.
- Kappa, ARENA, and Decathlon recorded the lowest awareness levels among the top brands, with recognition rates of 27%, 20%, and 18%, respectively.
US Users Spending on Apparel
- In the United States, the average household allocates $162 monthly for apparel, which totals $1,945 annually.
- In 2022, the average expenditure on apparel and related services rose by 10.9%, following a significant increase of 22.3% in 2021.
- When compared to education, the average American household spends 45.7% more on clothing.
- In comparison to personal care, the average American household’s spending on clothing is 124.5% higher.
- Furthermore, the average American household spends 233.4% more on clothing than on alcoholic beverages.
Apparel Waste Statistics
- Each year, 92 million tons of textiles are discarded globally.
- On average, an individual in the United States discards around 81.5 pounds of clothing annually, leading to an estimated 11.3 million tons of textile waste generated within the nation itself.
- The fashion sector accounts for 10% of the total annual carbon emissions worldwide.
- Annually, the fashion industry consumes enough water to satisfy the needs of five million individuals, which equates to 93 billion cubic meters.
- Textiles may take as long as 200 years to decompose.
- Only 1% of clothing is recycled each year.
- Every year, up to 500,000 tons of microfibers are released into the ocean.
- 15% of used textiles are exported overseas, where they frequently end up in landfills due to less sophisticated waste management practices.
Number of Clothes Produced Annually
- It is estimated that more than 100 billion garments are manufactured every year. This translates to 12.5 items of clothing for every individual on the planet.
- The annual production of clothing has doubled since the year 2000, surpassing the 100 billion threshold for the first time in 2014.
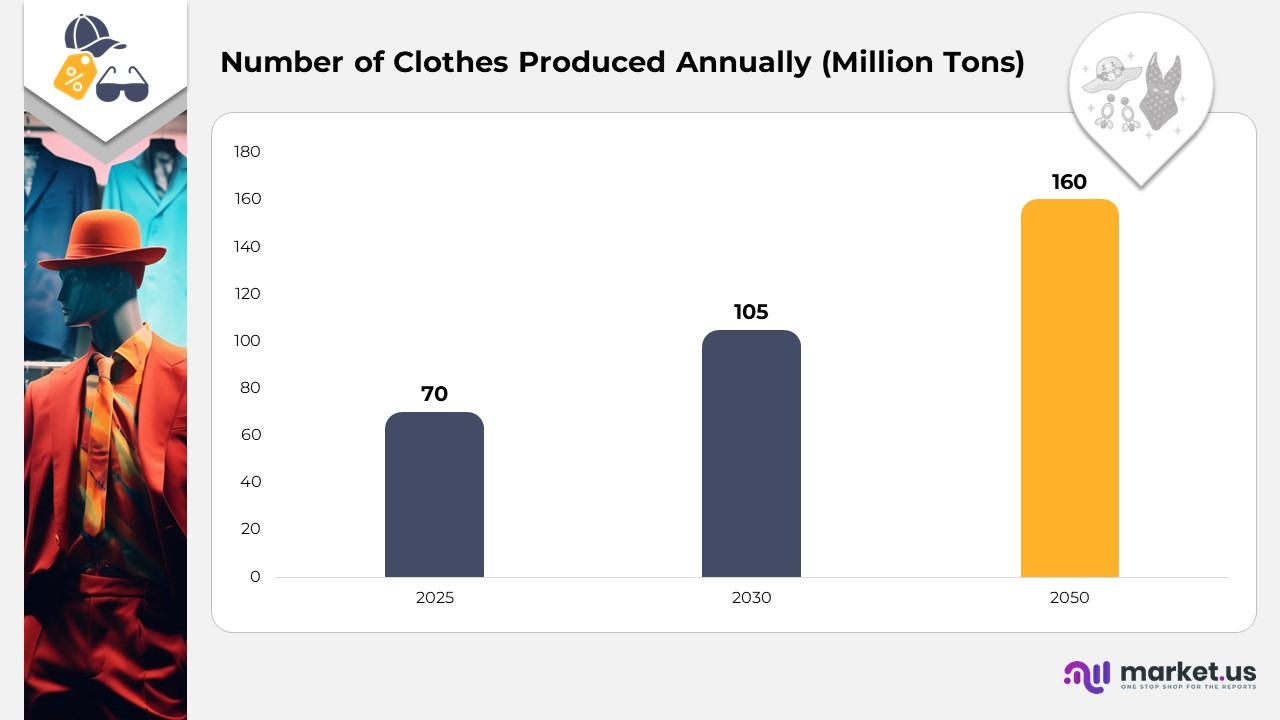
- By the year 2030, it is projected that global clothing consumption will rise by 63%, increasing from the present 70 million tons to 105 million tons.
- Furthermore, by the year 2050, this amount is expected to triple in comparison to current levels, with total clothing sales anticipated to reach 160 million tons.
Athletic Apparel Industry Statistics
- The sports and fitness clothing sector is expected to achieve sales of $231.7 billion by 2024.
- The APAC region is projected to experience the highest growth rates in the athletic apparel market, with a forecasted CAGR of 6.9% during the specified period.
- Currently, the sports footwear market is valued at $90 billion.
- Overall, the global apparel market is valued at $3 trillion, representing approximately 2% of the world’s total GDP.
- In the United States, around 1.8 million individuals are employed in the fashion sector, with approximately 232,000 of these working specifically in the apparel industry.
- The average salary for employees in the athletic apparel sector ranges from about $26,000 for entry-level roles to approximately $85,000 for positions in sales and marketing.
- Approximately 80% of all employees in the U.S. are engaged with an apparel retailer.
- The sporting goods sector generates roughly $88 billion in wholesale sales annually in the United States.
- Retail sales in the sports apparel segment are expected to grow at a CAGR of 3.1%.
Outdoor Apparel Industry Statistics
- The outdoor apparel market in China is experiencing significant expansion within the e-commerce sector.
- The compound annual growth rate (CAGR) for online sales in certain regions of China is projected to exceed 30% until 2020, with additional increases anticipated following the Winter Olympics scheduled for 2022.
- In the United States, the overall sales in the outdoor apparel sector reached $9.5 billion.
- Among those engaged in outdoor activities in the United States, 37% belong to the 45 and older age group.
- The average revenue generated per user in the outdoor apparel market in the United States surpasses $330.
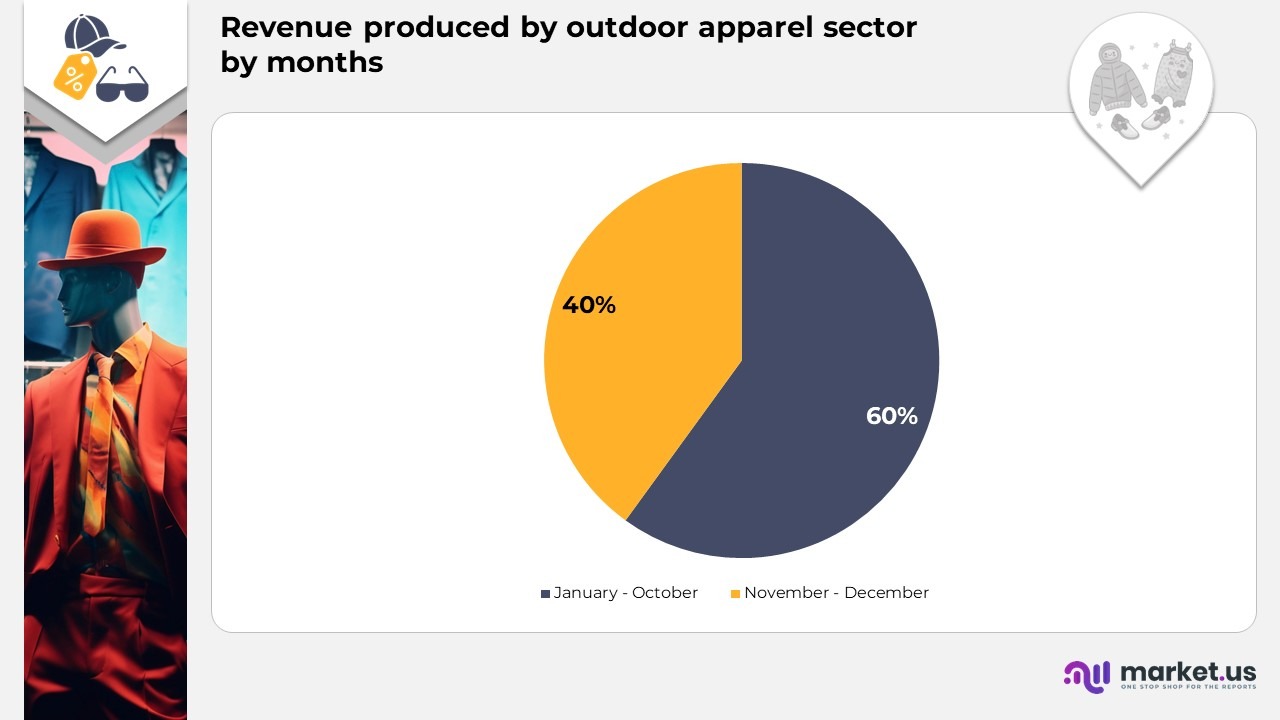
- Approximately 40% of the revenue produced by the outdoor apparel sector occurs during the months of November and December each year.
- Anta leads the Chinese market with sales amounting to $1.73 billion, while The North Face follows as the second leading brand, with sales of only $161.8 million.
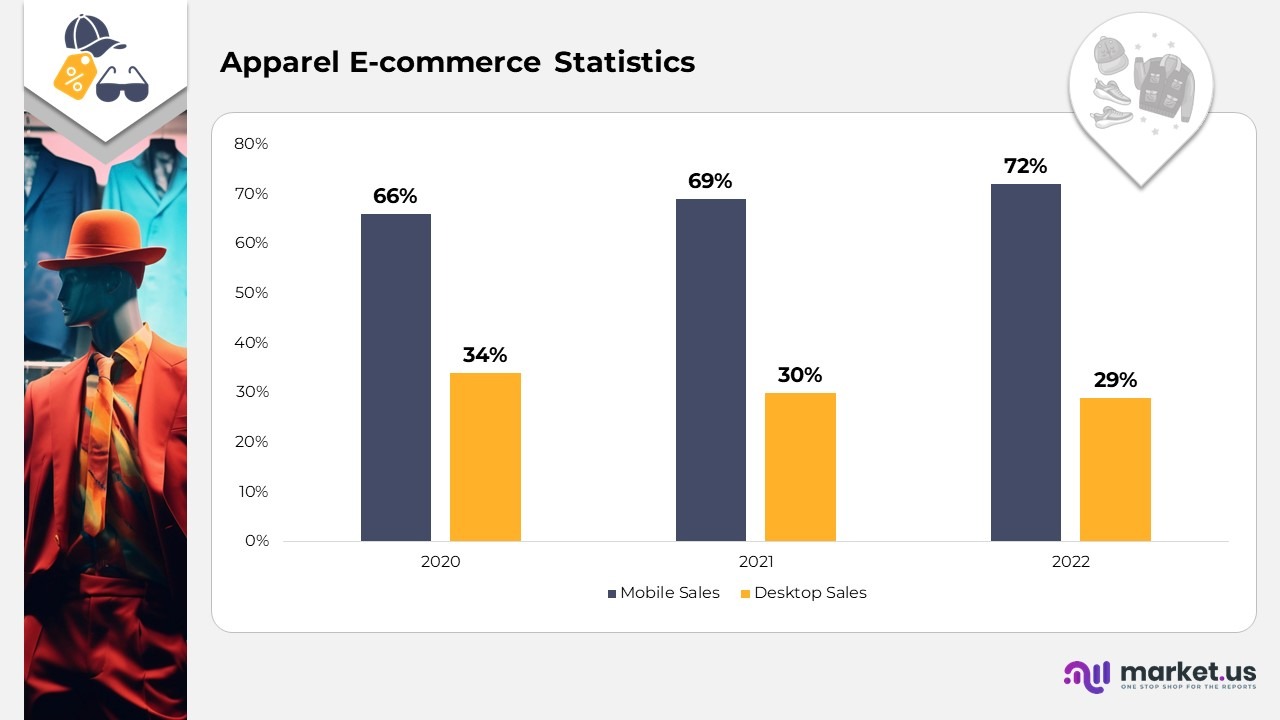
Apparel E-commerce Statistics
- In 2020, mobile sales represented 66% of the overall e-commerce sales within the fashion sector, indicating a significant lead over desktop sales, which made up 34%.
- The subsequent year, 2021, experienced an additional rise in mobile sales, reaching 69%, whereas desktop sales fell to 30%.
- The disparity expanded in 2022, as mobile sales increased to 72%, approaching three-quarters of all fashion e-commerce sales, while desktop sales persisted in their decline, concluding at 29%.
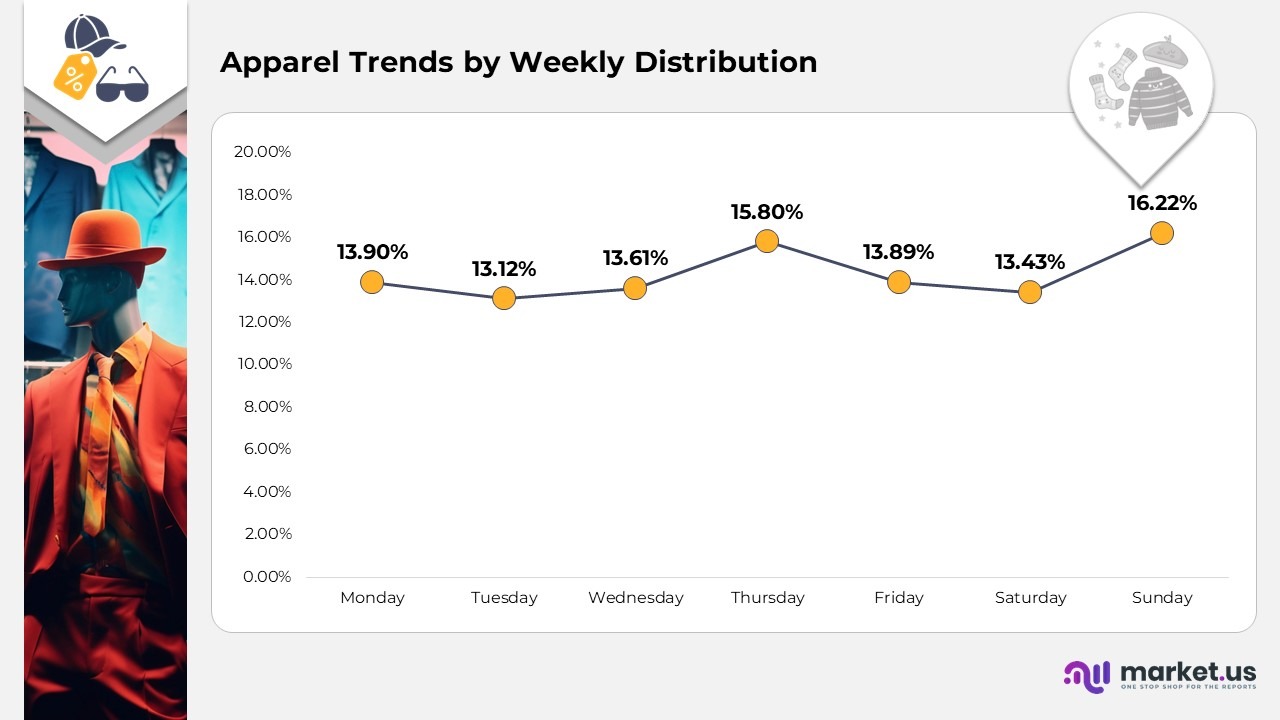
Apparel Trends by Weekly Distribution
- Monday marks the beginning of the week with a significant 13.b90% of total fashion e-commerce sales.
- Tuesday experiences a slight decline to 13.12%, indicating a possible normalization in consumer buying behavior following the start of the workweek.
- On Wednesday, the midweek point, there is a small rise to 13.61%. Which may suggest that midweek marketing strategies or promotions are successfully attracting shopper attention.
- Thursday witnesses a notable increase, achieving the highest percentage of the week at 15.80%.
- Friday’s share stands at 13.89%, a slight decrease from Thursday’s peak, yet still strong, as consumers may engage in last-minute purchases in preparation for the weekend.
- Saturday sees a further drop to 13.43%, likely due to individuals spending less time online and opting for physical retail experiences or leisure activities during the weekend.
- The week wraps up with Sunday achieving the highest percentage of the week at 16.22%.
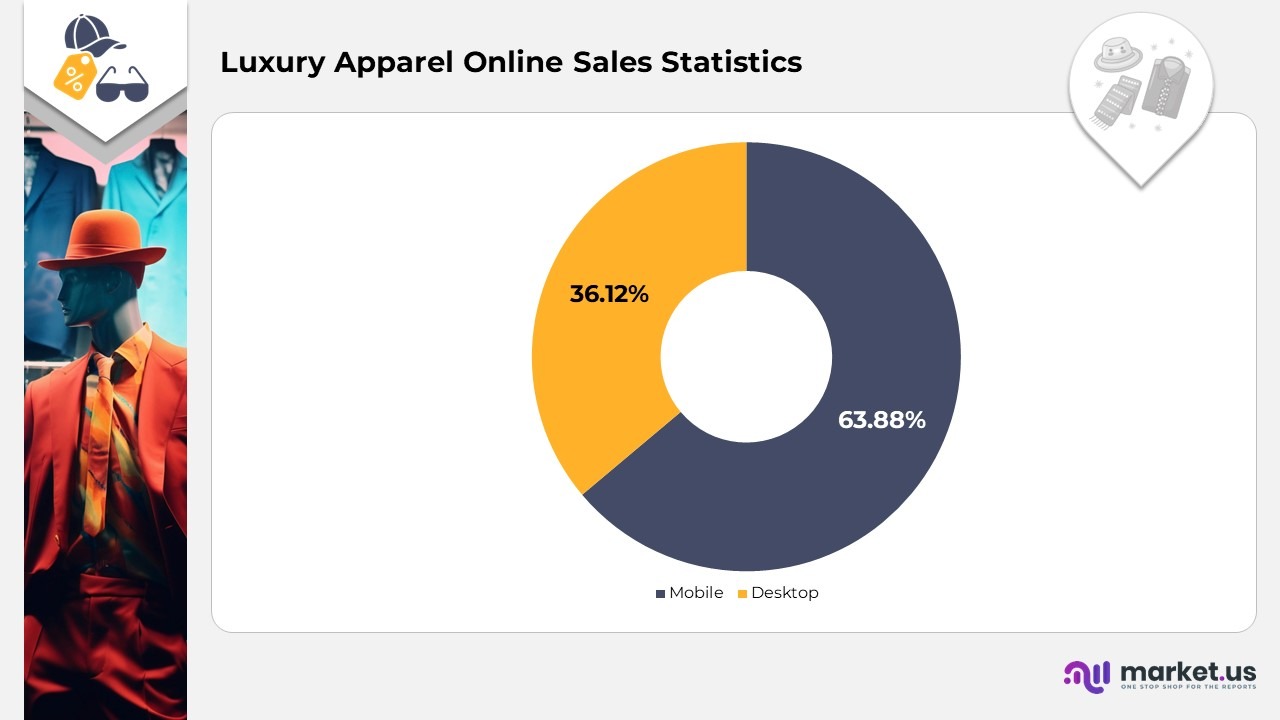
Luxury Apparel Online Sales Statistics
- In the luxury fashion e-commerce sector, mobile devices hold a crucial position, contributing to a significant 63.88% of online sales.
- Despite the dominance of mobile devices in sales, desktop usage continues to be significant in the luxury segment, accounting for a notable 36.11% of online sales.
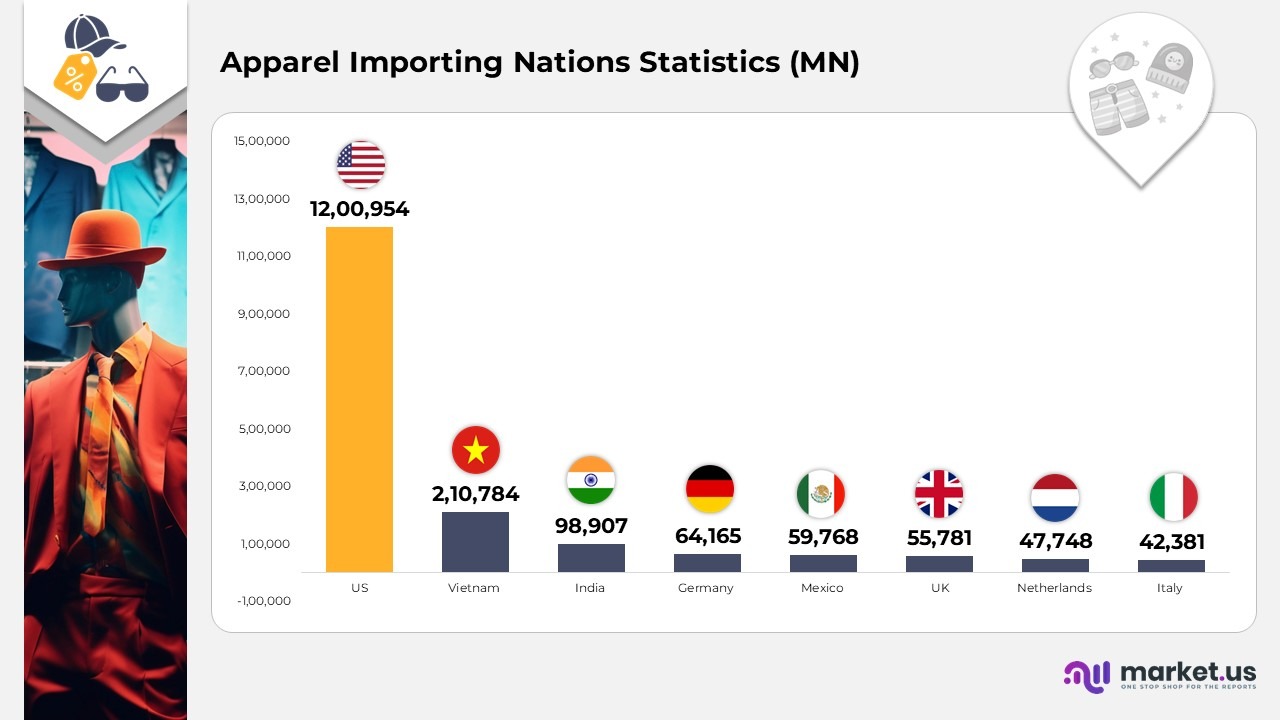
Apparel Importing Nations Statistics
- The United States holds the top position with an impressive import value of 1,200,954 million USD.
- Vietnam is in second place with a considerable import value of 210,784 million USD.
- India is ranked third, boasting an import value of 98,907 million USD.
- Germany continues to uphold a strong standing with an import value of 64,165 million USD.
- Mexico makes a significant contribution with an import value of 59,768 million USD.
- The United Kingdom displays a substantial import value of 55,781 million USD.
- The Netherlands demonstrates resilience with an import value of 47,748 million USD.
- Italy sustains a notable import value of 42,381 million USD.
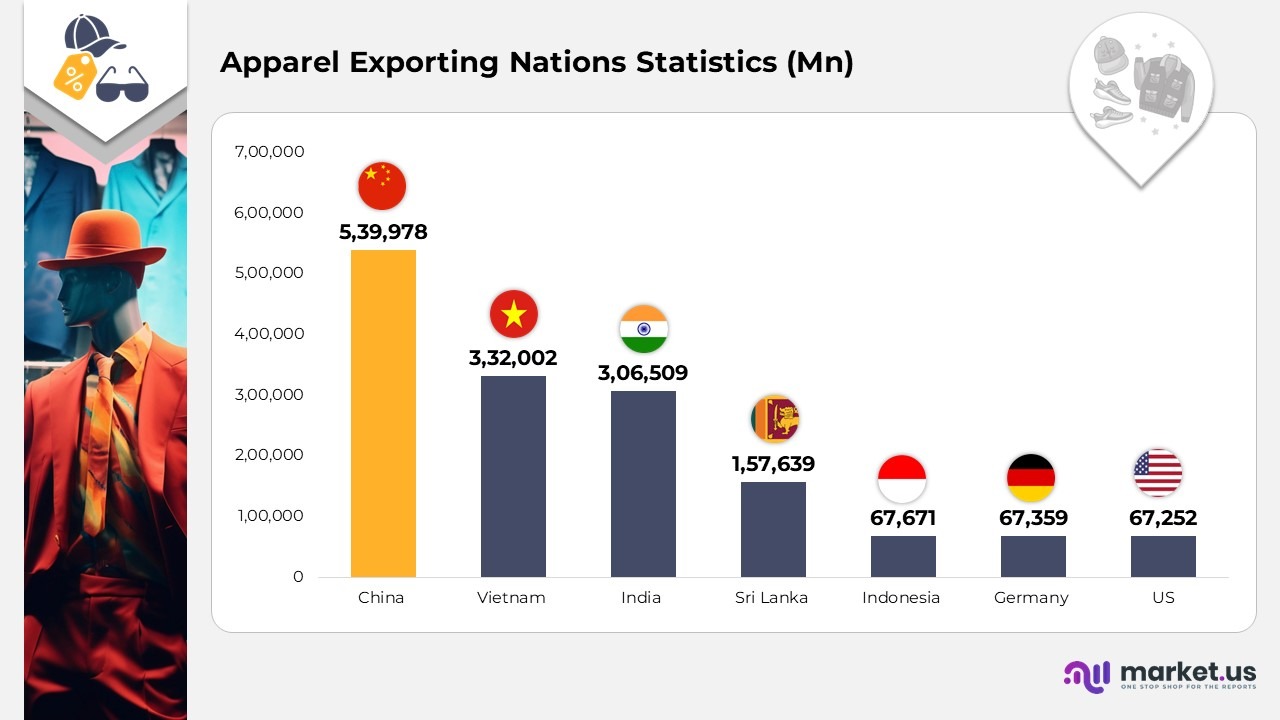
Apparel Exporting Nations Statistics
- China holds the top position with an export value of 539,978 million USD.
- Vietnam closely follows China, boasting an export value of 332,002 million USD.
- India secures the third position with an export value of 306,509 million USD.
- Sri Lanka stands out as a significant exporter with an export value of 157,639 million USD.
- Indonesia plays a crucial role with an export value of 67,671 million USD.
- Germany upholds a robust standing with an export value of 67,359 million USD.
- The United States showcases its global influence with an export value of 67,252 million USD.
Fun Facts in Apparel
- The loincloth is recognized as the oldest garment, while the skirt holds the title of the second oldest, remaining quite fashionable in contemporary times.
- Every year, thousands of fashion magazines are sold, with the first edition having been published in Germany in 1586.
- Despite the rising costs of many goods, the price of clothing has actually seen a decline, with a reduction of 8.5% since 1992.
- In 1907, a woman was apprehended on a beach in Boston for donning a one-piece swimsuit.
- Over the years, bras have evolved through various styles, and today, it is possible to buy a bra that doubles as a gas mask.
Recent Developments
- In March 2024, Amazon Fashion revealed the introduction of its innovative sustainable clothing line, “Lakefront,” which is designed to minimize carbon emissions and water consumption in the production of apparel. This strategic initiative establishes Amazon as a prominent contender in the expanding sector of eco-conscious fashion.
- In October 2024, Shein, the Chinese online fast-fashion retailer, secured USD1 billion in a funding round spearheaded by Coatue Management. This substantial investment will facilitate Shein’s growth into new markets and enhance its technological and logistical frameworks.
Apparel Future Predictions
- The projected size of the online apparel retail market is expected to grow by USD 343.2 billion, with a compound annual growth rate (CAGR) of 16.2% from 2024 to 2029.
Conclusion
The clothing sector represents a vast and expanding global market propelled by technological advancements, consumer interest in sustainability, and the rise of e-commerce. It encounters obstacles such as trade disputes and concerns regarding labor practices; however, significant trends like smart textiles, virtual fitting rooms, and ethical production are influencing its future development. In summary, the sector is defined by ongoing innovation, a commitment to sustainability, and changing trends driven by consumer preferences.