


Report Overview
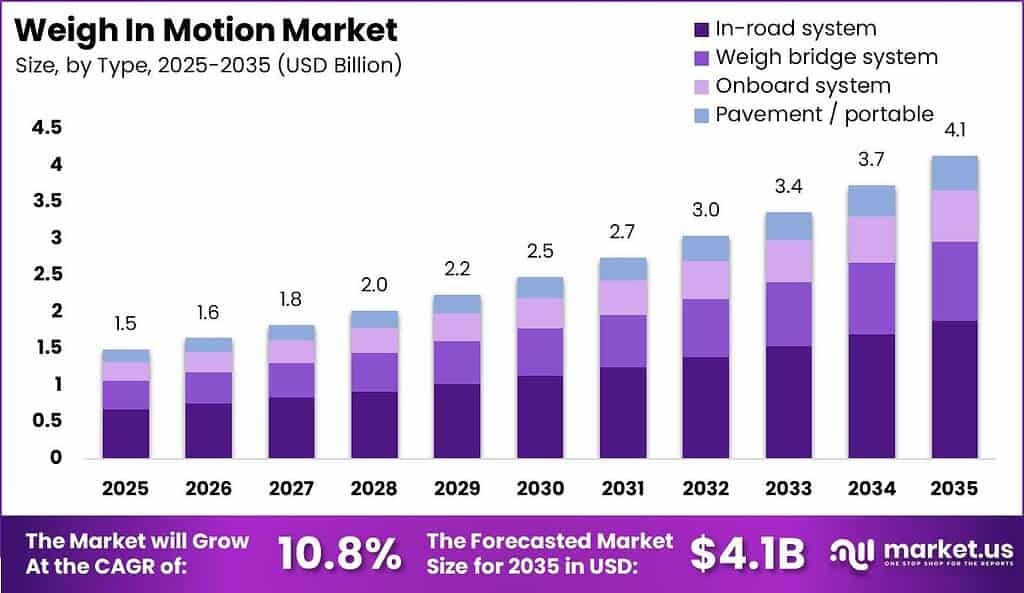
Global Weigh In Motion Market size is expected to be worth around USD 4.10 Billion by 2035 from USD 1.50 Billion in 2025, growing at a CAGR of 10.8% during the forecast period 2026 to 2035. This trajectory favors suppliers that convert one time lane hardware into multi year calibration and data service contracts. Agencies that lock certified systems early reduce later replacement cost against rising civil works inflation.
Weigh in motion systems measure axle loads and gross vehicle weight while trucks keep moving on highways, bridges, ports, and industrial sites. The market structure splits across installation type, sensor technology, operating function, and end application. Therefore buyers treat accuracy class, uptime, and enforcement admissibility as the main purchase filters rather than sticker price alone.
Key Takeaways
- The market is valued at USD 1.50 Billion in 2025 and is projected to reach USD 4.10 Billion by 2035 at a CAGR of 10.8%.
- In road systems lead the type mix with a 45.6% share.
- Piezoelectric sensors lead sensor technology with a 44.5% share.
- Weight enforcement leads functions with a 33.4% share.
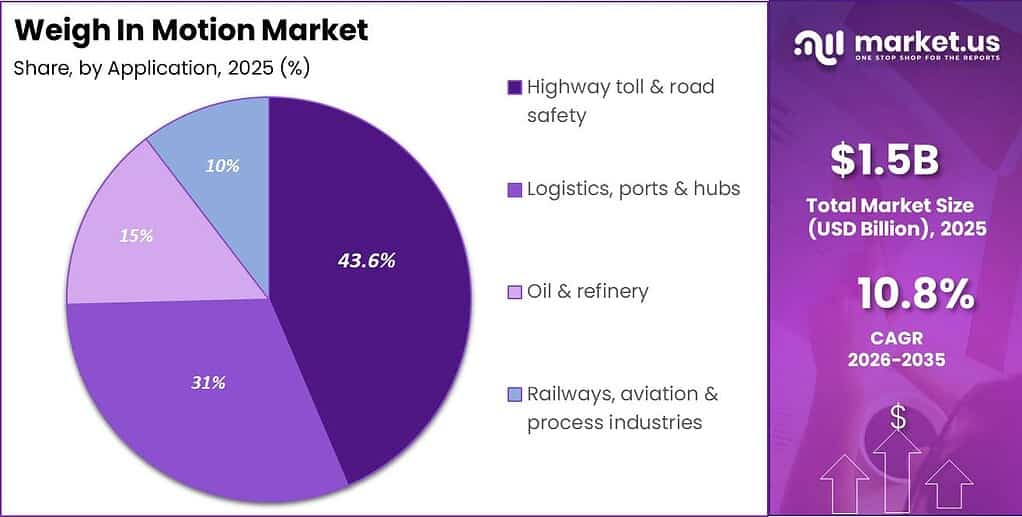
- Highway toll and road safety lead applications with a 43.6% share.
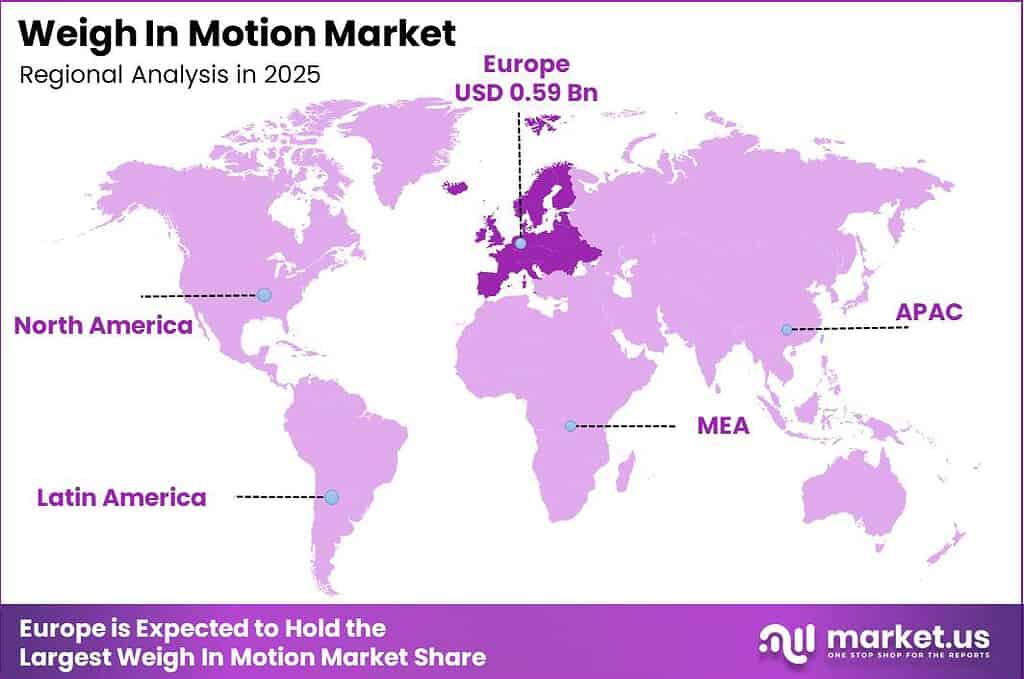
- Europe leads regionally with a 39.8% share valued at USD 0.59 Billion.
According to the NYC Department of Transportation report, automated WIM enforcement on the Staten Island bound Brooklyn Queens Expressway cut identified overweight trucks by 65% from March to October 2025 while throughput held near 160,000 trucks per month. This outcome shows enforcement grade lanes can protect pavement without choking freight flow. Consequently corridor operators gain a clear budget case for expanding screening before adding static scale capacity.
As per our research, Quarterhill’s March 2026 Massachusetts contract covers installation of 15 new WIM stations across MassDOT Districts 1 to 5 with vehicle identification and tire anomaly equipment. This award links state freight growth to denser roadside sensing rather than manual inspection alone. In December 2025, Kistler Group expanded EcoRodovias deployments in Brazil with KiTraffic Digital technology, adding four sites in 2025 and planning at least six more stations for 2026.
Type Analysis
In-road system dominates with 45.6% due to permanent embedded highway sensor lanes.
In 2025, In-road system held a dominant market position in the By Type segment of Weigh In Motion Market, with a 45.6% share. American Trucking Associations data show trucks moved roughly 72.7% of U.S. freight by weight in 2024, equal to about 11.27 billion tons. Permanent in road lanes sit inside that continuous freight stream and feed enforcement without stopping traffic. Vendors who package civil works with long calibration contracts will hold the densest recurring revenue base.
Weigh bridge systems serve controlled low speed checkpoints where agencies still need static grade verification after high speed screening flags a suspect truck. Eurostat reports EU road freight reached 1,869 billion tonne kilometres in 2024, up 0.6% from 2023. That volume keeps hybrid site designs relevant at border posts and inland inspection yards. Suppliers that pair bridge decks with upstream in road filters win tenders that demand both throughput and legal proof.
Onboard systems represent the fastest growing type because fleets want load data on the vehicle rather than only at roadside. U.S. DOT figures cited by American Trucking Associations show almost 580,000 active motor carriers registered with FMCSA as of June 2025, and 91.5% run 10 or fewer trucks. Light onboard kits fit that fragmented buyer base better than full pavement rebuilds. As of July 2026, Kistler reported a global installed base of more than 100,000 Lineas quartz WIM sensors and shifted final manufacturing to Buffalo, New York. Pavement and portable units hold the remaining share for temporary surveys and construction detours.
Sensor Technology Analysis
Piezoelectric sensors dominate with 44.5% due to highway speed measurement stability.
In 2025, Piezoelectric sensors held a dominant market position in the By Sensor Technology segment of Weigh In Motion Market, with a 44.5% share. Kistler reported in December 2025 that KiTraffic Digital WIM cut invalid traffic data from more than 30% to less than 5% on EcoRodovias multi lane free flow tolling in Brazil. That quality jump raises toll trust and lowers manual review cost. Sensor vendors who prove similar invalid rate cuts will displace older strips during corridor upgrades.
Bending plate arrays remain the workhorse where agencies want durable plates for screening lanes that feed secondary static checks. ISWIM guidance frames WIM as dynamic tyre force measurement used to estimate axle and gross weights for enforcement and planning. This structural role keeps bending plates inside many high speed screening designs that still require a legal backup scale. Contractors who stock certified plates shorten lane closure windows on busy interstates.
Load cell systems support applications that prioritize stable force measurement under controlled approach geometry at plazas and industrial gates. ASTM and OIML aligned site designs still specify load cells where pavement noise would degrade strip sensors. This creates a premium niche for manufacturers with metrology pedigrees. Buyers pay more per lane when courtroom grade consistency outweighs lowest installed cost.
Other sensors spanning inductive, magnetic, radar, and LiDAR form the fastest growing technology set as sites fuse weight with class and presence data. In May 2025, Kistler Group launched a cloud based software platform that combines structural health monitoring with weigh in motion data to judge bridge condition against real axle loads. This means sensor value now includes analytics attach rates, not only strip hardware. Vendors who open clean data APIs will capture that software margin layer.
Function Analysis
Weight enforcement dominates with 33.4% due to statutory overload compliance mandates.
In 2025, Weight enforcement held a dominant market position in the By Function segment of Weigh In Motion Market, with a 33.4% share. American Trucking Associations notes combination and single unit trucks logged about 329.86 billion miles in 2023 across U.S. roads. That exposure keeps overload screening central to pavement and bridge protection budgets. Solution providers who certify direct enforcement accuracy win the highest ASP lane awards.
Weight based toll collection uses axle and gross weight signals to price heavy vehicles more fairly on managed corridors. European road freight performance stayed near 1,869 billion tonne kilometres in 2024, sustaining political pressure for user pays models on freight intensive routes. This reflects a shift from flat tolls toward load linked charges. Integrators who bind WIM outputs to toll host systems gain sticky multi year operations revenue.
Vehicle profiling is the fastest growing function because agencies want class, axle pattern, and anomaly cues alongside weight. Caltrans’ May 2026 virtual WIM pilot stated that truck weight, size, image, and violation data would reach enforcement staff within seconds at two evaluation sites, one urban and one rural. Near real time profiles cut empty chase miles for patrol units. Vendors who deliver seconds class latency will define the next virtual station standard.
Axle counting and traffic data collection hold the remaining functional share for planning models and pavement design inputs. Quarterhill’s two Indiana WIM and virtual WIM agreements announced in April 2026 carried a combined estimated value of USD 13 million over a four year operating period from May 1, 2026 through April 30, 2030. Long operating windows show states buying data continuity, not only sensors. Firms that price operations and analytics inside the award will outearn pure hardware bidders.
Application Analysis
Highway toll and road safety dominates with 43.6% due to corridor toll and protection needs.
In 2025, Highway toll and road safety held a dominant market position in the By Application segment of Weigh In Motion Market, with a 43.6% share. Eurostat data show EU road freight at 1,869 billion tonne kilometres in 2024, with international haulage still above 720 billion tonne kilometres. Dense highway freight keeps toll and safety agencies as the primary WIM wallet. Contractors aligned with national road authorities will capture the largest multi lane packages.
Logistics, ports, and hubs deploy WIM to verify container and trailer loads before yard entry and exit gates. UNCTAD reports maritime trade volumes reached about 12,720 million tons in 2024 and projects only about 0.5% seaborne volume growth in 2025, which still leaves ports under pressure to raise landside productivity. Gate weighing without stopping every truck protects turnaround targets. Suppliers who ruggedize systems for stop and go yard traffic win private operator budgets outside highway tenders.
Oil and refinery sites use weigh in motion to control bulk truck loading accuracy and reduce overload risk on private access roads. Continuous weighing supports custody checks where product value and axle limits both matter. This creates specialized demand for corrosion aware sensors and explosion conscious cabinets. Vendors with industrial metrology experience can price above highway commodity bids.
Railways, aviation, and process industries form the remaining application pool for multimodal freight weight checks at intermodal handoffs and plant gates. World Bank transport notes highlight large freight corridor investments, including 1,200 km of dedicated freight track added in India between 2011 and 2024. Cross mode weight continuity becomes a planning requirement as cargo shifts among truck, rail, and airside vehicles. Early movers who offer transferable data models will open accounts beyond pure highway agencies.
Key Market Segments
By Type
- In-road system
- Weigh bridge system
- Onboard system
- Pavement / portable
By Sensor Technology
- Piezoelectric sensors
- Bending plate
- Load cell systems
- Other sensors (inductive, magnetic, radar, LiDAR, etc.)
By Function
- Weight enforcement
- Weight-based toll collection
- Vehicle profiling
- Axle counting
- Traffic data collection
By Application
- Highway toll & road safety
- Logistics, ports & hubs
- Oil & refinery
- Railways, aviation & process industries
Regional Analysis
Europe Dominates the Weigh In Motion Market with a Market Share of 39.8%, Valued at USD 0.59 Billion
Europe’s lead rests on dense cross border trucking and early type approval pressure that pulls agencies toward certified high speed lanes. Eurostat records EU road freight at 1,869 billion tonne kilometres in 2024, so corridor managers treat axle load control as core asset protection. This signals stable replacement demand as legacy scales age out. Suppliers with EU compliance files and local service crews will defend share against lower priced imports.
North American programs are scaling station counts through statewide capital packages rather than isolated pilots. Data from MassDOT show the December 2025 WIM project covered 15 stations, with four new sites and upgrades to 11 existing sites across five transportation districts and 12 interstate or state route corridors. As per our research, the same 2025 statewide expansion posted a low bid of USD 23,776,784.13 and an overall project budget of USD 28,027,301.75. Large bundled awards favor primes who can finance long civil timelines.
Key Regions and Countries
North America
- US
- Canada
Europe
- Germany
- France
- The UK
- Spain
- Italy
- Rest of Europe
Asia Pacific
- China
- Japan
- South Korea
- India
- Australia
- Rest of APAC
Latin America
- Brazil
- Mexico
- Rest of Latin America
Middle East and Africa
- GCC
- South Africa
- Rest of MEA
Market Dynamics
Market Opportunity Analysis - Onboard kits, virtual stations, and multimodal gates still lack scaled specialist offerings
Onboard systems remain underexploited relative to fixed in road leadership even though fragmented carriers need lighter compliance tools. Most capital still flows to pavement embedded lanes controlled by highway agencies. This creates space for fleet oriented subscription hardware that installs without lane closures. Entrants who sell through telematics channels can reach owner operators that never appear in public tenders.
Vehicle profiling and virtual station designs are still early versus classic weight enforcement share. Many corridors stop at axle weight capture and never deliver seconds class image and violation packages to officers. Therefore software first challengers can differentiate without pouring new concrete on every site. Investors should favor stacks that reuse existing loops and cameras before funding greenfield civil works.
Logistics ports and hub gates trail highway toll and road safety budgets despite heavy yard congestion costs. Private terminal buyers often lack the framework agreements that national road agencies publish. This means shorter sales cycles exist for vendors willing to finance gate pilots against throughput KPIs. A focused port product line can avoid head on fights with highway primes.
Railways, aviation, and process industry handoffs are thinly covered compared with interstate mainlines. Multimodal weight continuity is rarely packaged as a single data product today. As a result, specialists who normalize truck, rail, and airside load records can own a niche the big ITS vendors ignore. Early regional beachheads around freight airports and inland terminals offer cleaner proof points than national highway frameworks.
Technology and Innovation Landscape - High speed sensing, virtual screening, and analytics redefine vendor edges
High speed strip and plate sensing now underpins direct enforcement ambitions where legal metrology rules allow automated fines. Accuracy classes and temperature compensation decide whether a lane stays advisory or becomes prosecutable. Manufacturers who publish independent type approval results shorten agency risk reviews. Buyers should treat certification files as a primary bid filter beside unit price.
Virtual weigh station architectures combine roadside weight with imaging and identity so officers act only on likely violators. The operating idea is selective interception rather than stopping every truck. This creates demand for low latency backhaul and clean event messaging into dispatch tools. Integrators who own the event workflow will capture more value than sensor only sellers.
Multi lane free flow tolling stacks now expect weight inputs beside class and plate data for fair heavy vehicle pricing. Toll hosts need continuous validity flags when sensor health drops. This signals a shift toward health monitoring firmware inside the roadside cabinet. Vendors who expose trust scores with each weight record will win modern toll expansions.
Tire anomaly and vehicle identification add ons are turning basic WIM sites into broader commercial vehicle screening nodes. Agencies want one stop roadside intelligence rather than separate tire, weight, and credential gadgets. Consequently platform vendors can raise average revenue per station through modular licenses. Hardware pure plays risk relegation to component supply inside someone else’s station controller.
Drivers
Highway weight enforcement mandates have turned continuous verification from optional safety spend into statutory procurement. FHWA funding cycles in 2024 and 2025 sped U.S. high speed tenders, while the CEN type approval update finalized in 2024 pushes EU 27 authorities to replace non compliant scales before the phased 2027 deadline. As per our research, average enforcement tender cycles compressed from about 18 months to under 11 months since 2024.
OIML R134 Class B(10) accuracy rules lifted average selling prices per lane by roughly 12% to 15%. Blended vendor gross margins are moving from about 28% toward the 34% to 36% range as calibration and firmware attachments scale. This means incumbents with framework agreements cut acquisition cost while locking recurring service revenue that pure hardware sales never delivered.
| Driver | (~) % Impact on CAGR Forecast | Geographic Relevance | Impact Timeline |
|---|---|---|---|
| Highway weight enforcement mandates & pavement-protection statutes | +2.4% | North America & Europe | Short term (2 years or less) |
| Intelligent Transportation System (ITS) infrastructure deployment | +2.0% | Global (Asia-Pacific, EU, North America) | Short term (2 years or less) |
| Weight-based tolling integration on managed highway corridors | +1.6% | Europe, Asia-Pacific | Medium term (2 to 4 years) |
| Rising cross-border freight & commercial vehicle volumes | +1.5% | Global, led by Asia-Pacific | Short term (2 years or less) |
| Port & logistics hub automation for container/freight verification | +1.3% | Asia-Pacific, Middle East | Medium term (2 to 4 years) |
| Public-private partnership (PPP) financing of highway modernization in developed & select emerging economies | +1.2% | North America, Europe, select emerging Asia | Medium term (2 to 4 years) |
Restraints
High upfront capital for enforcement grade high speed lanes remains the main brake on unit growth in discretionary budgets. A full lane needs deep pavement works, cabinets, and backhaul, while World Bank transport lending indices show emerging market borrowing costs rose about 150 to 200 basis points between 2023 and 2025. Elevated rates shrink the free cash road agencies can spare beyond mandatory resurfacing.
OECD tracking shows public road maintenance capital budgets across member economies grew under 3% annually while specialized sensor grade civil works inflated about 8% to 10%. Sales cycles stretch 12 to 18 months past original tender plans and force build to suit financing. Project level margins compress by roughly 4 to 6 percentage points, delaying hardware revenue recognition for milestone billed manufacturers.
| Restraint | (~) % Impact on CAGR Forecast | Geographic Relevance | Impact Timeline |
|---|---|---|---|
| High upfront capital/installation cost of high-speed enforcement-grade WIM systems | -1.8% | Global, acute in emerging markets | Short term (2 years or less) |
| Elevated interest-rate environment tightening public infrastructure lending | -1.3% | North America, Europe | Short term (2 years or less) |
| Mandatory OIML R134/ASTM E1318 certification gating new-market entry | -1.1% | European Union, select Asia-Pacific markets | Short term (2 years or less) |
| Fiscal austerity-driven public procurement freezes on non-critical infrastructure spend | -0.9% | Select EU economies, Latin America | Short term (2 years or less) |
| Right-of-way & lane-closure permitting restrictions delaying installation | -0.8% | North America, Europe | Short term (2 years or less) |
Challenges
Sensor accuracy drift from pavement flexure, temperature strain, and axle dynamics remains the hardest field problem. NIST linked calibration work and OIML R134 Class B(10) rules call for axle weight tolerances within 7%, yet agency audits find unmitigated error rates of 12% to 15% within 18 to 24 months in extreme temperature corridors. Drift undermines enforcement admissibility and doubles recalibration frequency versus brochure claims.
ASTM E1318 working group evidence shows pavement rutting under sensor strips can add another 3% to 5% measurement drift each year on heavy freight routes. Vendors already redirect about 6% to 8% of annual R&D spend into temperature compensated piezo quartz and fiber optic designs. This creates a service revenue stream in extended warranties while it caps hardware gross margins even as shipment counts rise.
| Challenge | (~) % CAGR Friction Drag | Geographic Relevance | Mitigation Horizon |
|---|---|---|---|
| Sensor accuracy degradation | -1.0% | Global | Medium term (2 to 4 years) |
| Multi-vendor data fusion friction | -0.9% | Global | Medium term (2 to 4 years) |
| Calibration technician talent shortage | -0.8% | North America, Europe | Medium term (2 to 4 years) |
| Load-cell component lead-time volatility | -0.6% | Global, Asia-Pacific supply dependency | Medium term (2 to 4 years) |
| Fragmented vendor interoperability | -0.5% | Global | Long term (4 years or more) |
Opportunities
The largest white space is turning installed WIM lanes into a data as a service and predictive analytics layer rather than a one time capital sale. ITS America architecture guidance and ISO 17444 data exchange pilots show room to bundle pavement wear forecasts, axle load outlooks, and virtual permitting on top of existing sensors. This path targets customers beyond enforcement, including insurers and logistics planners.
If vendors productize that layer, blended margins can move from hardware heavy 28% to 32% toward software like 55% to 65% profiles seen in adjacent ITS subscription models. World Bank digital infrastructure reviews of pilots suggest cost per lane mile monitored could fall 20% to 25% as analytics amortize sensor CapEx. Early movers who own the data standard will set switching costs before hardware rivals catch up.
| Opportunity | (~) % Potential CAGR Upside | Geographic Relevance | Execution Window |
|---|---|---|---|
| AI/ML predictive analytics & data-as-a-service monetization layer | +1.8% | Global, early North America & Europe | Medium term (2 to 4 years) |
| Frontier highway corridor expansion via multilateral development bank financing | +1.5% | Sub-Saharan Africa, Southeast Asia, Latin America | Long term (4 years or more) |
| Integration with autonomous/connected-vehicle telematics for real-time load compliance | +1.2% | Global, early North America & Europe | Long term (4 years or more) |
| Adjacent rail & multimodal freight weight-monitoring expansion | +1.0% | Global | Medium term (2 to 4 years) |
| Retrofit upgrade cycle for legacy low-speed installations to IoT-enabled high-speed systems | +0.9% | North America, Europe | Medium term (2 to 4 years) |
Key Company Insights
Kapsch TrafficCom AG positions itself as a full corridor ITS prime that embeds weigh in motion inside broader traffic management awards rather than selling sensors alone. In August 2025, Kapsch TrafficCom AG implemented an intelligent transportation system on Mexico’s Palmillas Apaseo Highway that included two weigh in motion stations and five axle based traffic classification points. Bundled scope raises switching costs and protects margin when pure sensor rivals undercut hardware.
Q-Free ASA competes through tolling and traffic management platforms where weight data can feed pricing and enforcement modules over the network life. This software centric stance helps the firm stay relevant as agencies shift spend from cabinets toward operations dashboards. However, lighter owned sensor manufacturing depth can leave delivery dependent on partner hardware quality during large civil rollouts.
Key Players
- Kapsch TrafficCom AG
- Q-Free ASA
- Kistler Group (Kistler Instruments AG)
- METTLER TOLEDO
- TE Connectivity Ltd.
- International Road Dynamics Inc. (IRD)
- Avery Weigh-Tronix
- Axis Communications AB
- Siemens Mobility / Siemens AG
- SWARCO AG
- Cardinal Scale Manufacturing Company
- Intercomp Company
- CAMEA
- EFKON India Pvt. Ltd.
- Traffic Data Systems
Recent Developments
- January 2025: International Road Dynamics Inc. (IRD), through parent company Quarterhill, secured a contract to supply high speed weigh in motion technology, software, technical support, and training for a Brussels Capital Region commercial vehicle enforcement station.
- August 2025: International Road Dynamics Inc. (IRD), through parent company Quarterhill, secured contracts for WIM deployments in Djibouti, South Korea, and Thailand, including high speed bending plate screening lanes and slow speed verification lanes in Djibouti.
- October 2025: International Road Dynamics Inc. (IRD), through parent company Quarterhill, secured a USD 2.7 million Arkansas Department of Transportation project incorporating highway speed WIM sensors and real time tire anomaly detection into commercial vehicle screening systems.
Geopolitical Impact Analysis
Figures from UNCTAD show seaborne trade growth slowing to about 0.5% in 2025 after 2.2% volume growth in 2024, while ton mile demand jumped nearly 6% on longer reroutes. Red Sea avoidance adds roughly 10 to 14 days on Asia Europe strings and pushes more cargo onto inland truck legs at discharge ports. This creates urgent need for port approach and highway WIM capacity where diverted boxes reconcentrate.
Data from UNCTAD linked maritime reviews also note shipping still moves over 80% of world merchandise trade by volume, so freight shocks travel quickly into road axle loads. WTO economists lifted the 2025 merchandise trade growth view to 2.4% while warning the 2026 outlook softens as tariff uncertainty builds. As a result, WIM buyers in gateway states should plan flexible portable and virtual coverage for swing lanes rather than only fixed mainline sites.
Report Scope
| Report Features | Description |
|---|---|
| Market Value (2025) | USD 1.50 Billion |
| Forecast Revenue (2035) | USD 4.10 Billion |
| CAGR (2026-2035) | 10.8% |
| Base Year for Estimation | 2025 |
| Historic Period | 2020-2024 |
| Forecast Period | 2026-2035 |
| Report Coverage | Revenue Forecast, Market Dynamics, Market Opportunity Analysis, Technology and Innovation Landscape, Competitive Landscape, Recent Developments |
| Segments Covered | By Type (In-road system, Weigh bridge system, Onboard system, Pavement / portable), By Sensor Technology (Piezoelectric sensors, Bending plate, Load cell systems, Other sensors (inductive, magnetic, radar, LiDAR, etc.)), By Function (Weight enforcement, Weight-based toll collection, Vehicle profiling, Axle counting, Traffic data collection), By Application (Highway toll & road safety, Logistics, ports & hubs, Oil & refinery, Railways, aviation & process industries) |
| Regional Analysis | North America (US and Canada), Europe (Germany, France, The UK, Spain, Italy, and Rest of Europe), Asia Pacific (China, Japan, South Korea, India, Australia, and Rest of APAC), Latin America (Brazil, Mexico, and Rest of Latin America), Middle East and Africa (GCC, South Africa, and Rest of MEA) |
| Competitive Landscape | Kapsch TrafficCom AG, Q-Free ASA, Kistler Group (Kistler Instruments AG), METTLER TOLEDO, TE Connectivity Ltd., International Road Dynamics Inc. (IRD), Avery Weigh-Tronix, Axis Communications AB, Siemens Mobility / Siemens AG, SWARCO AG, Cardinal Scale Manufacturing Company, Intercomp Company, CAMEA, EFKON India Pvt. Ltd., Traffic Data Systems |
| Customization Scope | Customization for segments, region / country-level will be provided. Additional customization can be done based on requirements. |
| Purchase Options | We have three licenses to opt for: Single User License | Multi-User License (Up to 5 Users) | Corporate Use License (Unlimited User and Printable PDF) |





































