


Quick Navigation
Report Overview
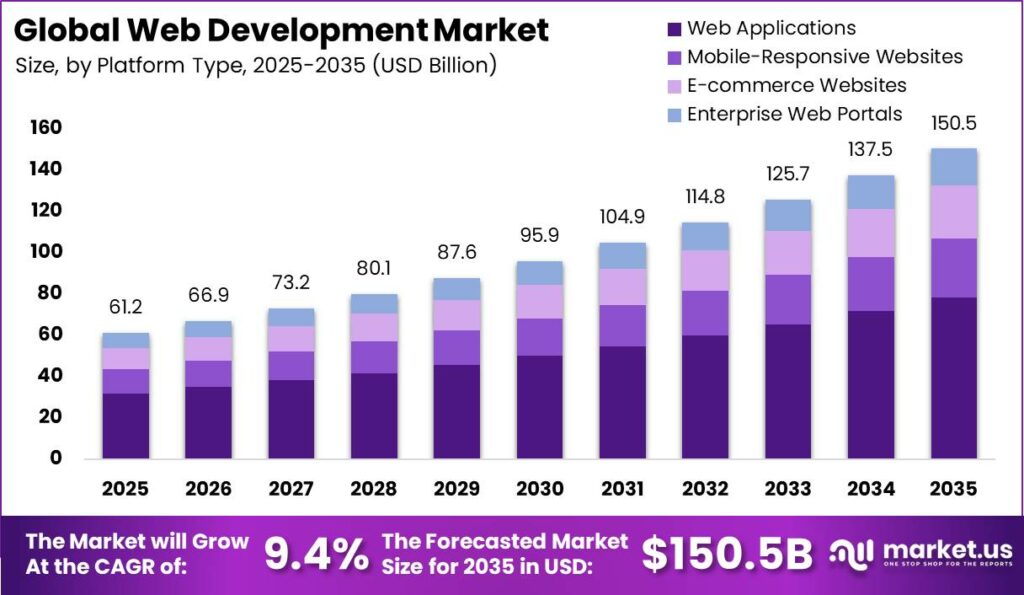
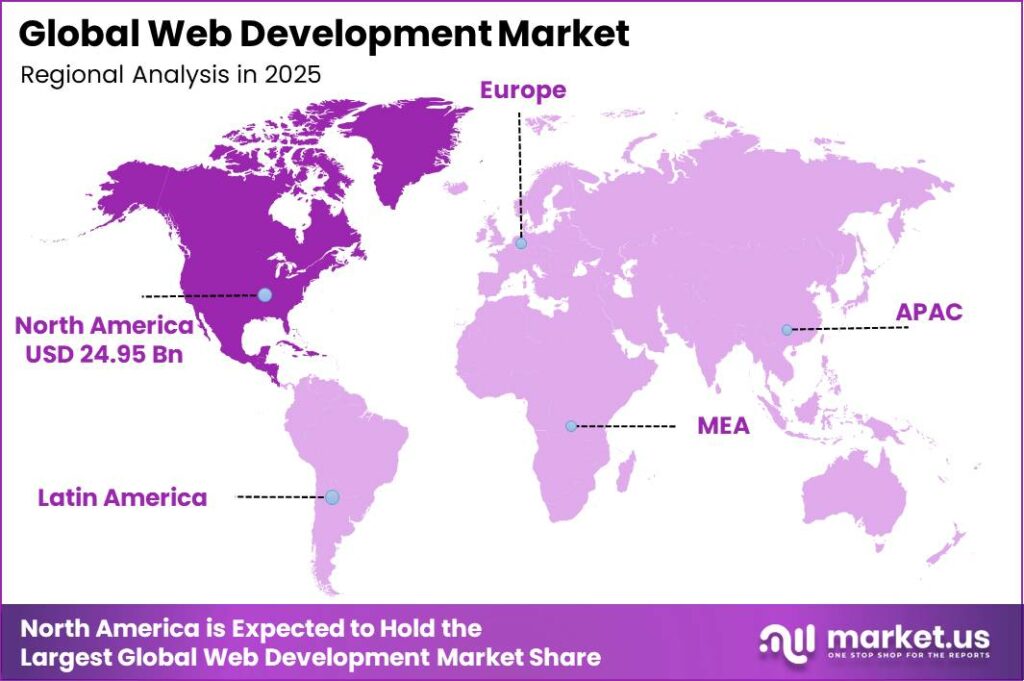
In 2025, the Global Web Development Market was valued at USD 61.2 billion. The market is projected to grow at a CAGR of 9.4% during 2026–2035, reaching approximately USD 150.5 billion by 2035. North America dominated the global market in 2025, accounting for more than 40.8% of the total market share and generating approximately USD 24.95 billion in revenue.
According to the International Telecommunication Union (ITU), roughly 6 billion people, about 74% of the world’s population, were online in 2025, up from 5.8 billion in 2024, adding over 240 million new users in a single year. Every one of these new users needs websites, apps, and online platforms to shop, bank, learn, and connect, which pushes businesses to build and upgrade their web presence. This demand is amplified by e-commerce, one of the biggest drivers of web development work.
The U.S. Census Bureau reported that American e-commerce sales hit USD 1.234 trillion in 2025, a 5.4% jump from 2024, with online sales making up 23.1% of total retail sales that year. As more retailers move online or expand their digital storefronts, they require custom websites, secure payment systems, and mobile-friendly designs, work that falls squarely within the web development market.
The World Bank also notes that a 10% rise in broadband penetration can lift GDP by 0.25%, showing how digital infrastructure growth feeds directly into economic activity that depends on web-based services. ITU data shows the Americas region has internet usage between 88% and 93%, among the highest in the world, meaning nearly every business and consumer interaction has some online touchpoint.
This high connectivity, combined with the region’s advanced e-commerce base of over USD 1.2 trillion in the U.S. alone, creates constant demand for new websites, app development, and digital upgrades. As 5G networks now cover 55% of the world’s population, faster mobile internet is pushing companies everywhere to build lighter, faster, and more interactive websites, which will keep fueling market growth toward 2035.
Key Takeaway
- The Global Web Development Market was valued at USD 61.2 billion in 2025 and is projected to reach USD 150.5 billion by 2035, growing at a CAGR of 9.4% during 2026–2035.
- Front-End Development was the largest development type, accounting for 38.4% of the global market.
- Web Applications held the largest platform type share at 52.1%.
- JavaScript Frameworks (React, Angular, and Vue) led the technology segment with a 41.3% market share.
- Cloud-Based Development Platforms dominated the deployment mode segment, capturing 66.8% of the market.
- E-commerce Websites represented the largest application segment with a 34.9% share.
- IT & Software Companies were the largest end-user segment, accounting for 44.7% of the market.
- Traditional Coding remained the leading development approach with a 49.6% market share.
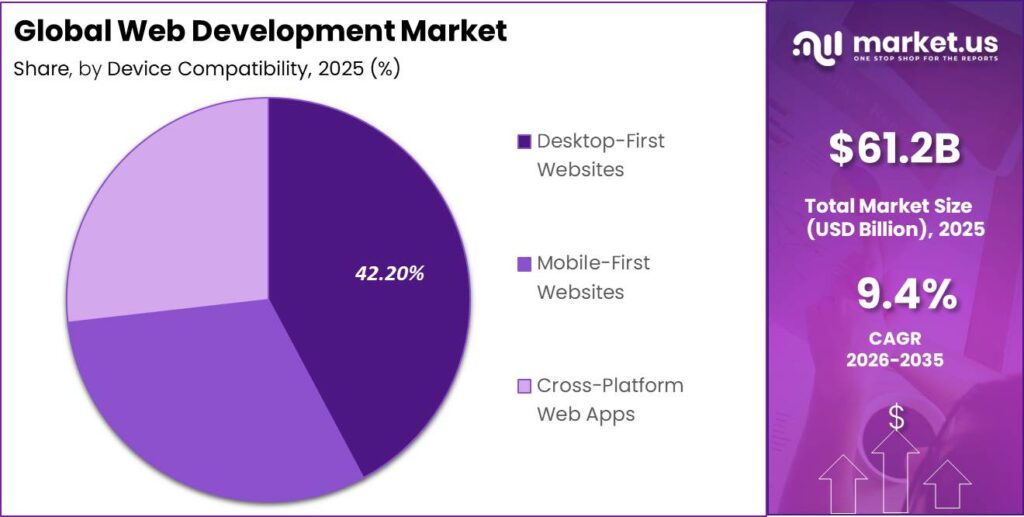
- Desktop-First Websites led the device compatibility segment with a 42.2% share.
- North America dominated the market with a 40.8% share in 2025, generating approximately USD 24.95 billion in revenue.
Development Type
Front-End Development held a dominant market position, capturing more than a 38.4% share. Interface-focused hiring has stayed strong because so much of a visitor’s judgment about a website happens in the first few seconds on the page. Stack Overflow’s 2025 survey found front-end developers report the highest AI-tool usage of any role at 69%, showing how much this group leans on new tooling to speed up repetitive layout and styling work.
On the technology side, JavaScript remains embedded in 98.9% of all websites as the client-side language of choice, which keeps front-end skillsets tied directly to browser-based development regardless of framework trends. Through 2025 and into 2026, businesses kept investing in this layer because mobile browsing now accounts for roughly 51.47% of global device traffic, pushing teams to prioritize responsive, fast-loading interfaces. Agencies and in-house teams alike treated front-end polish as non-negotiable heading into 2026, since a slow or clunky page directly affects how long a visitor stays.
Full-Stack Development is emerging as a fast-growing segment in 2025, holding around a 25.00% share of the market. Stack Overflow’s 2025 developer survey found that 27% of professional respondents now identify primarily as full-stack, making it the single largest role reported that year. This growth lines up with hiring patterns at smaller companies and startups, where budget constraints push teams toward developers who can handle both the interface and the server logic without needing a larger department.
The same survey noted full-stack developers rank among the top three roles for AI tool adoption at 65%, a sign that these professionals lean heavily on automation to manage the wider range of tasks their role covers. Through 2025 and into 2026, bootcamps and training platforms responded to this demand by expanding full-stack curricula, matching what recruiters kept listing as a top requirement in job postings.
Platform Type
Web Applications held a dominant market position, capturing more than a 52.1% share. Businesses have leaned into browser-based platforms partly because SaaS delivery, which depends entirely on web applications, reached a global market size of roughly 408.21 billion dollars in 2025, according to industry-wide figures. Enterprise SaaS spending itself grew about 18% year over year between 2024 and 2025, a pace that outstripped overall IT budget growth of 8% during the same period.
This momentum reflects how much operational software has shifted into the browser rather than living on individual desktops. Through 2025, public cloud spending, which underpins most modern web application hosting, rose to 723.4 billion dollars globally, up 21.5% from 595.7 billion dollars the previous year. Heading into 2026, distributed teams increasingly rely on browser-accessible tools since they require no local installation and update instantly for every user.
Mobile-Responsive Websites are emerging as a fast-growing segment in 2025, holding close to a 19.0% share. Global web traffic data from mid-2025 showed mobile devices accounted for about 60.5% of all traffic compared to 39.5% for desktop, a gap wide enough that ignoring responsive design now carries a direct business cost.
Separate tracking placed mobile’s contribution even higher at roughly 64% of website visits during the same year, with Africa recording the highest regional share at 69.13%. These figures explain why so many businesses rebuilt existing sites through 2025 so pages would automatically adjust across screen sizes rather than forcing users to zoom or scroll awkwardly.
Technology
JavaScript Frameworks such as React, Angular, and Vue held a dominant market position, capturing more than a 41.3% share. W3Techs tracking from 2025 showed React alone posting the largest usage increase of any JavaScript library that year, reflecting how firmly these frameworks have embedded themselves in new project builds. Despite newer entrants, jQuery still technically holds usage on about 67.3% of tracked websites.
Through 2025, GitHub’s Octoverse report noted TypeScript, which underpins much of the modern React and Angular ecosystem, grew 66% year over year to become the platform’s most-used language by contributor count, reaching 2.636 million monthly contributors by August 2025.
AI-Assisted Web Development Tools are emerging as a fast-growing segment in 2025. Stack Overflow’s 2025 survey found 84% of developers were using or planning to use AI tools in their workflow, up from 76% the year before, with 51% of professional developers now using them daily. GitHub’s Octoverse data added further weight to this trend, reporting more than 1.1 million public repositories now use a large language model SDK, with 693,867 of those created in just the past twelve months, a 178% year-over-year jump.
Even so, trust in these tools remains mixed, since 46% of developers reported actively distrusting AI-generated output compared to just 33% who trust it, and only 3% said they highly trust it. Through 2025 and into early 2026, agencies handling multiple client projects increasingly used these tools for repetitive tasks like formatting and boilerplate generation rather than full production code. Debugging AI-generated output remained a common frustration, cited by 45% of developers surveyed.
Deployment Mode
Cloud-Based Development Platforms held a dominant market position, capturing more than a 66.80% share. Global public cloud spending climbed to 723.4 billion dollars in 2025, up sharply from 595.7 billion dollars in 2024, a 21.5% jump that reflects how quickly workloads have shifted away from physical servers. Separate research placed the broader cloud computing market at roughly 912.77 billion dollars for 2025, continuing to expand at a double-digit annual rate.
Enterprise surveys found that 94% of businesses report using cloud services in some form, while only 5% of companies intend to move workloads back on-premises, showing how settled this shift has become. Through 2025, cloud adopters reported concrete operational gains, including a 37% improvement in time to market and a 38% increase in application development productivity compared to non-adopters.
Hybrid Deployment is emerging as a fast-growing segment in 2025. Market sizing from early 2026 placed the global hybrid cloud market between roughly 127 billion and 173 billion dollars for 2025, depending on methodology, with most estimates pointing to an 18% compound annual growth rate into 2026. One breakdown found large enterprises accounted for about 61.62% of 2025 hybrid cloud spending, while small and medium businesses grew their share at a faster 12.54% annual clip, showing broadening adoption beyond just the biggest players.
Banking, financial services, and insurance led end-user demand with 35.92% of 2025 hybrid cloud revenue, a pattern tied directly to compliance rules that require sensitive data to stay on private infrastructure even as customer-facing systems run on public cloud. Through 2025 and into 2026, Asia-Pacific emerged as the fastest-growing region for hybrid adoption, expanding at roughly 13.76% annually.
Application
E-commerce Websites held a dominant market position, capturing more than a 34.90% share. Global retail e-commerce sales reached an estimated 6.42 trillion dollars in 2025, up 6.86% year over year. Projections for 2026 point to online sales climbing further to roughly 6.88 trillion dollars, a 7.2% increase that would push e-commerce to about 21.1% of all global retail commerce.
Longer-range forecasts suggest the market could grow further still, reaching close to 7.89 trillion dollars by 2028. Heading into 2026, smaller sellers who once relied solely on third-party marketplaces increasingly built their own branded stores, aiming to reduce dependence on platforms that take a cut of every sale.
SaaS Applications are emerging as a fast-growing segment in 2025. The global SaaS market reached an estimated 408.21 billion dollars in 2025, with enterprise spending growing about 18% year over year, notably faster than the 8% growth rate for overall IT budgets during the same period. Adoption has become close to universal, with 99% of organizations now reporting they use at least one SaaS application, and roughly 75% of all business software now delivered this way rather than installed on-premises.
Through 2025, the average enterprise ran about 106 SaaS applications, though mid-sized firms with 1,500 to 4,999 employees actually trimmed their app count by 29% as companies worked to consolidate overlapping tools. Heading into 2026, North America still generated close to 46.9% of global SaaS revenue, while projections put the market at roughly 465 billion dollars for 2026.
End User
IT & Software Companies held a dominant market position, capturing more than a 44.70% share. The global IT services outsourcing market, much of which flows through software and IT companies building for other businesses, was estimated at around 422.76 billion to 661.9 billion dollars in 2025 depending on methodology, with growth forecasts ranging from 8.2% to 9.1% annually through the early 2030s. Software development ranked among the top three outsourced categories, together with infrastructure and administration services accounting for over 60% of global outsourcing demand.
Nearly 60% of organizations across industries outsource application development specifically, citing the high cost and scarcity of specialized in-house developer talent, with financial services leading adoption at 72%. Through 2025, 92% of Global 2000 companies relied on external IT service providers for at least part of their technology work
BFSI is emerging as a fast-growing segment in 2025. The global digital banking market was projected to more than double from 10.9 trillion dollars in 2023 to roughly 22.3 trillion dollars by 2026, an increase of over 11.4 trillion dollars in just three years. Around 76% of global consumers now use some form of digital banking for everyday transactions, while 72% specifically prefer mobile apps over branch visits as their primary banking channel.
Within hybrid cloud spending specifically, BFSI led all end-user industries with 35.92% of 2025 revenue, reflecting how much financial institutions have shifted core infrastructure toward flexible, partly cloud-based systems while keeping regulated data secured separately. Through 2025, digital banking platform providers alone generated an estimated 37.5 billion dollars in market value, with projections pointing to 44 billion dollars in 2026. Heading into 2026, banks investing in digital transformation reported operating cost reductions of 20 to 40% through automation and reduced branch dependence.
Development Approach
Traditional Coding held a dominant market position, capturing more than a 49.60% share. Even with AI tools spreading quickly, Stack Overflow’s 2025 survey found 46% of developers actively distrust AI-generated code compared to just 33% who trust it, with experienced developers showing the highest distrust rate at 20%. This caution keeps hand-written, traditionally coded systems as the preferred approach for complex platforms such as large e-commerce sites and banking portals, industries where custom functionality and deep system integration matter more than build speed alone.
Debugging AI-generated code was cited as more time-consuming by 45% of developers surveyed, reinforcing why many teams still default to writing critical code sections manually. This combination of trust concerns and integration complexity keeps traditional coding as the largest single development approach even as automated alternatives expand quickly around it.
Low-Code/No-Code Development is emerging as a fast-growing segment in 2025. Market estimates place this category at around 45.5 billion dollars in 2025, with projections pointing to roughly a fourfold increase to 187 billion dollars by 2030. Separate research suggested about 70% of new businesses were expected to adopt some form of low-code or no-code solution during 2025, reflecting how quickly smaller organizations have turned to these platforms to avoid hiring dedicated developers for simple projects.
Device Compatibility
Desktop-First Websites held a dominant market position, capturing more than a 42.20% share. StatCounter’s global tracking from mid-2026 showed desktop still holding 47.17% of worldwide device traffic against mobile’s 51.47%, a gap close enough that desktop remains a serious priority for many business categories rather than a shrinking afterthought. This holds especially true in professional and enterprise contexts, where detailed dashboards, reporting systems, and design software depend on larger screens and precise mouse-and-keyboard input that phones simply cannot replicate well.
Through 2025, industries handling data-heavy work, including engineering and accounting, kept building primarily for desktop first before adapting layouts down to smaller devices. North America’s continued dominance in enterprise software spending, where it held around 46.9% of global SaaS revenue in 2025, correlates closely with regions where desktop-first B2B tools remain standard in corporate environments.
Mobile-First Websites are emerging as a fast-growing segment in 2025, holding close to a 31.00% share. Global web traffic data from mid-2025 put mobile devices at about 60.5% of all traffic against desktops’ 39.5%, while a separate tracking source measured mobile’s share even higher at roughly 64.35% that same year. Active mobile internet users worldwide reached an estimated 4.32 billion by 2025, with 96.3% of all internet users accessing the web through a phone at some point.
Key Market Segments
Development Type
- Front-End Development
- Full-Stack Development
- Back-End Development
- Progressive Web Apps (PWA) Development
- API & Microservices Development
Platform Type
- Web Applications
- Mobile-Responsive Websites
- E-commerce Websites
- Enterprise Web Portals
Technology
- JavaScript Frameworks (React, Angular, Vue)
- AI-Assisted Web Development Tools
- CMS Platforms (WordPress, Drupal)
- Server-Side Technologies (Node.js, Python, PHP)
Deployment Mode
- Cloud-Based Development Platforms
- On-Premises Development
- Hybrid Deployment
Application
- E-commerce Websites
- Corporate Websites & Portals
- SaaS Applications
- Social Networking Platforms
- Content & Media Platforms
End User
- IT & Software Companies
- BFSI
- Retail & E-commerce
- Healthcare
- Government & Public Sector
- Media & Entertainment
Development Approach
- Traditional Coding
- Low-Code/No-Code Development
- AI-Assisted Development
Device Compatibility
- Desktop-First Websites
- Mobile-First Websites
- Cross-Platform Web Apps
Geopolitical Impact Analysis
Trade fragmentation is directly raising input costs for the hardware and hosting infrastructure underpinning web development: the WTO’s 2025 review flagged that frontloaded imports of AI-related goods, including semiconductors and servers, drove a sharp upward revision of merchandise trade growth to 2.4% in 2025 as firms rushed shipments ahead of tariff increases, signaling acute pricing distortion in the server and chip supply chain that web hosting and cloud-development platforms depend on.
Concurrently, UNCTAD’s Review of Maritime Transport 2025 confirms that container, bulk, and tanker freight rates remained “elevated and volatile” through 2024-2025, with global container fleet capacity only expanding 6.7% in 2025 against surging demand, meaning developers sourcing physical networking equipment, servers, and peripherals face persistent freight-cost unpredictability layered atop tariff exposure.
Energy volatility compounds these pressures on the compute-intensive backend of web development: the IEA’s Electricity 2025 Mid-Year Update reports that data-center-driven demand growth pushed US electricity consumption up 2.1% in 2024, with global electricity demand climbing 3.3% in 2025 and accelerating to 3.7% in 2026, directly inflating the operating costs of cloud infrastructure, hosting providers, and CDN networks that web development firms rely on for deployment.
The IEA further projects data-center electricity consumption more than doubling to roughly 945 TWh by 2030, a trajectory that raises long-term hosting and server-side rendering costs for web applications, particularly those built on AI-integrated stacks. Separately, semiconductor tariff whiplash exemplified by TSMC’s $100 billion additional US manufacturing pledge announced in March 2025 reflects reactive reshoring aimed at insulating chip supply from tariff exposure.
Regional Analysis
North America dominates the global web development market, commanding a 40.8% share valued at USD 24.95 billion, underpinned by a mature technology ecosystem and aggressive cloud-first enterprise strategies. The North America cloud computing market alone stood at roughly USD 406.08 billion in 2025 and is projected to reach USD 1,092.70 billion by 2032, reflecting a CAGR of 15.20%, directly fueling demand for cloud-native web architectures and progressive web applications.
Nearly 96% of organizations globally now leverage public cloud services, with 72% running hybrid or multi-cloud environments, and North American enterprises are at the forefront of this shift, driving continuous investment in headless CMS platforms, DevOps integration, and API-driven web infrastructure.
Sustained SaaS spending, which is approaching USD 300 billion in 2025, and a projected 22% rise in platform services this year, further reinforce North America’s role as the primary demand center for advanced web development, e-commerce engineering, and UI/UX modernization.
Asia Pacific stands out as the fastest-growing region in the global web development market, propelled by explosive digital commerce expansion and a rapidly scaling developer base. The Asia Pacific e-commerce market alone was valued at approximately USD 4.76 trillion in 2025 and is projected to surge to USD 12.46 trillion by 2034, creating enormous downstream demand for responsive, mobile-first web platforms.
Mobile commerce is accelerating this shift further, with global mobile transactions expected to account for over 75% of total e-commerce sales, a trend especially pronounced across Asia Pacific’s smartphone-first markets. India alone contributes roughly 17.58% of the global software outsourcing market, supported by a developer population of approximately 5.8 million, the second-largest in the world and on track to overtake the United States within the decade.
Key Regions and Countries
North America
- US
- Canada
Europe
- Germany
- France
- The UK
- Spain
- Italy
- Rest of Europe
Asia Pacific
- China
- Japan
- South Korea
- India
- Australia
- Rest of APAC
Latin America
- Brazil
- Mexico
- Rest of Latin America
Middle East & Africa
- GCC
- South Africa
- Rest of MEA
Market Dynamics
Drivers
| Driver | (~) % Impact on CAGR Forecast | Geographic Relevance | Impact Timeline |
|---|---|---|---|
| Enterprise digital transformation programs | +3.0% | North America, Europe, Asia-Pacific | Short term (≤ 2 years) |
| Cloud-native & SaaS-first architectures | +2.2% | Global | Medium term (2–4 years) |
| E-commerce & D2C webfront expansion | +1.8% | Global, with APAC & LATAM acceleration | Short term (≤ 2 years) |
| Government & public sector digitization | +1.2% | Europe, Asia-Pacific, Middle East | Medium term (2–4 years) |
| Low-code / no-code web tooling | +0.9% | Global SMEs | Medium term (2–4 years) |
| AI-assisted development workflows | +0.7% | Global Tier-1 & Tier-2 agencies | Long term (≥ 4 years) |
Enterprise digital transformation programs
Between 2024 and the baseline year 2026, enterprise digital transformation initiatives have accelerated, with multiple surveys indicating that over 70% of large organizations increased spending on digital projects that are heavily web-application centric, including customer portals, partner platforms, and internal workflow systems.
This surge shifts budgets from legacy software and on-premise portals into modern web stacks, with CIOs reallocating an estimated 10–20% of their application portfolio spend each year toward cloud-hosted web front ends, APIs, and integration layers that need custom development and continuous enhancement.
For web development providers, this translates into multi-year contracts instead of one-off projects, rising average deal sizes, and higher recurring revenue as organizations move from static websites to product-like web platforms, compressing payback periods for development investments to roughly 18–30 months and supporting a structural uplift of around +3.0% to the sector’s CAGR through the baseline window.
Restraints
| Restraint | (~) % Impact on CAGR Forecast | Geographic Relevance | Impact Timeline |
|---|---|---|---|
| Tight IT budgets amid high rates | -2.4% | North America, Europe | Short term (≤ 2 years) |
| Data protection & privacy compliance costs | -1.6% | EU, UK, selected U.S. states | Medium term (2–4 years) |
| Cybersecurity exposure for web apps | -1.3% | Global | Short term (≤ 2 years) |
| Legacy infrastructure lock-in | -1.1% | Global incumbents | Long term (≥ 4 years) |
| Skill-cost inflation in mature hubs | -0.9% | North America, Western Europe | Medium term (2–4 years) |
| Client-side procurement delays | -0.7% | Public sector, large enterprises | Short term (≤ 2 years) |
Tight IT budgets amid high rates
Elevated policy rates in major economies through 2024–2025 have raised the weighted average cost of capital for enterprises by roughly 150–300 basis points, forcing CIOs to prioritize maintenance and mandatory compliance work over discretionary web projects.
Higher financing costs and cautious boards are trimming digital project approval pipelines, with some enterprises cutting planned application modernization and new web product launches by an estimated 10–15% versus pre-tightening roadmaps, thereby deferring a portion of web development demand into later years.
For agencies and web development firms, this manifests as elongated sales cycles by 2–4 quarters, lower upfront retainers, and greater pressure to move to outcome-based or revenue-share contracts, collectively shaving an estimated -2.4% from otherwise achievable CAGR as projects are down-scoped, postponed, or bundled into broader IT deals with tighter margins.
Challenges
| Challenge | (~) % CAGR Friction Drag | Geographic Relevance | Mitigation Horizon |
|---|---|---|---|
| Fragmented technology stacks | -2.1% | Global | Medium term (2–4 years) |
| Senior full-stack talent shortage | -1.9% | North America, Europe, APAC metros | Long term (≥ 4 years) |
| Performance & latency expectations | -1.5% | Global high-traffic platforms | Medium term (2–4 years) |
| Vendor lock and re-platform risk | -1.2% | Global enterprises | Long term (≥ 4 years) |
| Complex integration with legacy systems | -1.0% | Large incumbents | Medium term (2–4 years) |
| Quality assurance and testing burden | -0.8% | Global | Short term (≤ 2 years) |
Fragmented technology stacks
The web development ecosystem has proliferated into dozens of major front-end frameworks, headless CMSs, API gateways, and deployment targets, creating stack combinations that can easily span more than 10 discrete tools per production application and driving architectural inconsistency across portfolios.
This fragmentation adds friction in the form of duplicated engineering effort, non-standardized deployment pipelines, and higher integration overheads, with many mid-sized teams spending an estimated additional 15–25% of development time on glue code, compatibility fixes, and stack-specific optimizations that do not directly create new business functionality.
Over the medium term, agencies and in-house teams must respond by consolidating on a smaller set of opinionated stacks, investing in internal platforms and reusable templates, and tightening design system governance, yet the transition period weighs on effective output per full-time equivalent and imposes a structural drag of around -2.1% on maximum attainable growth as organizations trade pure delivery velocity for stack rationalization and maintainability.
Opportunities
| Opportunity | (~) % Potential CAGR Upside | Geographic Relevance | Execution Window |
|---|---|---|---|
| Verticalized SaaS-style web platforms | +2.6% | Global, with SME focus | Medium term (2–4 years) |
| AI-native web experience layers | +2.1% | North America, Europe, APAC | Long term (≥ 4 years) |
| Emerging market SME digitization | +1.9% | Asia-Pacific, Africa, LATAM | Long term (≥ 4 years) |
| Composable commerce and headless adoption | +1.7% | Global retail and B2B | Medium term (2–4 years) |
| Usage-based maintenance & optimization services | +1.3% | Global | Short term (≤ 2 years) |
| Regulated sector modernization (health, gov) | +1.0% | US, EU, Asia-Pacific | Long term (≥ 4 years) |
Verticalized SaaS-style web platforms
This opportunity is still largely untapped because many web development providers continue to operate on a pure project-services model, even though a meaningful share of their deliverables are repeatable patterns that could be productized into multi-tenant, browser-based platforms for specific verticals such as clinics, small retailers, or professional services firms.
By converting bespoke builds into configurable SaaS-style web products with standardized feature bundles and tiered pricing, agencies can shift a portion of revenue into recurring subscriptions, expanding gross margins from typical project levels in the mid-teens to potentially 30–40% on mature vertical platforms while reducing marginal delivery cost per customer by an estimated 40–60% due to shared infrastructure and code reuse.
Executed over a 2–4 year horizon, this transition can support an incremental CAGR uplift of around +2.6% above the baseline by unlocking a sizable base of smaller clients that currently under-invest in custom web development but would adopt affordable, pre-packaged web solutions tailored to their sector-specific workflows and compliance requirements.
Key Players Analysis
The global web development market is structured around a Tier-1 cohort of large-cap platform incumbents and a Tier-2 group of specialized SaaS challengers, with hierarchy determined by segment revenue scale, R&D depth, and recurring-revenue durability. Adobe leads via its Digital Media segment (Creative Cloud/Experience Cloud), which posted $4.62 billion in Q4 FY25 revenue (+11% YoY) and closed fiscal 2025 at $17.65 billion, up 11% YoY, with Digital Media ARR exiting FY25 at roughly $18.6-19 billion.
Wix.com sits as the leading pure-play website-builder challenger, reporting $2.0 billion in FY2025 total revenue (+13.2% YoY) at a 68.1% gross margin, while R&D spend expanded to $645.5 million, roughly 32% of revenue, reflecting heavy reinvestment into its Base44 AI “vibe coding” platform, which surpassed 2 million users within months of launch. Automattic (WordPress.com, WooCommerce, Jetpack), though private, is estimated near $700-710 million in 2024 revenue and remains dominant on unit share, with WordPress underpinning over 43% of all websites and 61.8% CMS market share as of February 2025.
Squarespace, before its going-private transition, demonstrated the tier’s M&A intensity: full-year 2024 annual run-rate revenue reached $1.1177 billion (+19% YoY), and the company was acquired by Permira in an all-cash deal valued at $6.9 billion, alongside a separate $400 million divestiture of its Tock hospitality unit to American Express, illustrating active portfolio rationalization around core web-publishing revenue.
Wix’s bookings momentum ($535 million in Q4 2025, +15% YoY) and $575 million in share repurchases signal capital-return discipline atop growth investment. Collectively, Adobe’s scale advantage (17.65B Digital Media revenue) positions it as the clear Tier-1 leader, while Wix, Squarespace, and Automattic compete for Tier-2 share through AI-native product differentiation, subscription ARR expansion, and targeted acquisitions rather than organic scale alone.
Top Key Players in the Market
- Microsoft
- Amazon Web Services
- Meta
- IBM
- Oracle
- Adobe
- Shopify
- Salesforce
- WordPress (Automattic)
- Wix
- Squarespace
- GitHub
- Atlassian
- Cloudflare
Recent Developments
- In June 2025, Wix acquired AI no-code startup Base44 for an initial consideration of approximately USD 80 million, with additional earn-out payments through 2029 tied to performance metrics. The acquisition strengthens Wix’s AI-driven website creation capabilities by enabling users to build software and web applications using natural language.
- In September 2025, Atlassian entered a definitive agreement to acquire The Browser Company for USD 610 million in an all-cash deal to strengthen its AI-powered browser capabilities. The transaction supports Atlassian’s strategy to integrate AI-native browsing into enterprise collaboration and web-based productivity tools.
- In January 2026, Cloudflare completed the acquisition of Astro Technology to enhance modern web development framework capabilities for high-performance web applications, while its stock rose 9.17% following the announcement. The move expands Cloudflare’s developer ecosystem by improving tools for building faster, more reliable, and scalable websites.
- In May 2026, Atlassian confirmed the completion of its USD 610 million acquisition of The Browser Company to accelerate the development of an AI-native browser for enterprise knowledge work. The combined platform is expected to improve AI-assisted workflows, browser-based collaboration, and modern web application development.
Report Scope
| Report Features | Description |
|---|---|
| Market Value (2025) | USD 61.2 Billion |
| Forecast Revenue (2035) | USD 150.5 Billion |
| CAGR (2026-2035) | 9.4% |
| Base Year for Estimation | 2025 |
| Historic Period | 2020-2024 |
| Forecast Period | 2026-2035 |
| Report Coverage | Revenue Forecast, Market Dynamics, Competitive Landscape, Recent Developments |
| Segments Covered | By Development Type (Front-End Development, Full-Stack Development, Back-End Development, Progressive Web Apps (PWA) Development, API & Microservices Development), By Platform Type (Web Applications, Mobile-Responsive Websites, E-commerce Websites, Enterprise Web Portals), By Technology (JavaScript Frameworks, AI-Assisted Web Development Tools, CMS Platforms, Server-Side Technologies), By Deployment Mode (Cloud-Based Development Platforms, On-Premises Development, Hybrid Deployment), By Application (E-commerce Websites, Corporate Websites & Portals, SaaS Applications, Social Networking Platforms, Content & Media Platforms), By End User (IT & Software Companies, BFSI, Retail & E-commerce, Healthcare, Government & Public Sector, Media & Entertainment), By Development Approach (Traditional Coding, Low-Code/No-Code Development, AI-Assisted Development), By Device Compatibility (Desktop-First Websites, Mobile-First Websites, Cross-Platform Web Apps) |
| Regional Analysis | North America – US, Canada; Europe – Germany, France, The UK, Spain, Italy, Rest of Europe; Asia Pacific – China, Japan, South Korea, India, Australia, Singapore, Rest of APAC; Latin America – Brazil, Mexico, Rest of Latin America; Middle East & Africa – GCC, South Africa, Rest of MEA |
| Competitive Landscape | Microsoft, Google, Amazon Web Services, Meta, IBM, Oracle, Adobe, Shopify, Salesforce, WordPress (Automattic), Wix, Squarespace, GitHub, Atlassian, Cloudflare |
| Customization Scope | Customization for segments, region/country-level will be provided. Moreover, additional customization can be done based on the requirements. |
| Purchase Options | We have three licenses to opt for: Single User License, Multi-User License (Up to 5 Users), Corporate Use License (Unlimited Users and Printable PDF) |





























