
Global Visual Cloud Market Insights: Size, Share and Growth By Offering (Solution: Video Processing, Enterprise Video, AR/VR Solutions, Video Analytics, Cloud Gaming, Others; Services: Professional Services, Managed Services),By Service Mode (IaaS, PaaS, SaaS),By Deployment (Public Cloud, Private Cloud, Hybrid Cloud),By Organization Size (SMEs, Large enterprises),By End Use (BFSI, Media & Entertainment, IT & Telecom, Healthcare, Retail & E-commerce, Government & Public Sector, Education, Others), By Regional Analysis, Global Trends and Opportunity, Future Outlook By 2025-2034.
- Published date: Dec. 2025
- Report ID: 166720
- Number of Pages: 243
- Format:
-
keyboard_arrow_up
Quick Navigation
- Report Overview
- Key Takeaways
- Adoption Rates and Penetration
- Usage Statistics and Technology Trends
- Economic Impact
- U.S Market Size
- By Offering
- By Service Mode
- By Deployment
- Organization Size
- By End Use
- Key Market Segments
- Emerging Trends
- Growth Factors
- Driver
- Restraint
- Opportunity
- Challenge
- Key Players Analysis
- Recent Developments
- Report Scope
Report Overview
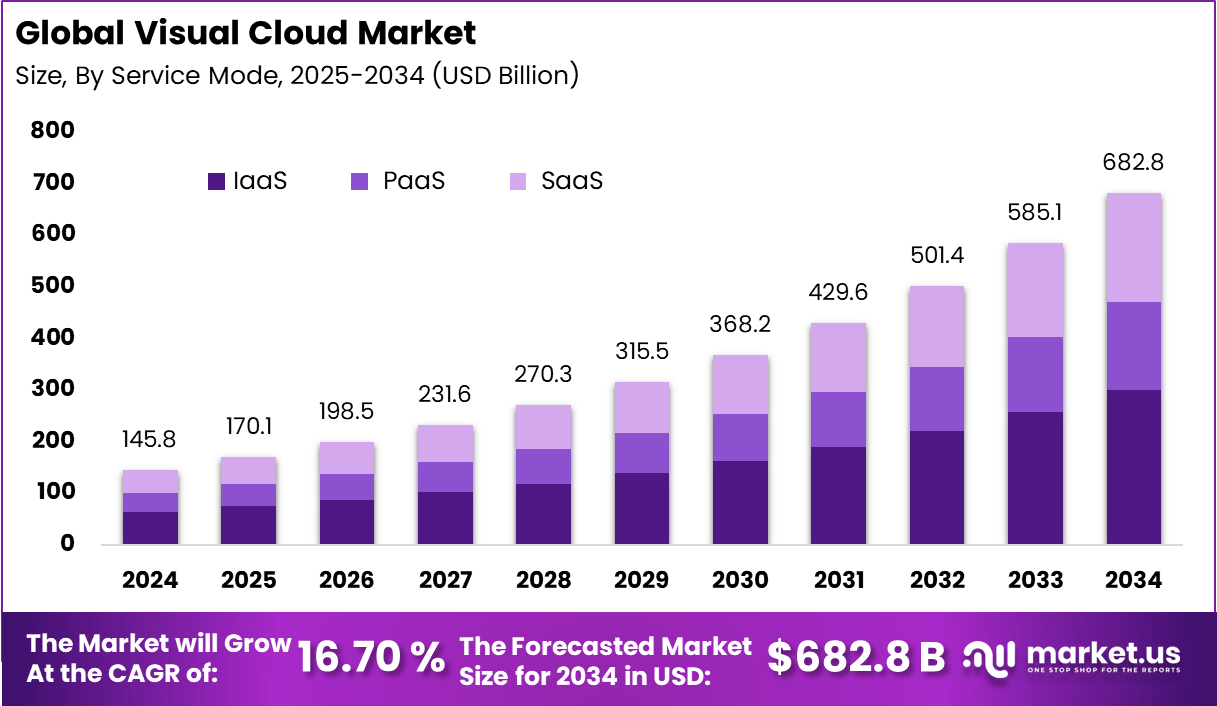
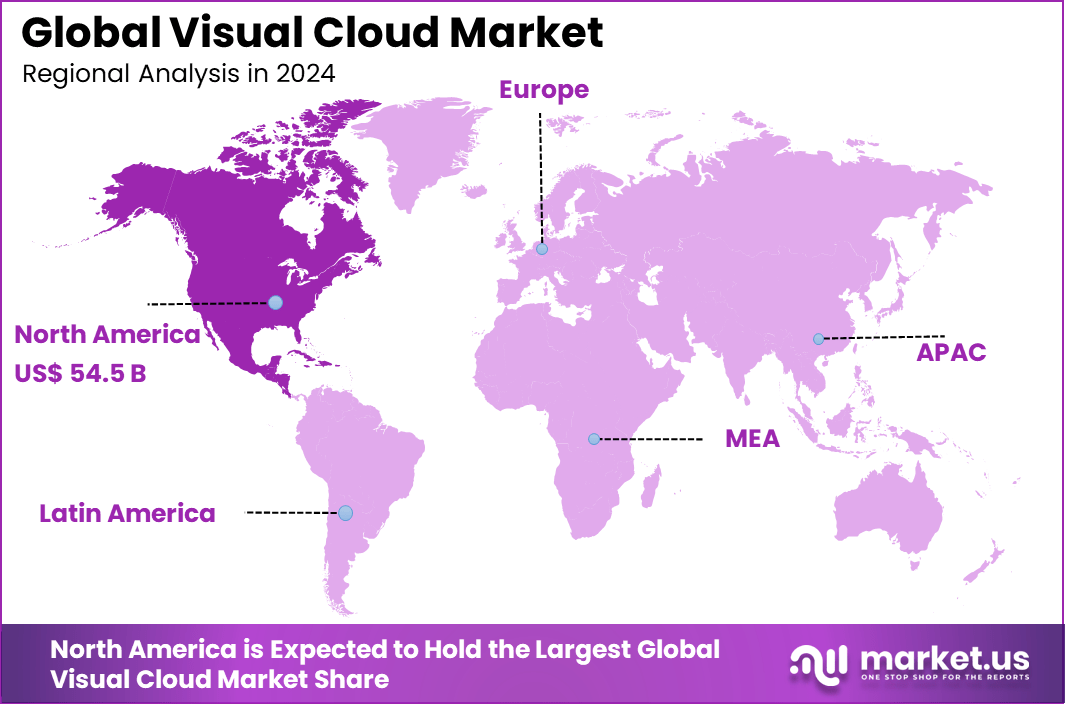
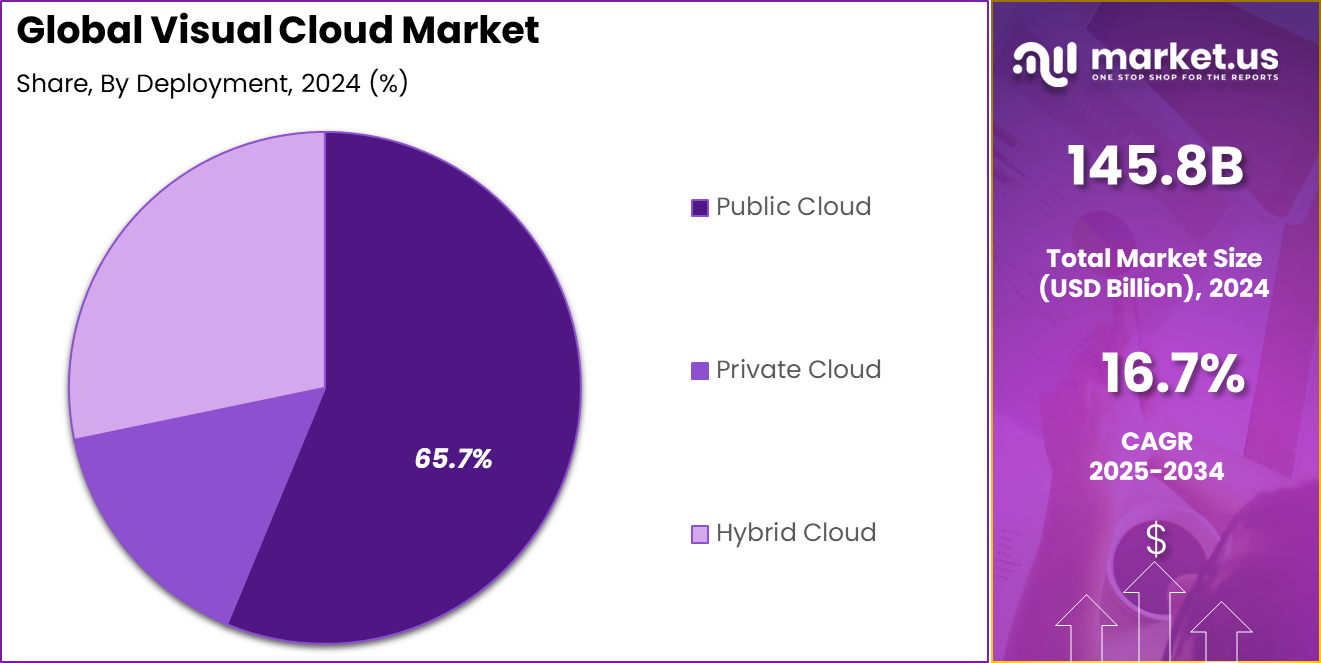
The Global Visual Cloud Market generated USD 145.8 Billion in 2024 and is predicted to register growth to about USD 682.8 Billion by 2034, recording a CAGR of 16.70% throughout the forecast span. In 2024, North America held a dominant market position, capturing more than a 37.4% share, holding USD 54.5 Billion revenue.
The visual cloud market refers to cloud based platforms that store, process, analyze, and deliver visual data such as images, videos, and immersive media. These platforms support real time and on demand access to visual content across devices and locations. Visual cloud systems are widely used in media delivery, remote monitoring, smart infrastructure, and digital collaboration environments.
The market has expanded as visual data volumes have increased across enterprises and public services. High resolution video, live streaming, and interactive visuals require scalable cloud infrastructure to manage storage and processing efficiently. Visual cloud platforms enable centralized control while supporting distributed access for users and systems.
This market plays a crucial role in enabling rich visual experiences without heavy dependency on local hardware. Visual cloud offloads intensive rendering and processing tasks to cloud servers, allowing devices such as laptops, mobile phones, and thin clients to access high fidelity graphics and real time interactive applications.
In entertainment, this supports high resolution video streaming, cloud gaming, and virtual production. In enterprise contexts, visual cloud underpins virtual workstations, 3D design collaboration, simulation, and remote visualization. By centralizing heavy compute workloads, visual cloud enhances accessibility, flexibility, and collaboration across distributed users.
Growth in the visual cloud market is driven by increasing consumption of video and immersive content, expansion of cloud gaming, and adoption of virtual and augmented reality workflows. Rising demand for remote collaboration and digital production tools has amplified the need for cloud-based visualization and graphics processing.
Improvements in network performance, growth in edge computing, and wider availability of high bandwidth internet have made visual cloud more practical for real time applications. Increased use of 4K/8K video, AI enhanced graphics, and interactive content has further stimulated investment in cloud rendering and rendering-as-a-service offerings.
Key Takeaways
- The Solution category captures a major role in the Visual Cloud market, accounting for up to 76.2% of adoption.
- Infrastructure as a Service (IaaS) holds a clear lead with a 43.9% market share within Visual Cloud service models.
- Public cloud deployment dominates with 65.7% share in Visual Cloud usage.
- Large enterprises represent the lion’s share with 70.4% of the Visual Cloud market.
- The BFSI (Banking, Financial Services, and Insurance) sector accounts for 36.9% of Visual Cloud usage, making it a noteworthy end-user segment.
- North America holds a over 37% leadership position in the Visual Cloud market with the US as the dominant regional player.
- Over USD 46.33 Billion with an healthy CAGR of 13.2% values of North America’s visual cloud revenue originates from the U.S.
Adoption Rates and Penetration
- Cloud usage is nearly universal, with 94% of enterprises using cloud services in some form.
- By 2025, around 85% of enterprises have adopted a cloud-first strategy.
- More than 50% of enterprises now rely on industry-specific cloud platforms to support visual and digital workloads.
- Close to 50% of global data is expected to be stored in the cloud by the end of 2025, driven by video, image, and 3D content migration.
- Over 65% of the global population consumes OTT content, which depends fully on cloud-based visual delivery infrastructure.
Usage Statistics and Technology Trends
- Infrastructure-as-a-Service leads adoption with a 39.45% share, reflecting demand for direct GPU access and high-performance rendering.
- Media streaming represents 44.4% of total visual cloud usage, remaining the largest workload category.
- Cloud gaming continues strong expansion, growing at a 13.65% rate and reaching 293 million users in 2025.
- Generative AI adoption is accelerating, with 72% of organizations using public cloud AI services for visual creation and analytics.
- Around 75% of data is processed at the edge by late 2025, supporting low-latency AR, VR, and gaming use cases.
- Public cloud holds the largest share at roughly 50-53%, while hybrid cloud is growing fastest at 13.88% as firms balance performance and scale.
Economic Impact
- Global public cloud spending is projected to reach $723.4 billion in 2025, reflecting strong year-on-year growth.
- Despite high adoption, about 30-32% of cloud budgets are lost to idle capacity and over-provisioning.
- Market leadership remains concentrated, with the top providers accounting for the majority of enterprise cloud workloads worldwide.
U.S Market Size
The United States reached USD 46.33 Billion with a CAGR of 13.2%, reflecting consistent market growth. Expansion is driven by rising use of video analytics and cloud-based visualization. Enterprises continue to modernize visual data systems.
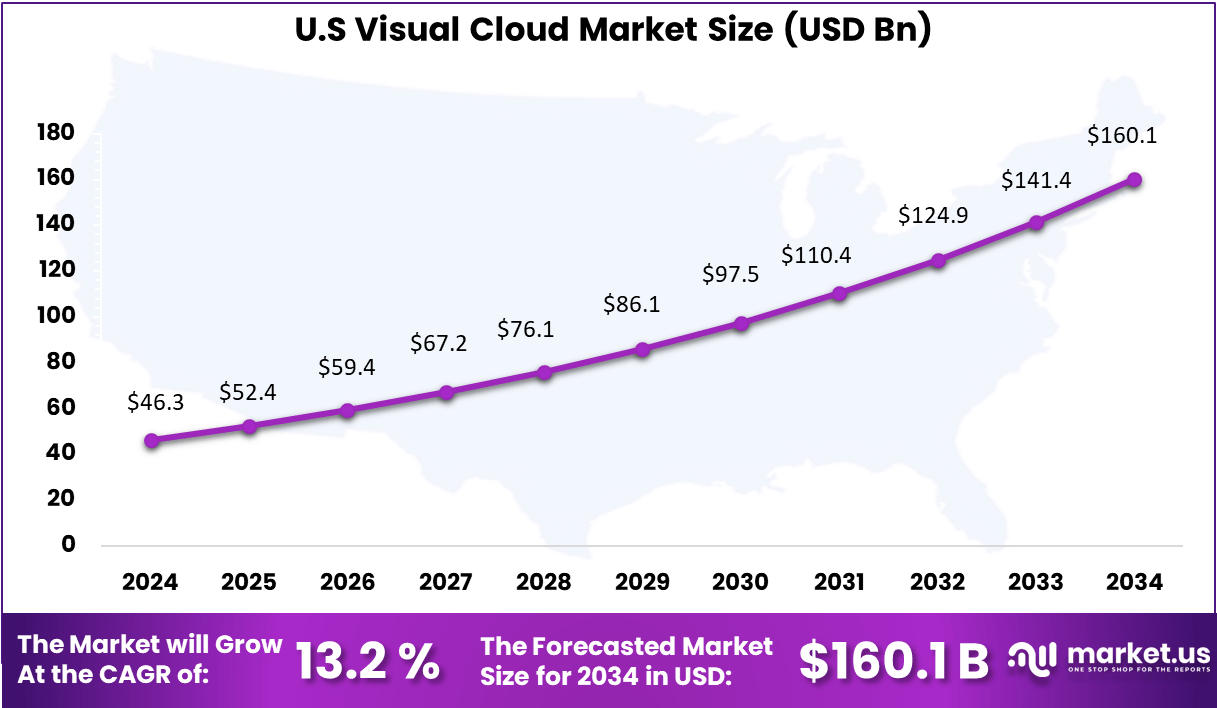
North America accounts for 37.4%, supported by advanced cloud infrastructure and high enterprise adoption. Organizations in the region invest heavily in visual data platforms to improve efficiency. Strong digital maturity supports steady demand.
By Offering
Solutions account for 76.2%, indicating that enterprises prefer complete visual cloud platforms rather than isolated tools. These solutions support video processing, image analytics, visualization, and real-time rendering within a unified environment. Organizations use solution platforms to manage visual workloads more efficiently across departments. Centralized solutions also help reduce system complexity and improve consistency.
The strong adoption of solution offerings is driven by the need for easier deployment and control. Enterprises benefit from simplified management and stable system performance. Integrated solutions also support scalability as visual data volumes continue to grow. This makes them suitable for long-term digital strategies.
By Service Mode
Infrastructure as a Service holds 43.9%, reflecting strong reliance on cloud infrastructure for visual workloads. IaaS provides the computing power, storage, and networking required for video and image-intensive applications. Organizations use IaaS to handle fluctuating workloads efficiently. This service model supports flexible resource allocation.
Growth in this segment is driven by cost efficiency and operational flexibility. Organizations avoid large upfront hardware investments by using cloud infrastructure. IaaS enables quick scaling during peak usage periods. It also supports faster deployment of visual cloud applications.
By Deployment
Public cloud deployment accounts for 65.7%, showing a clear preference for shared cloud environments. Public cloud platforms provide high availability and remote access for visual data processing. This deployment model supports geographically distributed operations. It also simplifies system access for multiple teams.
Adoption of public cloud is supported by lower implementation effort and faster rollout. Organizations benefit from reduced maintenance responsibilities. Public cloud environments support collaboration and data sharing across locations. These factors continue to drive strong adoption.
Organization Size
Large enterprises represent 70.4%, highlighting their dominant role in visual cloud adoption. These organizations manage large volumes of visual data across multiple business units. Advanced platforms are required to handle complex workflows. Visual cloud solutions support centralized management at scale.
Adoption among large enterprises is driven by higher IT budgets and digital transformation initiatives. Visual cloud platforms improve monitoring, analytics, and operational visibility. They also support enterprise-wide decision-making processes. Long-term efficiency goals continue to support demand.
By End Use
The BFSI sector holds 36.9%, making it the largest end-use segment. Financial institutions use visual cloud platforms for security monitoring, transaction analysis, and customer engagement. Visual data helps improve operational accuracy and oversight. Reliable systems are essential in this sector.
Demand in BFSI is driven by strict compliance and risk management requirements. Visual cloud tools enhance transparency and audit readiness. Secure handling of visual information remains a key priority. These factors support sustained adoption.
Key Market Segments
By Offering
- Solution
- Video Processing
- Enterprise Video
- AR/VR Solutions
- Video Analytics
- Cloud Gaming
- Others
- Services
- Professional Services
- Managed Services
By Service Mode
- IaaS
- PaaS
- SaaS
By Deployment
- Public Cloud
- Private Cloud
- Hybrid Cloud
By Organization Size
- SMEs
- Large enterprises
By End Use
- BFSI
- Media & Entertainment
- IT & Telecom
- Healthcare
- Retail & E-commerce
- Government & Public Sector
- Education
- Others
Emerging Trends
Shift Toward AI-Enhanced and Edge-Assisted Visual Processing
A major trend in the visual cloud market is the growing use of AI-based visual analytics. Organizations now process video streams using object detection, pattern recognition, face matching, and anomaly detection models. Visual cloud platforms support these workloads by offering optimized computing environments. This trend increases adoption in sectors such as retail, logistics, security, and smart cities.
Another emerging trend is the integration of visual cloud platforms with edge computing. Instead of sending all visual data to distant data centers, part of the processing takes place at the edge for faster response. This reduces bandwidth needs and improves real-time decision making. Edge-assisted visual cloud systems are increasingly used in autonomous systems, industrial monitoring, and remote operations.
Growth Factors
Increase in Video Data Generation and Remote Workflows
A major growth factor is the rapid increase in visual data generated by surveillance networks, smart devices, and online platforms. High-resolution video streams require strong processing and storage capacity. Visual cloud platforms allow organizations to scale these workloads without relying on local hardware. This scalability supports continuous growth in visual data applications.
Another growth factor is the rise of remote and collaborative workflows. Design teams, engineers, healthcare professionals, and media creators use cloud platforms to view, edit, and share visual content in real time. The ability to access heavy visual workloads from any location supports flexible operations across industries. This shift increases reliance on the visual cloud as a shared processing layer.
Driver
One primary driver for the visual cloud market is the demand for scalable and flexible cloud resources capable of handling compute intensive visual workloads. Visual cloud architectures provide on-demand access to processing power, storage, and bandwidth necessary for rendering, transcoding, and delivering rich visual content across platforms and geographies.
Another driver is the shift toward hybrid cloud and multicloud strategies, which allow organisations to balance performance, cost, and control when delivering visual services. By leveraging multiple cloud environments, enterprises can optimise workload placement for visual computing tasks while maintaining resilience and operational continuity.
Restraint
A notable restraint in this market is the technical complexity and cost associated with deploying and managing high performance visual cloud environments. Handling advanced visual workloads often requires specialised expertise in cloud infrastructure, video processing, and real time systems, which can be a barrier for organisations with limited resources.
Another restraint relates to data privacy and security concerns as visual data moves across distributed cloud and edge ecosystems. Ensuring secure transmission, storage, and access control for sensitive visual content adds operational challenges and can slow adoption where robust governance frameworks are not in place.
Opportunity
A significant opportunity exists in expanding visual cloud offerings tailored to specific industry verticals such as healthcare, education, retail, and industrial automation. Customised solutions that leverage cloud based visual analytics, real time rendering, and immersive interfaces can unlock new use cases and drive deeper adoption of visual cloud technologies.
Another opportunity lies in enhancing integration with emerging consumer and enterprise platforms, including collaborative tools, content creation suites, and mobile applications. Tighter integration helps enterprises deliver consistent visual experiences across devices and supports new business models around remote work, virtual events, and interactive media.
Challenge
One of the main challenges for the visual cloud market is maintaining low latency and high performance as visual workloads grow more demanding. Applications such as cloud gaming, immersive AR/VR experiences, and live broadcasting require near real time processing, which puts pressure on network infrastructure and resource orchestration across cloud and edge environments.
Another challenge involves managing interoperability and seamless integration across diverse cloud platforms and service models. As organisations adopt hybrid and multicloud architectures, coordinating visual processing workloads and ensuring consistent quality of service across providers demands advanced orchestration capabilities and governance practices.
Key Players Analysis
Microsoft, Google, IBM, Amazon Web Services, Alibaba Cloud, Oracle, Tencent Cloud, and Huawei Cloud lead the visual cloud market with scalable platforms that support video processing, real time collaboration, and cloud based visualization. Their solutions enable video streaming, virtual desktops, remote collaboration, and AI driven visual analytics. These companies focus on global cloud infrastructure, low latency delivery, and secure data handling.
VMware, Akamai Technologies, Cisco Systems, and RingCentral strengthen the market with edge delivery, network optimization, and enterprise grade video collaboration solutions. Their platforms help businesses deliver high quality visual experiences across distributed environments. These providers emphasize performance optimization, reliability, and seamless integration with enterprise IT systems.
Rackspace Technology and other players expand the market with managed visual cloud services and customized deployments. Their offerings help organizations migrate, manage, and optimize visual workloads on cloud infrastructure. These companies focus on flexibility, service support, and cost efficiency. Increasing reliance on cloud based visualization and real time digital interaction continues to drive steady growth in the visual cloud market.
Top Key Players in the Market
- Microsoft Corporation
- Google Inc.
- International Business Corporation Limited
- Amazon Cloud Services (AWS)
- Alibaba Cloud
- Oracle Corporation
- Tencent Cloud
- Huawei Cloud
- VMware
- Akamai Technologies
- Cisco Systems
- RingCentral
- Rackspace Technology
- Others
Recent Developments
- In January 2025, Amazon Public Cloud Services outlined plans to invest USD 8.3 billion in Mumbai by 2030 to expand its cloud infrastructure footprint in India. The initiative is intended to scale data center capacity, support nationwide digital transformation, and strengthen India’s role as a key global cloud computing hub while encouraging innovation and employment growth.
- In April 2024, Akamai introduced a media focused cloud service built on Nvidia RTX 4000 Ada Generation GPUs, delivering up to 25 times faster video frame processing compared to traditional CPU based systems. The platform supports leading codecs including H.264, H.265, VP9, and AV1, improving performance for video streaming, digital content production, and advanced visualization workloads.
- During the same month, AWS enhanced AWS Elemental MediaTailor by adding support for HLS Interstitials in video on demand streams. This enhancement optimizes ad insertion by separating ad segments from core content, reducing buffering and start up delays, and providing a smoother viewing experience compared to conventional ad insertion methods.
Report Scope
Report Features Description Market Value (2024) USD 145.8 Bn Forecast Revenue (2034) USD 682.8 Bn CAGR(2025-2034) 16.7% Base Year for Estimation 2024 Historic Period 2020-2023 Forecast Period 2025-2034 Report Coverage Revenue forecast, AI impact on Market trends, Share Insights, Company ranking, competitive landscape, Recent Developments, Market Dynamics and Emerging Trends Segments Covered By Offering (Solution: Video Processing, Enterprise Video, AR/VR Solutions, Video Analytics, Cloud Gaming, Others; Services: Professional Services, Managed Services),By Service Mode (IaaS, PaaS, SaaS),By Deployment (Public Cloud, Private Cloud, Hybrid Cloud),By Organization Size (SMEs, Large enterprises),By End Use (BFSI, Media & Entertainment, IT & Telecom, Healthcare, Retail & E-commerce, Government & Public Sector, Education, Others) Regional Analysis North America – US, Canada; Europe – Germany, France, The UK, Spain, Italy, Russia, Netherlands, Rest of Europe; Asia Pacific – China, Japan, South Korea, India, New Zealand, Singapore, Thailand, Vietnam, Rest of Latin America; Latin America – Brazil, Mexico, Rest of Latin America; Middle East & Africa – South Africa, Saudi Arabia, UAE, Rest of MEA Competitive Landscape Microsoft Corporation, Google Inc., International Business Corporation Limited, Amazon Cloud Services (AWS), Alibaba Cloud, Oracle Corporation, Tencent Cloud, Huawei Cloud, VMware, Akamai Technologies, Cisco Systems, RingCentral, Rackspace Technology, Others Customization Scope Customization for segments, region/country-level will be provided. Moreover, additional customization can be done based on the requirements. Purchase Options We have three license to opt for: Single User License, Multi-User License (Up to 5 Users), Corporate Use License (Unlimited User and Printable PDF) 
-
-
- Microsoft Corporation
- Google Inc.
- International Business Corporation Limited
- Amazon Cloud Services (AWS)
- Alibaba Cloud
- Oracle Corporation
- Tencent Cloud
- Huawei Cloud
- VMware
- Akamai Technologies
- Cisco Systems
- RingCentral
- Rackspace Technology
- Others
Our Clients
- 166720
- Dec. 2025


