


Report Overview
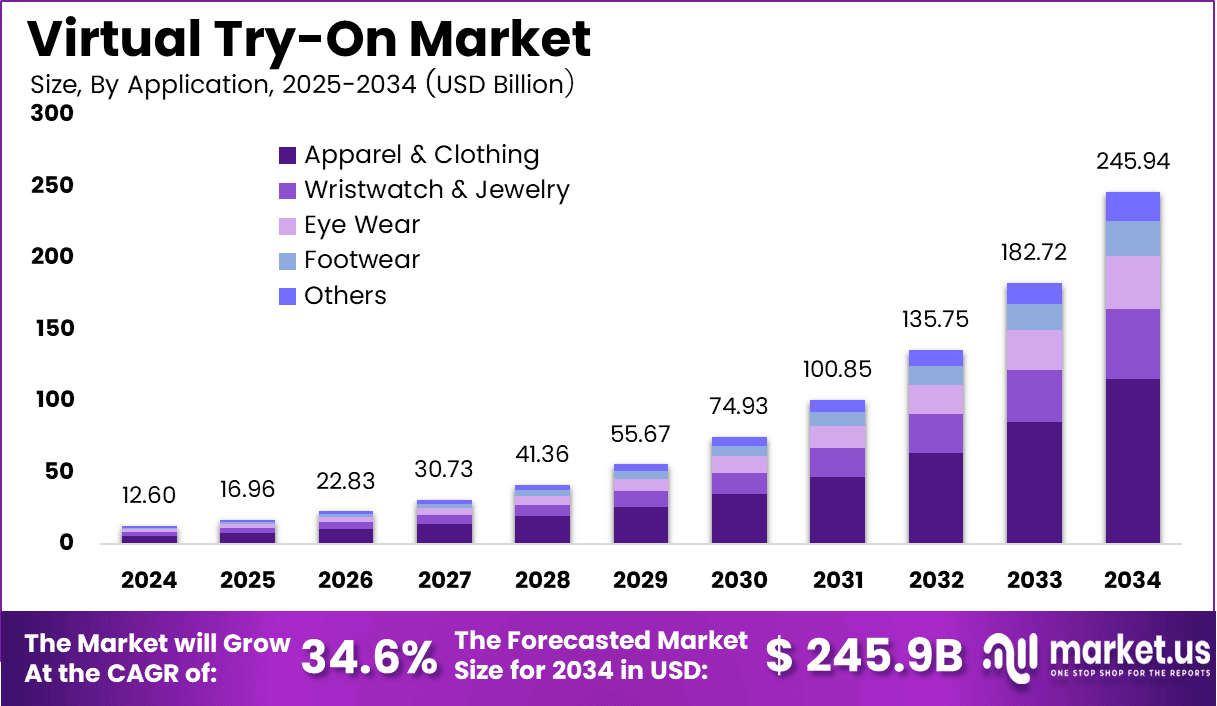
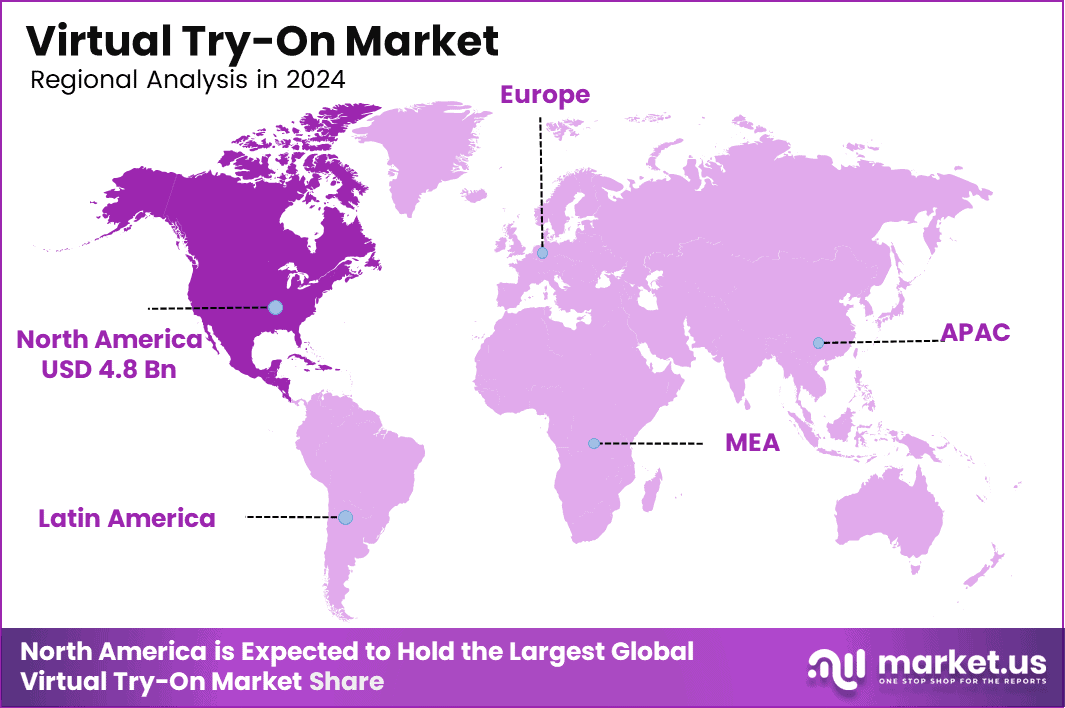
The Global Virtual Try-On Market reached USD 12.6 billion in 2024 and will climb to USD 245.9 billion by 2034. The market grows at a 34.6% CAGR across the 2025 to 2034 forecast period. North America holds a 38.5% share and generates USD 4.8 billion in revenue.
Online retail expansion is increasing demand for virtual fitting solutions. China’s National Bureau of Statistics reported online retail sales of 15.97 trillion yuan in 2025, up 8.6% year on year. Physical goods sales reached 13.09 trillion yuan and represented 26.1% of total retail sales.
A similar shift is visible in Europe and worldwide. Eurostat reported that 78% of EU internet users purchased goods or services online in 2025, compared with 62% in 2015. The ITU estimated that 6 billion people used the internet in 2025, representing around 74% of the global population.
As more consumers purchase products without physical trials, uncertainty around fit and appearance increases return risks for retailers. Apparel, footwear, eyewear, and jewelry brands are responding with camera-based fitting tools. The ITU estimated around 3 billion 5G subscriptions, equal to roughly one third of global mobile broadband connections, supporting smoother mobile virtual try-on experiences.
North America also provides a strong adoption base. The US Census Bureau reported retail e-commerce sales of $316.1 billion in the fourth quarter of 2025, while Federal Reserve data showed e-commerce represented 16.4% of total US retail sales in the third quarter of 2025. Strong digital payments and developed parcel networks.
Key Takeaways
- The Virtual Try-On Market stood at USD 12.6 billion in 2024 and will reach USD 245.9 billion by 2034. The market records a 34.6% CAGR from 2025 to 2034.
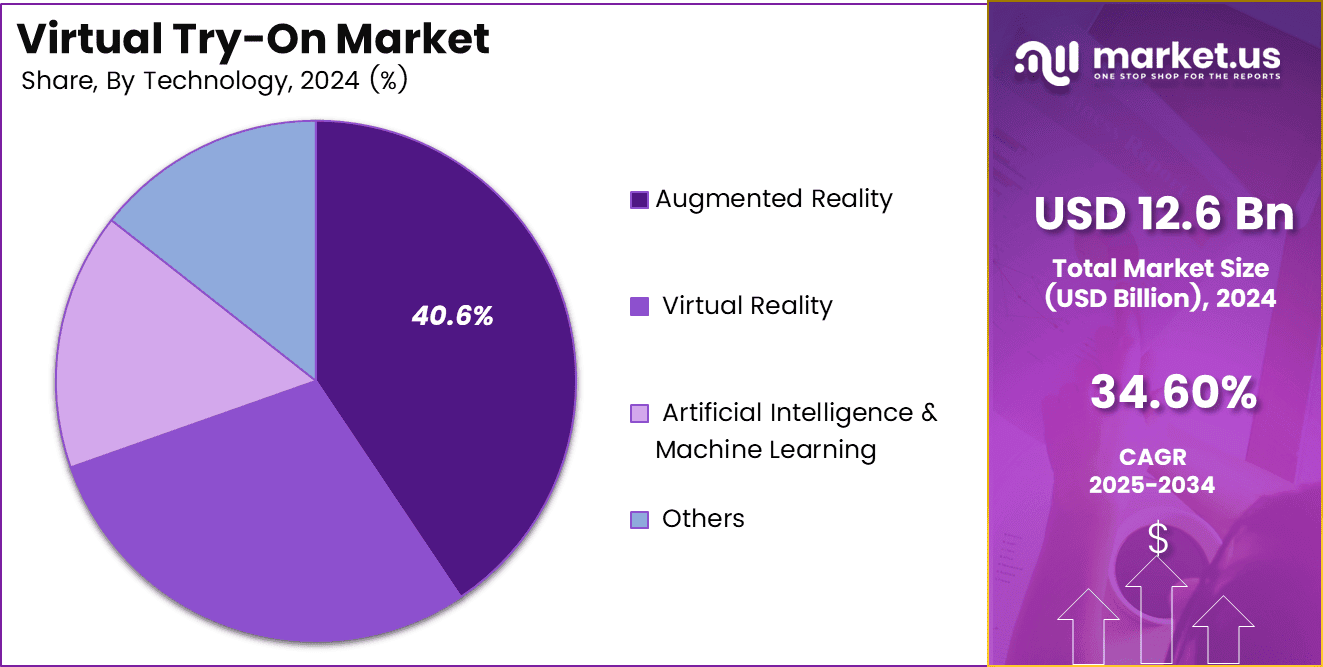
- Augmented reality leads the technology segment with a 40.6% share.
- Smartphones and tablets lead the device segment with a 65.6% share.
- Apparel and clothing lead the application segment with a 46.8% share.
- North America dominates with a 38.5% share and USD 4.8 billion in revenue.
Role of Generative AI
Generative AI is increasingly underpinning virtual try-on solutions by producing hyper-realistic imagery that adapts to diverse body types, clothing fabrics, lighting conditions, and poses. It enables retailers to scale content creation rapidly, replacing or augmenting traditional 3D-modelling and photo-shoot workflows. These capabilities enhance customer confidence in online purchases by delivering a more realistic try-before-you-buy experience, reducing sizing uncertainty and return rates.
Generative AI also supports real-time personalization by generating dynamic avatars and outfit simulations based on a shopper’s features and prior behaviour. Integration with AR and machine-learning systems allows continuous refinement of fit accuracy and visual fidelity across product categories.
By Technology
Augmented Reality dominates with 40.6% due to smartphone camera overlays needing no headset.
Augmented reality leads virtual try-on adoption because it works through smartphones that consumers already own and does not require dedicated headsets. Brands can integrate AR into mobile apps and social platforms, allowing shoppers to test products such as cosmetics, eyewear, and footwear within seconds.
Snap reported that users opened AR Lenses around 8 billion times per day during the fourth quarter of 2025, while more than 450,000 developers had created over 5 million Lenses. This large distribution base allows retailers to reach millions of users without significant additional hardware investment.
Eurostat reported that 20.0% of EU enterprises with 10 or more employees used at least one AI technology in 2025, increasing by 6.5 percentage points in one year, while adoption reached 55% among large enterprises. AI also reduces the cost of 3D model creation, strengthening its role alongside AR in virtual try-on platforms.
By Device
Smartphones and Tablets dominate with 65.6% due to front cameras enabling instant in-app fitting.
Smartphones and tablets hold the largest share because the camera, display, and processor are integrated into a single portable device. Shoppers can use the front camera to visualize products on their face or body and complete the purchase within the same application.
The ITU reported 9.2 billion mobile-cellular subscriptions in 2025, equal to 112 subscriptions per 100 people, while active mobile broadband reached 99 subscriptions per 100 inhabitants. Faster mobile networks also allow complex 3D assets to load more quickly, improving the virtual try-on experience and reducing purchase drop-offs.
Computers are gaining adoption as larger screens provide clearer visualization of detailed products such as watches, jewelry, and apparel. Eurostat reported that 93.1% of EU households had internet access at home in 2023, supporting longer browsing sessions on laptops and desktops.
By Application
Apparel and Clothing dominates with 46.8% due to size doubt driving costly garment returns.
Apparel and clothing lead virtual try-on adoption because fit, size, length, and drape strongly influence purchase decisions and product returns. Virtual fitting rooms help shoppers assess these factors before checkout, reducing avoidable returns. The category also benefits from large global trade volumes, with WTO data showing world clothing exports of USD 576 billion in 2022.
China contributed USD 164 billion, representing 31.6% of global clothing exports. Online adoption continues to support demand, with e-commerce accounting for 17.1% of total U.S. retail sales in the second quarter of 2026. Eyewear is emerging as one of the fastest-growing applications because facial mapping can accurately position frames on a shopper’s face and simplify online style comparison.
Demand is supported by rising vision-care needs, with childhood myopia increasing from 24% in 1990 to nearly 36% in 2023, according to the IAPB Vision Atlas. Around 740 million young people are projected to have myopia by 2050.
Key Market Segments
By Technology
- Augmented Reality
- Virtual Reality
- Artificial Intelligence and Machine Learning
- Others
By Device
- Smartphones and Tablets
- Computer
By Application
- Apparel and Clothing
- Wristwatch and Jewelry
- Eye Wear
- Footwear
- Others
Geopolitical Impact Analysis
Trade policy is increasingly affecting the cost of virtual try-on deployments. The WTO reported a simple average most favoured nation tariff of 3.4% for the United States in 2025, while the trade-weighted average stood at 2.1%. Additional sector-specific duties can further increase the landed cost of smartphones, tablets, cameras, and display components used in try-on systems.
Global trade conditions add further pressure. The WTO expects merchandise trade volume growth to slow from 4.6% in 2025 to 1.9% in 2026, before improving to 2.6% in 2027. In the first quarter of 2026, global goods trade volumes still increased 1.9% quarter-on-quarter and 3.2% year-on-year. Higher equipment costs can encourage retailers to delay upgrades of in-store AR mirrors, cameras, and kiosks.
Shipping disruptions create another cost and supply risk. UNCTAD reported that Suez Canal transits declined 42% from their peak, while weekly container ship transits fell 67% during the Red Sea disruption. Rerouting vessels around the Cape of Good Hope can add around 10 days to Asia-Europe journeys, extending total transit times to around 40 to 50 days and keeping sensors, camera modules, and AR hardware in transit for longer.
Export controls are also tightening access to critical technology inputs. China requires export licences for products containing 0.1% or more Chinese-origin rare earth materials from 1 December 2025 and applies case-by-case reviews to logic chips of 14 nanometres and below and memory chips with 256 layers and above. Controls cover 12 of the 17 rare earth elements, including europium used in displays and erbium used in fibre optics, increasing supply-chain risks for screens, chips, and connectivity components supporting virtual try-on systems.
Regional Analysis
North America dominates the Virtual Try-On Market, holding a 38.5% share and generating USD 4.8 billion in revenue. The region earns this lead through the speed of its online channel. The US Census Bureau reported that second quarter 2026 e-commerce sales rose 12.2% against the same quarter of 2025, while total retail sales grew only 6.7%. Online channels therefore take share every quarter, and each shift moves more apparel and eyewear decisions to a screen.
Europe follows as a mature adopter with strict data rules that shape product design. Eurostat found that 95% of people aged 16 to 74 used the internet in the year before its 2025 survey, and only 15% of internet users never bought online. That leaves a wide base of digital shoppers.
Asia Pacific ranks as the fastest-growing region in the Virtual Try-On Market. China supplies the scale, with online physical goods sales taking 26.1% of all retail sales in 2025. The ITU puts internet use across Asia Pacific at 77% of the population, so hundreds of millions of new shoppers still join each year. Live commerce in China and South Korea uses AR filters to sell cosmetics and eyewear during broadcasts.
US Market Size
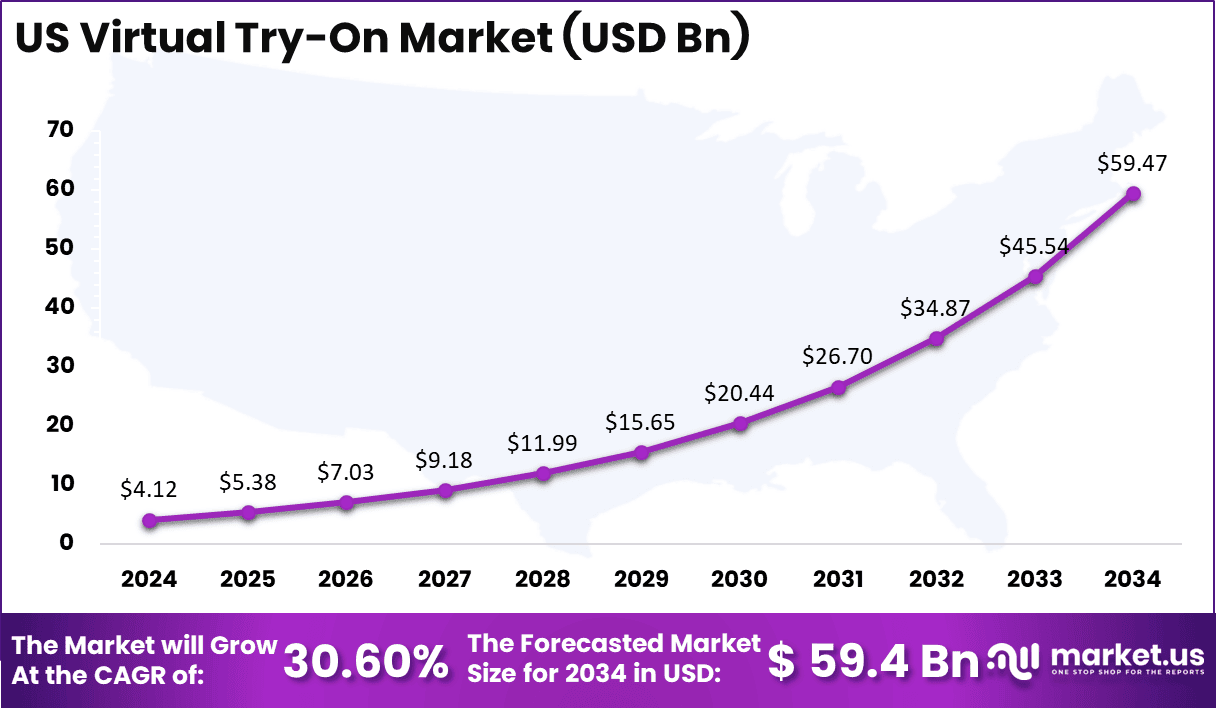
The US virtual try-on market, valued at USD 4.12 billion in 2024, is projected to reach USD 59.47 billion by 2034, expanding at a CAGR of 30.6%. This sharp rise reflects the country’s strong digital infrastructure, advanced adoption of AR/VR technologies, and widespread e-commerce integration. Major retail and fashion brands in the US are heavily investing in AI-driven virtual try-on systems to enhance customer experience, minimize return rates, and drive online sales conversions.
Increasing consumer inclination toward personalized and contactless shopping experiences has accelerated market growth across apparel, eyewear, and cosmetics categories. The rapid penetration of 5G and mobile-based AR applications has also improved the accessibility of real-time virtual fittings.
As digital transformation deepens across the US retail ecosystem, virtual try-on solutions are becoming core to omnichannel strategies, positioning the country as a global leader in virtual retail innovation and immersive commerce experiences.
Key Regions and Countries
North America
- US
- Canada
Europe
- Germany
- France
- The UK
- Spain
- Italy
- Rest of Europe
Asia Pacific
- China
- Japan
- South Korea
- India
- Australia
- Rest of APAC
Latin America
- Brazil
- Mexico
- Rest of Latin America
Middle East and Africa
- GCC
- South Africa
- Rest of MEA
Market Dynamics
Drivers
| Driver | (~) % Impact on CAGR Forecast | Geographic Relevance | Impact Timeline |
|---|---|---|---|
| Return-cost reduction imperative | +4.2% | North America, Europe, Asia-Pacific | Short term (2 years or less) |
| Generative AI visualization rollout | +3.6% | Global, led by North America and East Asia | Short term (2 years or less) |
| Mobile commerce engagement | +2.8% | Asia-Pacific, Middle East, Latin America | Short term (2 years or less) |
| Omnichannel clienteling investment | +2.2% | North America, Western Europe, Gulf Cooperation Council | Medium term (2 to 4 years) |
| Social-commerce product discovery | +1.9% | Asia-Pacific, North America, Latin America | Short term (2 years or less) |
Return-cost reduction imperative
High return volumes are turning virtual try-on from a discretionary customer-experience feature into a measurable profitability tool. The U.S. National Retail Federation reported that merchandise returns represented 16.9% of annual retail sales in 2024, while U.S. Census Bureau data showed e-commerce continuing to expand faster than total retail through 2024 and 2025.
More accurate product visualization can lower handling, inspection, resale, and markdown costs, allowing retailers to fund virtual try-on from measurable operational savings rather than marketing budgets alone. This can support usage-based or conversion-linked software contracts and improve investment payback. Return-reduction economics could contribute approximately 4.2% upside to the market’s 34.6% baseline CAGR without creating a separate growth path.
Restraints
| Restraint | (~) % Impact on CAGR Forecast | Geographic Relevance | Impact Timeline |
|---|---|---|---|
| Biometric-data consent exposure | -3.8% | European Union, United States, United Kingdom | Short term (2 years or less) |
| Retail technology budget freezes | -2.7% | North America, Europe, emerging markets | Short term (2 years or less) |
| Fragmented legal liability | -2.2% | United States, European Union | Medium term (2 to 4 years) |
| High enterprise integration cost | -1.8% | Global | Short term (2 years or less) |
| Consumer camera-permission refusal | -1.5% | Europe, North America, Japan | Short term (2 years or less) |
Biometric-data consent exposure
Camera-based face, body-shape, and measurement tools face strict privacy and compliance requirements that can slow commercial deployment. Under the GDPR, valid consent must be freely given, specific, informed, and unambiguous. The EU AI Act also introduced prohibited AI practices from 2 February 2025, following the Regulation’s entry into force on 1 August 2024, increasing compliance obligations for retailers using biometric or body-based experiences.
In the United States, state-level biometric laws and litigation risks can require separate legal reviews, redesigned consent processes, and jurisdiction-specific data controls. As a result, regulatory and compliance pressure could create an estimated 3.8% drag on the market’s 34.6% baseline CAGR, even where consumer demand remains strong.
Challenges
| Challenge | (~) % CAGR Friction Drag | Geographic Relevance | Mitigation Horizon |
|---|---|---|---|
| Product Data Quality Gaps | -3.4% | Global | Medium term (2 to 4 years) |
| Fit Accuracy Across Bodies | -2.9% | Global | Medium term (2 to 4 years) |
| Real-Time Rendering Latency | -2.1% | Emerging markets, mobile-first regions | Short term (2 years or less) |
| Catalog Digitization Backlogs | -1.9% | Europe, North America, Asia-Pacific | Medium term (2 to 4 years) |
| Multimodal AI Talent Scarcity | -1.6% | North America, Europe, India, East Asia | Long term (4 years or more) |
Product Data Quality Gaps
Virtual try-on accuracy depends on consistent product geometry, size grading, fabric behavior, color representation, and image metadata. U.S. Census Bureau data showing continued e-commerce expansion into 2026, together with the National Retail Federation’s 16.9% overall return rate in 2024, highlights the financial impact of incomplete or inaccurate product information.
Research published in 2025 also identified personalization, realism, and purchase readiness as important factors influencing virtual try-on performance. Continued investment in product-information governance, 3D asset creation, and performance tracking is therefore required, creating an estimated 3.4% drag on the market’s maximum attainable growth trajectory.
Opportunities
| Opportunity | (~) % Potential CAGR Upside | Geographic Relevance | Execution Window |
|---|---|---|---|
| Fit-intelligence transaction monetization | +4.0% | Global, led by North America and Europe | Medium term (2 to 4 years) |
| Healthcare and optical adjacencies | +3.2% | North America, Europe, Asia-Pacific | Medium term (2 to 4 years) |
| Creator-led digital merchandise | +2.7% | Asia-Pacific, North America, Middle East | Medium term (2 to 4 years) |
| Store associate assisted selling | +2.3% | North America, Europe, Gulf Cooperation Council | Short term (2 years or less) |
| Cross-border localized fit platforms | +2.0% | Asia-Pacific, Europe, Latin America | Long term (4 years or more) |
Fit-intelligence transaction monetization
Fit-intelligence monetization remains a future opportunity because many virtual try-on solutions are still offered mainly as free conversion tools rather than revenue-generating decision systems. The U.S. National Retail Federation estimated an overall retail return rate of 16.9% in 2024, while U.S. Census Bureau data showed e-commerce sales increased 12.4% year on year in the second quarter of 2026.
European consent requirements limit unrestricted biometric profiling, but compliant first-party fit profiles can still support premium analytics, performance-based pricing, and inventory-aware size recommendations. If providers shift from feature-based licensing toward transaction-linked fit intelligence, the market could gain a plausible 4.0% CAGR upside above the 34.6% baseline.
Key Players Analysis
Tier 1 leaders benefit from strong parent company balance sheets and established retail technology operations. DeepAR operates within Zalando, which reported revenue of EUR 12.3 billion in FY2025, representing growth of 16.8%. Gross merchandise volume reached EUR 17.6 billion, while adjusted EBIT stood at EUR 591 million.
Zalando’s B2B business also provides a strong commercial base for retail technology expansion. B2B revenue increased 14.6% to EUR 1.1 billion in 2025. The group guided capital expenditure of EUR 200 million to EUR 280 million for 2025, supporting investment in technology, digital assets, and infrastructure that can strengthen DeepAR’s AR and 3D capabilities.
MySize Inc. remains the listed pure-play participant among leading providers. Platform revenue reached approximately USD 10 million in 2025, while revenue for the first six months of 2026 increased to USD 5.46 million from USD 3.49 million a year earlier. Second-quarter 2026 revenue grew 53% to USD 3.07 million, while third-quarter 2025 revenue reached USD 2.6 million, generating gross profit of USD 1.0 million, up 27% year on year. Operating loss also narrowed by 9% to USD 3.0 million.
Tier 2 challengers compete through specialised accuracy, vertical expertise, and broader distribution channels. 3DLOOK Inc. has raised USD 11.2 million, including a USD 6.5 million Series A, while ZAKEKE secured a EUR 2 million SAFE round and received the Visual Commerce Solution of the Year award in 2025. Banuba Limited offers Shopify plans ranging from USD 319 to USD 1,599 per month, while Wannaby Inc., metadome.ai, WEARFITS, AUGLIO, Zugara, Queppelin, and QUYTECH maintain service-led positions across footwear, automotive, and enterprise AR applications.
Top Key Players in the Market
- DeepAR (I Love Ice Cream Ltd.)
- metadome.ai (Formerly Adloid)
- 3DLOOK Inc.
- AUGLIO
- Wannaby Inc.
- Quy Technology Pvt. Ltd. (QUYTECH)
- WEARFITS
- MySize Inc.
- Zugara, Inc.
- Banuba Limited
- Queppelin
- ZAKEKE
Recent Developments
- In April 2025, Zalando acquired DeepAR (I Love Ice Cream Ltd.), which now runs as an independent 3D and AR commerce unit within a group that served 62 million active customers by the close of FY2025.
- In May 2025, MySize Inc. acquired key assets of Percentil through its Spanish subsidiary New Percentil, S.L. for about EUR 610,000 (USD 679,000), made up of a EUR 40,000 cash payment and EUR 570,000 in assumed liabilities, and projected USD 1.5 million in second-half revenue from the unit.
- In September 2025, MySize Inc. acquired ShoeSize.Me for 241,093 shares of common stock plus USD 150,000 in cash, and issued a five-year milestone warrant for 28,000 shares to a key employee.
- In March 2026, MySize Inc. signed a non-binding letter of intent through its subsidiary to buy selected assets of EyeFitU, which carries roughly USD 440,000 in estimated 2026 revenue, as management targets about USD 15 million in group revenue for 2026.
- In July 2026, Banuba Limited launched Easy Virtual Try-On for makeup and eyewear merchants, priced from USD 49 per month with unlimited digital products and a 14-day free trial on every tier, and set live in about five minutes with no developer work.
Report Scope
| Report Features | Description |
|---|---|
| Market Value (2024) | USD 12.6 Billion |
| Forecast Revenue (2034) | USD 245.9 Billion |
| CAGR (2025-2034) | 34.6% |
| Base Year for Estimation | 2025 |
| Historic Period | 2020-2023 |
| Forecast Period | 2025-2034 |
| Report Coverage | Revenue Forecast, Market Dynamics, Competitive Landscape, Recent Developments |
| Segments Covered | By Technology (Augmented Reality, Virtual Reality, Artificial Intelligence and Machine Learning, Others); By Device (Smartphones and Tablets, Computer); By Application (Apparel and Clothing, Wristwatch and Jewelry, Eye Wear, Footwear, Others) |
| Regional Analysis | North America – US, Canada; Europe – Germany, France, The UK, Spain, Italy, Rest of Europe; Asia Pacific – China, Japan, South Korea, India, Australia, Singapore, Rest of APAC; Latin America – Brazil, Mexico, Rest of Latin America; Middle East & Africa – GCC, South Africa, Rest of MEA |
| Competitive Landscape | DeepAR (I Love Ice Cream Ltd.), metadome.ai (Formerly Adloid), 3DLOOK Inc., AUGLIO, Wannaby Inc., Quy Technology Pvt. Ltd. (QUYTECH), WEARFITS, MySize Inc., Zugara, Inc., Banuba Limited, Queppelin, ZAKEKE |
| Customization Scope | Customization for segments, region/country-level will be provided. Additional customization can be done based on requirements. |
| Purchase Options | We have three licenses to opt for: Single User License, Multi-User License (Up to 5 Users), Corporate Use License (Unlimited Users and Printable PDF) |





























