
Global Utility And Energy Analytics Market Size, Share and Analysis Report By Deployment (On-premise, Cloud), By Component (Software, Services, Hardware / Edge Devices), By Application (Meter Operations and Data Management, Load and Generation Forecasting, Demand Response and Flexibility, Distribution Planning and Optimisation, Asset Performance Management, Outage Management and Reliability), By Utility Type (Electric, Gas, Water, Multi-utility), By End-user (Generation Utilities, Transmission and Distribution Operators, Retail Energy Suppliers, Independent Power Producers, Others), By End-User (OEMs, Aftermarket), By Regional Analysis, Global Trends and Opportunity, Future Outlook By 2024-2034
- Published date: Jan. 2026
- Report ID: 175218
- Number of Pages: 322
- Format:
-
keyboard_arrow_up
Quick Navigation
- Report Overview
- Key Takeaway
- Drivers Impact Analysis
- Risk Impact Analysis
- Restraint Impact Analysis
- Deployment Analysis
- Component Analysis
- Application Analysis
- Utility Type Analysis
- End-User Analysis
- Regional Analysis
- Investor Type Impact Matrix
- Technology Enablement Analysis
- Driver Analysis
- Restraint Analysis
- Opportunity Analysis
- Challenge Analysis
- Emerging Trends
- Growth Factors
- Key Market Segments
- Key Players Analysis
- Recent Developments
- Report Scope
Report Overview
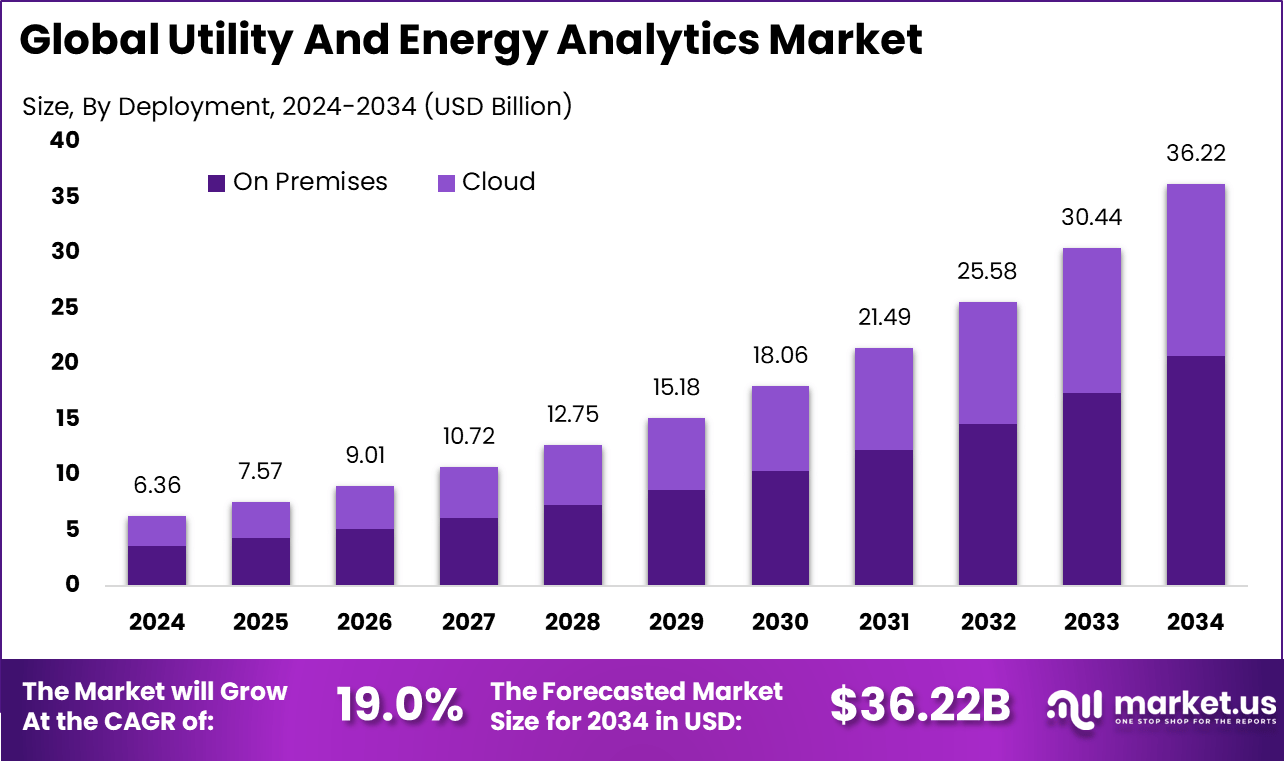
The Global Utility And Energy Analytics Market size is expected to be worth around USD 36.22 billion by 2034, from USD 6.36 billion in 2024, growing at a CAGR of 19.0% during the forecast period from 2025 to 2034. North America held a dominant market position, capturing more than a 35.7% share, holding USD 2.27 billion in revenue.
The utility and energy analytics market refers to the use of data analytics tools to monitor, optimize, and manage energy production, distribution, and consumption. These solutions help utilities and energy companies process large volumes of operational and consumer data to make informed decisions. They support energy efficiency, grid reliability, predictive maintenance, and regulatory compliance.
Analytics tools provide actionable insights for both renewable and non-renewable energy sources, helping companies to reduce costs and improve sustainability. Adoption spans electricity, water, gas utilities, and energy service providers. Market development has been driven by the increasing complexity of energy systems and the need for smarter, data-driven solutions.
With the rise of renewable energy and decentralized power generation, utilities require advanced analytics to maintain grid stability and optimize resource distribution. Traditional methods are often inadequate for addressing real-time challenges. AI and machine learning-powered analytics provide faster, more accurate insights, improving both operational efficiency and decision-making. As demand for energy efficiency and sustainability rises, the utility and energy analytics market continues to expand.
For instance, in May 2025, Schneider Electric opened an Innovation Center in Houston focused on advanced analytics for grid reliability. This facility helps utilities predict outages and optimize energy flow using real-time data from smart meters. It’s a smart move as North American grids face growing demand from EVs and renewables, giving Schneider an edge in delivering practical tools that cut downtime and boost efficiency for power companies.
One major driving factor of the utility and energy analytics market is the increasing demand for energy efficiency and sustainability. Governments and industries are under pressure to reduce carbon footprints and optimize energy use. Analytics tools help track consumption patterns, identify inefficiencies, and suggest corrective actions. AI-driven insights enable smarter energy management, supporting energy savings. Sustainability goals strongly drive adoption across industries.
Key Takeaway
- In 2024, the on-premise segment held a dominant market position, capturing a 57.3% share of the Global Utility and Energy Analytics Market.
- The hardware/edge devices segment held a dominant market position, capturing a 48.4% share of the Global Utility and Energy Analytics Market in 2024.
- Meter operations and data management held a dominant market position, capturing a 38.5% share of the Global Utility and Energy Analytics Market.
- The electric segment held a dominant market position, capturing a 48.7% share of the Global Utility and Energy Analytics Market in 2024.
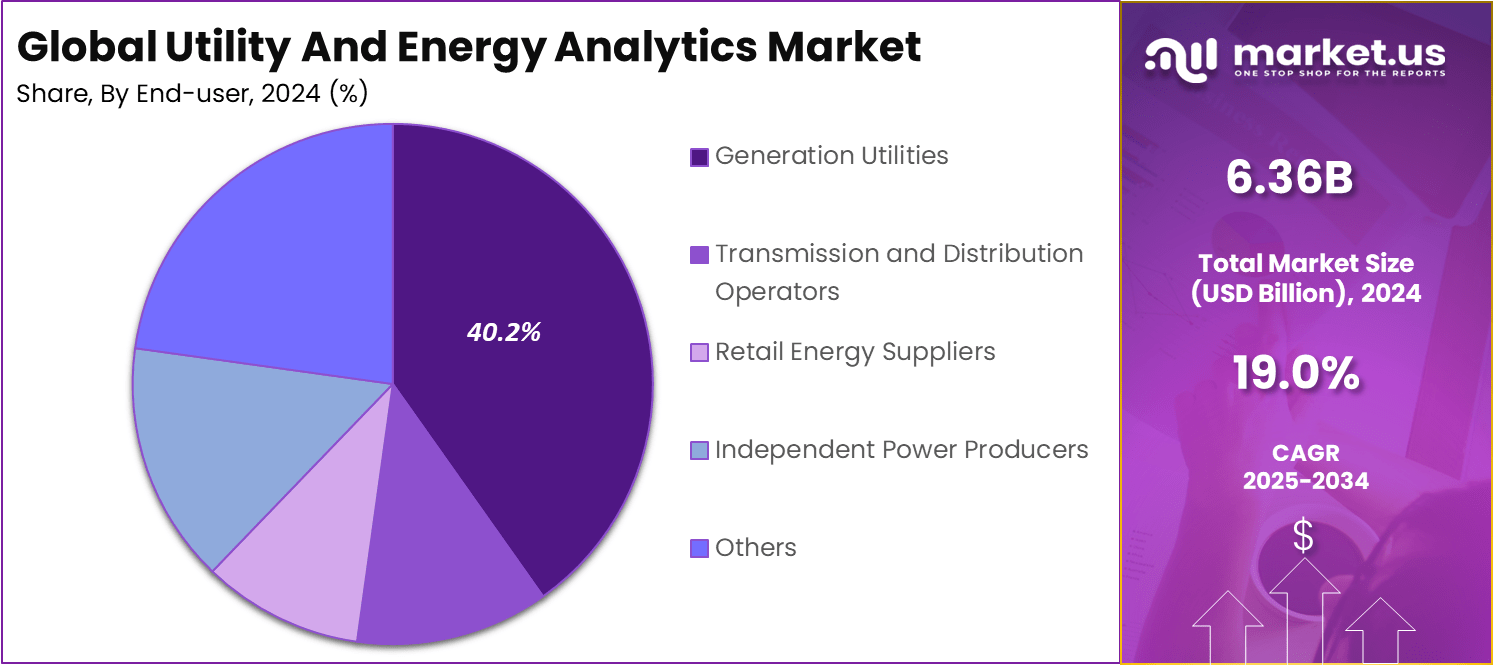
- The generation utilities segment held a dominant market position, capturing a 40.2% share of the Global Utility and Energy Analytics Market.
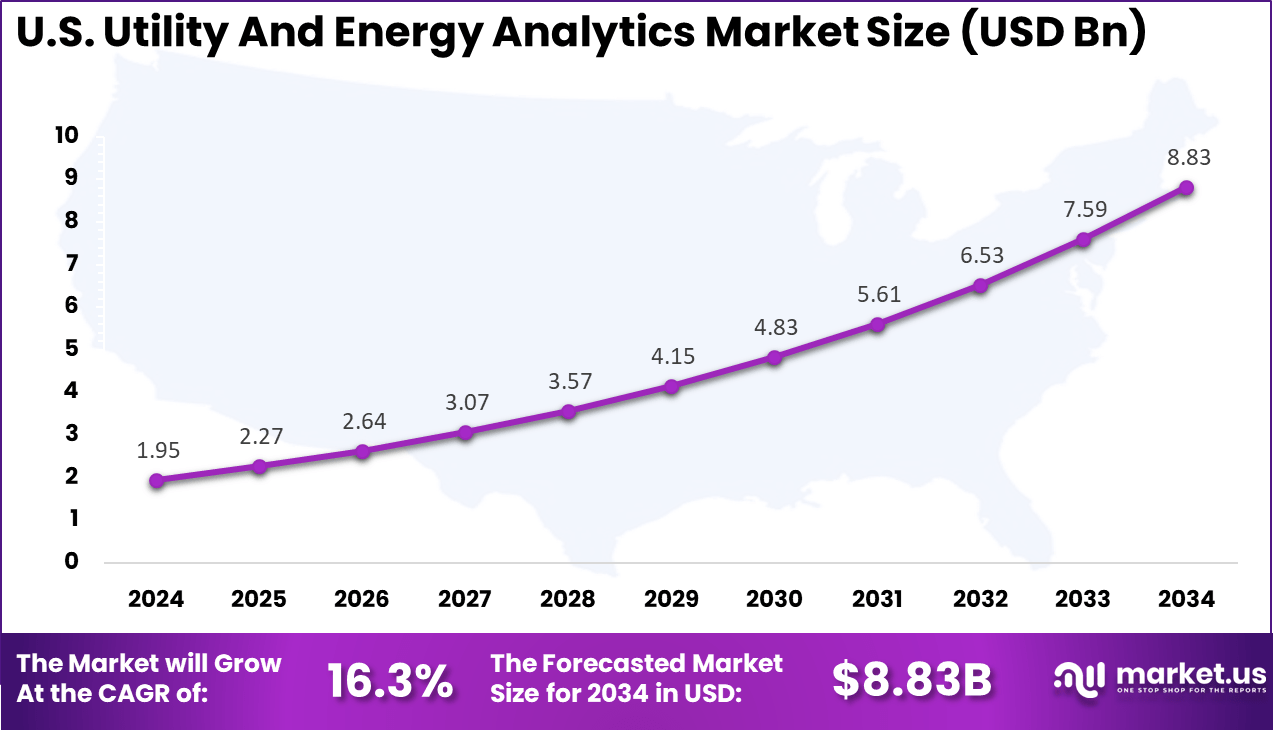
- The U.S. Utility and Energy Analytics Market was valued at USD 1.95 billion in 2024, with a robust CAGR of 16.3%.
- North America held a dominant market position, capturing more than a 35.7% share of the Global Utility and Energy Analytics Market.
Drivers Impact Analysis
Driver Category Key Driver Description Estimated Impact on CAGR (%) Geographic Relevance Impact Timeline Rising energy demand Need for optimized resource allocation and forecasting ~7.2% Global Short Term Adoption of smart grid technologies Enhanced data collection and analysis for efficiency ~6.5% North America, Europe Short Term Increased regulatory pressure Compliance with sustainability and reporting standards ~5.7% North America, Europe Mid Term Advancements in AI and machine learning Improved predictive analytics and operational insights ~5.2% Global Mid Term Integration of renewable energy Demand for analytics to optimize renewable integration ~4.1% Global Long Term Risk Impact Analysis
Risk Category Risk Description Estimated Negative Impact on CAGR (%) Geographic Exposure Risk Timeline Data security concerns Protection of sensitive operational data ~5.4% Global Short Term Integration challenges Compatibility with legacy infrastructure ~4.7% Global Mid Term High implementation cost Expensive initial setup and training ~4.2% Emerging Markets Short to Mid Term Regulatory uncertainty Inconsistent regulations across regions ~3.9% Global Mid Term Data privacy issues Concerns over the collection and analysis of consumer data ~3.2% Europe, North America Long Term Restraint Impact Analysis
Restraint Factor Restraint Description Impact on Market Expansion (%) Most Affected Regions Duration of Impact High cost of implementation Expenses related to infrastructure and AI tools ~6.3% Emerging Markets Short to Mid Term Lack of skilled workforce Shortage of data scientists and analysts ~5.1% Global Mid Term Data privacy concerns Government regulations around data use ~4.6% Europe, North America Mid Term Complexity of integration Difficulty in merging analytics tools with existing systems ~3.8% Global Long Term Limited access to data Incomplete or inaccurate data from legacy systems ~3.1% Global Long Term Deployment Analysis
On-premise deployment accounts for 57.3% of the utility and energy analytics market, reflecting the sector’s preference for control and data security. Utilities manage sensitive operational and customer data that often requires localized storage and processing. On-premise systems allow direct oversight of infrastructure and analytics workflows.
These deployments support real-time monitoring of grid operations and asset performance. Utilities benefit from reduced latency and uninterrupted access to analytics platforms. This is critical for operational continuity and emergency response.
Despite growing cloud interest, on-premise solutions remain widely adopted. Regulatory requirements and legacy system integration support continued use. This keeps on-premise deployment dominant in the market.
For Instance, in February 2025, Oracle Corporation secured a major contract with a North American utility to deploy its Utilities Analytics suite on-premises. This setup targets peak-demand reductions through personalized energy offers while keeping sensitive data under tight internal control. It shows how on-premise remains key for utilities needing full oversight in core operations.
Component Analysis
Hardware and edge devices represent 48.4% of the component segment, highlighting their role in data collection and processing. Sensors, meters, and edge computing devices capture real-time operational data. This data forms the foundation of analytics systems.
Edge devices enable preliminary data processing closer to the source. This reduces data transmission load and improves response time. Utilities rely on hardware reliability to ensure consistent data quality. As smart grid initiatives expand, demand for advanced hardware continues to grow. Edge computing supports scalable analytics architectures. This sustains strong adoption of hardware components.
For instance, in September 2025, Hitachi Energy Ltd. earned recognition as the top global supplier of grid automation hardware. Their edge devices enhance real-time data processing at substations and meters. This leadership underscores hardware’s role in cutting delays for smarter grid responses.
Application Analysis
Meter operations and data management account for 38.5% of application demand. Utilities generate large volumes of consumption and performance data from smart meters. Analytics tools help manage and interpret this data efficiently. These applications support billing accuracy, usage forecasting, and anomaly detection.
Utilities use insights to reduce losses and improve customer service. Data-driven meter management improves operational transparency. As smart meter deployment increases, analytics adoption grows. Efficient data handling becomes essential. This application remains a core focus area.
For Instance, in November 2025, Landis+Gyr AG advanced its meter data platforms with new analytics for operations. These tools streamline readings for billing and outage tracking across utilities. The update boosts data accuracy in daily meter management tasks.
Utility Type Analysis
Electric utilities hold a 48.7% share, making them the largest utility type using analytics solutions. Electric grids require continuous monitoring and optimization. Analytics support load balancing and outage management.
Electric utilities face increasing demand and grid complexity. Analytics tools help forecast demand and manage distributed energy resources. This improves grid stability and efficiency. As electrification expands, analytics adoption rises. Electric utilities continue to invest in advanced monitoring solutions. This segment remains dominant.
For Instance, in August 2025, SAS Institute Inc. rolled out utility analytics tailored for electric grids. Features focus on demand forecasting and loss detection in power distribution. Electric utilities gain from these tools in balancing loads reliably.
End-User Analysis
Generation utilities account for 40.2% of end-user demand, reflecting the need for performance optimization in power generation. Analytics tools monitor plant efficiency, equipment health, and output levels. This supports informed operational decisions.
Generation utilities use analytics to reduce downtime and improve fuel efficiency. Predictive insights support maintenance planning. This improves asset lifespan and cost management. As generation portfolios diversify, analytics become more valuable. Utilities seek data-driven performance improvements. This sustains demand from generation utilities.
For Instance, in June 2025, Wipro Ltd. teamed with Microsoft on Energy Data Services for generation firms. The platform ingests subsurface data to optimize plant output and forecasting. Generation utilities benefit from better alignment of production to demand.
Regional Analysis
North America holds a 35.7% share of the utility and energy analytics market, supported by advanced grid infrastructure. Utilities in the region invest in analytics to modernize operations and improve efficiency. Regulatory focus on reliability supports adoption.
For instance, in March 2025, Bidgely Inc. acquired Grid4C to expand its UtilityAI™ Platform, bolstering AI-driven energy disaggregation for grid management, DER forecasting, and consumer engagement. This move strengthens North America’s dominance in analytics by delivering granular load insights and demand response capabilities.
Region Primary Growth Driver Regional Share (%) Regional Value (USD Bn) Adoption Maturity North America Regulatory mandates and energy optimization initiatives 35.7% USD 2.27 Bn Advanced Europe Adoption of smart grid and renewable energy optimization 32.1% USD 2.04 Bn Advanced Asia Pacific Increasing demand for energy and resource optimization 21.4% USD 1.36 Bn Developing to Advanced Latin America Growing energy sector and smart grid adoption 6.0% USD 0.38 Bn Developing Middle East and Africa Energy resource management for sustainable growth 4.8% USD 0.31 Bn Early 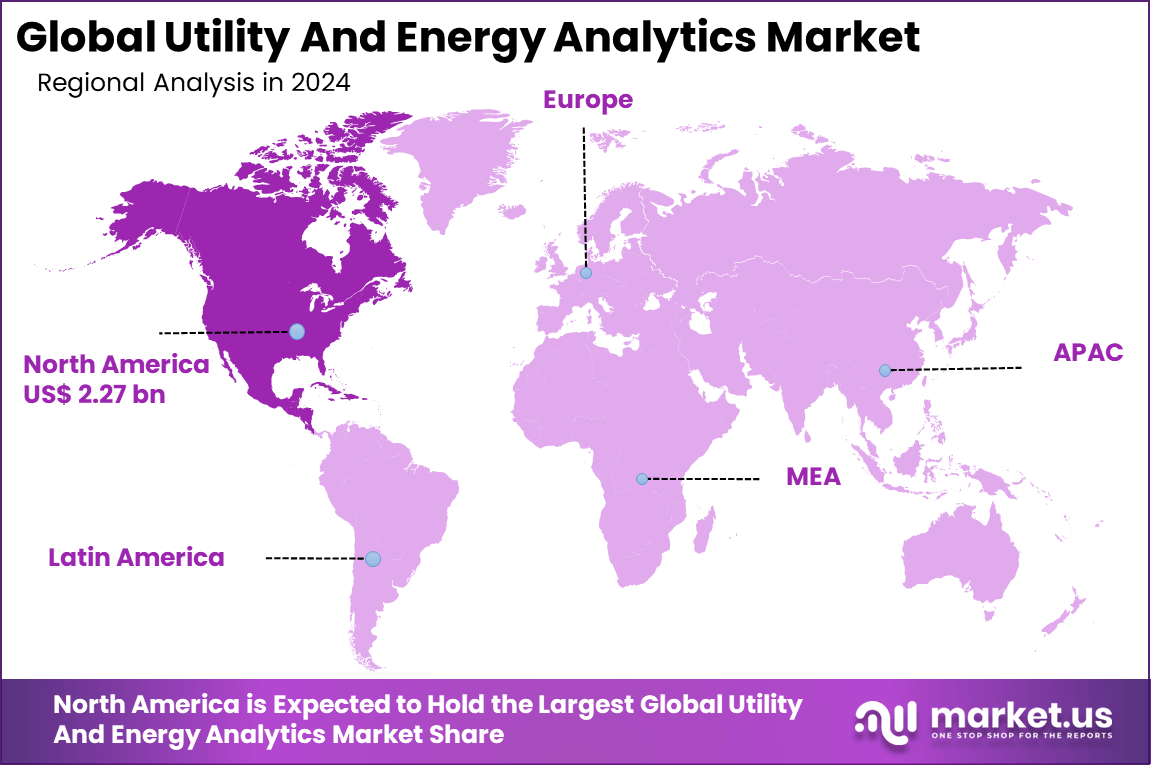
The United States contributes USD 1.95 billion in market value, driven by large-scale utility operations and smart grid initiatives. Utilities prioritize data-driven decision making. Analytics tools align with these objectives. A CAGR of 16.3% reflects steady growth across the region. Increasing digitalization of energy systems supports expansion. North America remains a key market for utility and energy analytics.
For instance, in December 2025, Xcel Energy partnered with Oracle to deploy the AI-powered Oracle Opower Platform, providing personalized energy usage insights to millions of customers across North America. This initiative exemplifies U.S. leadership in utility analytics by enabling seamless customer engagement, peak demand management, and clean energy transitions through advanced data analytics.
Investor Type Impact Matrix
Investor Type Adoption Level Contribution to Market Growth (%) Key Motivation Investment Behavior Energy providers and utilities Very High ~58.7% Efficiency, compliance, and optimization Long term strategic investments Solution providers High ~26.2% Market penetration and technology deployment R and D and product expansion Government bodies Moderate ~9.4% Regulatory compliance and sustainability Policy development and support Technology vendors Moderate ~5.6% Innovation and analytics platforms Technology adoption and integration Retail and commercial consumers Low ~4.0% Reduced energy consumption costs Program based investments Technology Enablement Analysis
Technology Layer Enablement Role Impact on Market Growth (%) Adoption Status IoT enabled smart meters Real time data collection for analytics ~7.3% Growing Machine learning algorithms Predictive analysis and pattern recognition ~6.5% Growing AI driven optimization platforms Automated decision making and optimization ~5.8% Mature Cloud computing platforms Scalable data storage and analysis ~4.4% Mature Blockchain for energy tracking Ensuring transparency and data security ~3.7% Developing Driver Analysis
The utility and energy analytics market is being driven by the increasing demand for improved operational efficiency, cost optimisation, and sustainability in energy production and consumption. Utilities and energy providers are leveraging advanced analytics to process large volumes of data from smart meters, grid sensors, and asset monitoring systems to gain actionable insights into consumption patterns, system performance, and demand forecasting.
The shift toward renewable energy sources, grid modernisation, and regulatory emphasis on efficiency and emission reduction further reinforce investment in analytics solutions that can optimise load balancing, reduce losses, and support proactive maintenance. Enhanced visibility into energy flows enables organisations to make data‑informed decisions that strengthen reliability and customer service.
Restraint Analysis
A key restraint in the utility and energy analytics market relates to the challenges of integrating disparate data sources and ensuring data quality across complex infrastructure environments. Energy systems often combine legacy equipment, diverse communication protocols, and varied sensor technologies, which can make harmonising data for analytics difficult.
Inconsistent or incomplete data can reduce the reliability of analytics outcomes and limit trust in insights. Organisations may also face technical and organisational barriers in aligning analytics platforms with existing operational and enterprise systems, which can increase implementation costs and extend deployment timelines.
Opportunity Analysis
Emerging opportunities in the utility and energy analytics market are linked to the expanding adoption of predictive analytics, real‑time optimisation, and digital twin models that simulate energy systems under varying conditions. Predictive models support proactive maintenance and asset life extension by identifying potential failures before they occur, reducing downtime and repair costs.
There is also opportunity in advanced demand‑side analytics that enable dynamic pricing, load shifting, and tailored energy efficiency programmes for consumers and industrial users. Platforms that combine advanced analytics with visualisation and decision support can help stakeholders across operations, planning, and customer engagement derive more strategic value from energy data.
Challenge Analysis
A central challenge confronting this market involves balancing analytical depth with interpretability and operational relevance. Advanced models such as machine learning algorithms can identify complex patterns and forecast outcomes, but stakeholders often require clear explanations of how insights are generated to trust and act upon them.
Ensuring analytics outputs align with business objectives and regulatory frameworks, while remaining understandable to planners and operators, demands careful design of user interfaces, explanation mechanisms, and contextual reporting. Achieving this balance is essential to drive adoption and integrate analytics into core decision‑making processes.
Emerging Trends
Emerging trends within the utility and energy analytics landscape include the integration of artificial intelligence and machine learning to support real‑time anomaly detection, demand forecasting, and automated optimisation. Another trend is the use of cloud‑based analytics platforms that provide scalable processing, remote access, and collaborative environments for cross‑functional teams.
Utilities are also exploring edge analytics that perform data processing closer to the source, reducing latency and network load for time‑sensitive applications. The convergence of digital twin technologies with energy analytics enables deeper scenario testing, system resilience analysis, and planning for future grid expansions.
Growth Factors
Growth in the utility and energy analytics market is supported by the accelerating deployment of smart meters, IoT sensors, and advanced grid infrastructure that generate high volumes of operational data. Increasing focus on decarbonisation, regulatory compliance, and customer‑centric energy services reinforces the need for analytics that can translate data into actionable insights.
Advancements in data integration, machine learning, and visualisation tools improve the accessibility and utility of analytics outcomes for organisations of varied sizes. As utilities seek to optimise performance, minimise costs, and support sustainable energy goals, analytics platforms remain integral to achieving these objectives and driving competitive advantage in evolving energy ecosystems.
Key Market Segments
By Deployment
- On-premise
- Cloud
By Component
- Software
- Services
- Hardware / Edge Devices
By Application
- Meter Operations and Data Management
- Load and Generation Forecasting
- Demand Response and Flexibility
- Distribution Planning and Optimisation
- Asset Performance Management
- Outage Management and Reliability
By Utility Type
- Electric
- Gas
- Water
- Multi-utility
By End-user
- Generation Utilities
- Transmission and Distribution Operators
- Retail Energy Suppliers
- Independent Power Producers
- Others
Key Regions and Countries
North America
- US
- Canada
Europe
- Germany
- France
- The UK
- Spain
- Italy
- Russia
- Netherlands
- Rest of Europe
Asia Pacific
- China
- Japan
- South Korea
- India
- Australia
- Singapore
- Thailand
- Vietnam
- Rest of APAC
Latin America
- Brazil
- Mexico
- Rest of Latin America
Middle East & Africa
- South Africa
- Saudi Arabia
- UAE
- Rest of MEA
Key Players Analysis
One of the leading players in March 2025, Siemens teamed up with TURN2X to weave biogas data into its analytics platform, sharpening its focus on renewables. This partnership lets utilities track and optimize green energy production in real time, cutting waste in the shift to sustainable sources. It’s the kind of targeted collab that keeps Siemens leading in energy transition analytics.
Top Key Players in the Market
- Oracle Corporation
- IBM Corporation
- Siemens AG
- Schneider Electric SE
- ABB Ltd
- General Electric Company
- SAS Institute Inc.
- SAP SE
- Capgemini SE
- Teradata Corporation
- Hitachi Energy Ltd.
- Landis+Gyr AG
- Itron Inc.
- AutoGrid Systems Inc.
- Wipro Ltd.
- Accenture plc
- Amazon Web Services (AWS) Utilities
- Microsoft Azure Energy
- Enel X
- Nexant Inc.
- OSIsoft (AVEVA)
- Uptake Technologies
- Bidgely Inc.
- Smarter Grid Solutions
- Others
Recent Developments
- In May 2025, Schneider Electric opened an Innovation Center in Houston focused on advanced analytics for grid reliability. This facility helps utilities predict outages and optimize energy flow using real-time data from smart meters. It’s a smart move as North American grids face growing demand from EVs and renewables, giving Schneider an edge in delivering practical tools that cut downtime and boost efficiency for power companies.
- In September 2025, Hitachi Energy took the top spot as the world’s leading grid automation supplier per ARC’s latest study. Their systems excel at integrating analytics for smarter power distribution, especially with rising renewables. This recognition cements their role in helping U.S. and Canadian grids handle more variable energy sources reliably.
Report Scope
Report Features Description Market Value (2024) USD 6.3 Bn Forecast Revenue (2034) USD 36.2 Bn CAGR (2025-2034) 19% Base Year for Estimation 2025 Historic Period 2020-2024 Forecast Period 2026-2035 Report Coverage Revenue forecast, AI impact on Market trends, Share Insights, Company ranking, competitive landscape, Recent Developments, Market Dynamics and Emerging Trends Segments Covered By Deployment (On-premise, Cloud), By Component (Software, Services, Hardware / Edge Devices), By Application (Meter Operations and Data Management, Load and Generation Forecasting, Demand Response and Flexibility, Distribution Planning and Optimisation, Asset Performance Management, Outage Management and Reliability), By Utility Type (Electric, Gas, Water, Multi-utility), By End-user (Generation Utilities, Transmission and Distribution Operators, Retail Energy Suppliers, Independent Power Producers, Others) Regional Analysis North America – US, Canada; Europe – Germany, France, The UK, Spain, Italy, Russia, Netherlands, Rest of Europe; Asia Pacific – China, Japan, South Korea, India, New Zealand, Singapore, Thailand, Vietnam, Rest of Latin America; Latin America – Brazil, Mexico, Rest of Latin America; Middle East & Africa – South Africa, Saudi Arabia, UAE, Rest of MEA Competitive Landscape Oracle Corporation, IBM Corporation, Siemens AG, Schneider Electric SE, ABB Ltd, General Electric Company, SAS Institute Inc., SAP SE, Capgemini SE, Teradata Corporation, Hitachi Energy Ltd., Landis+Gyr AG, Itron Inc., AutoGrid Systems Inc., Wipro Ltd., Accenture plc, Amazon Web Services (AWS) Utilities, Microsoft Azure Energy, Enel X, Nexant Inc., OSIsoft (AVEVA), Uptake Technologies, Bidgely Inc., Smarter Grid Solutions, Others Customization Scope Customization for segments, region/country-level will be provided. Moreover, additional customization can be done based on the requirements. Purchase Options We have three license to opt for: Single User License, Multi-User License (Up to 5 Users), Corporate Use License (Unlimited User and Printable PDF)  Utility and Energy Analytics MarketPublished date: Jan. 2026add_shopping_cartBuy Now get_appDownload Sample
 -
-
- Oracle Corporation
- IBM Corporation
- Siemens AG
- Schneider Electric SE
- ABB Ltd
- General Electric Company
- SAS Institute Inc.
- SAP SE
- Capgemini SE
- Teradata Corporation
- Hitachi Energy Ltd.
- Landis+Gyr AG
- Itron Inc.
- AutoGrid Systems Inc.
- Wipro Ltd.
- Accenture plc
- Amazon Web Services (AWS) Utilities
- Microsoft Azure Energy
- Enel X
- Nexant Inc.
- OSIsoft (AVEVA)
- Uptake Technologies
- Bidgely Inc.
- Smarter Grid Solutions
- Others
Our Clients
- 175218
- Jan. 2026


