


Report Overview
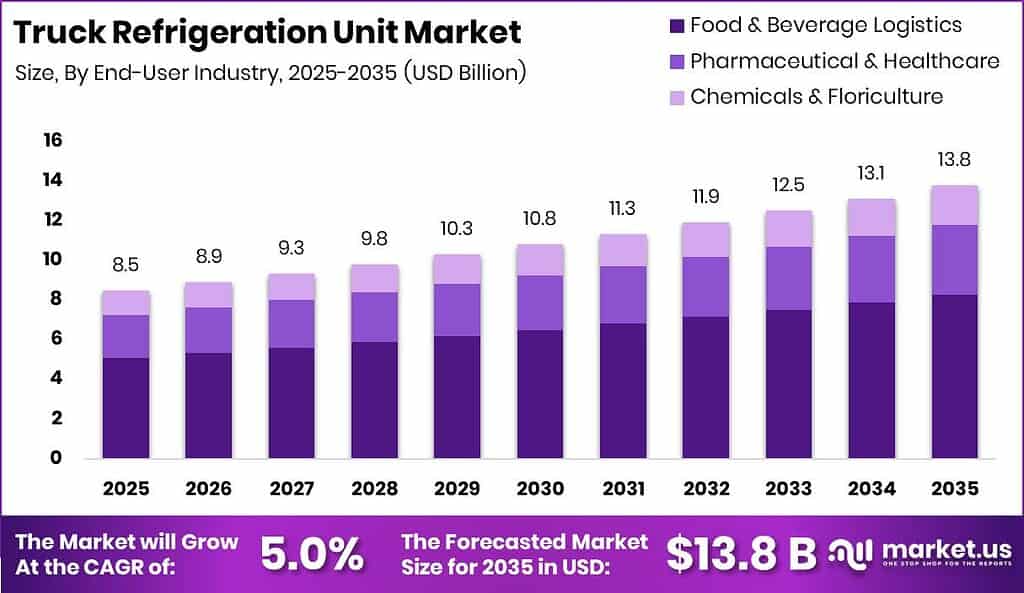
Global Truck Refrigeration Unit Market size is expected to be worth around USD 13.8 Billion by 2035 from USD 8.5 Billion in 2025, growing at a CAGR of 5.00% during the forecast period 2026 to 2035. This trajectory reflects consistent capital commitment from fleet operators across food, pharmaceutical, and chemical logistics sectors worldwide.
The truck refrigeration unit market encompasses mechanical and electrified systems installed on commercial vehicles to maintain precise temperature conditions during cargo transport. It spans diesel-engine units, electric TRUs, hybrid systems, and cryogenic platforms, serving vehicle classes from light vans to heavy commercial trucks. End users range from food distributors and grocery retailers to pharmaceutical wholesalers and chemical shippers, each requiring certified temperature performance across defined cargo corridors.
Key Takeaways
- The global Truck Refrigeration Unit Market is valued at USD 8.5 Billion in 2025 and is forecast to reach USD 13.8 Billion by 2035.
- The market expands at a CAGR of 5.00% from 2026 to 2035.
- By System Type and Propulsion, Diesel-engine TRUs dominate with a 72.60% share.
- By Vehicle Type, Heavy Commercial Vehicles hold the largest segment position.
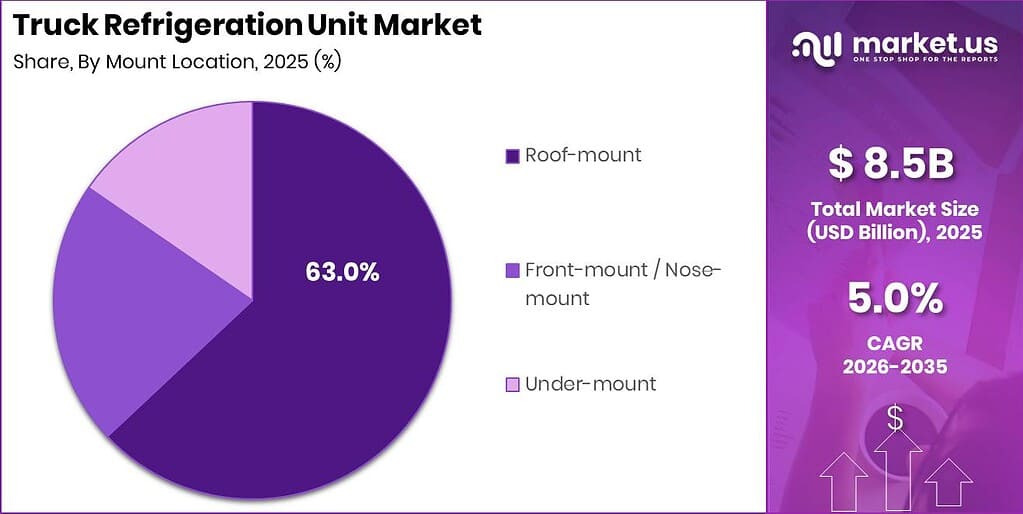
- By Mount Location, Roof-mount systems lead with a 63.00% share.
- By End-User Industry, Food and Beverage Logistics commands a 60.00% share.
- By Vehicle Type, Light Commercial Vehicles account for 50.00% of their sub-segment tier.
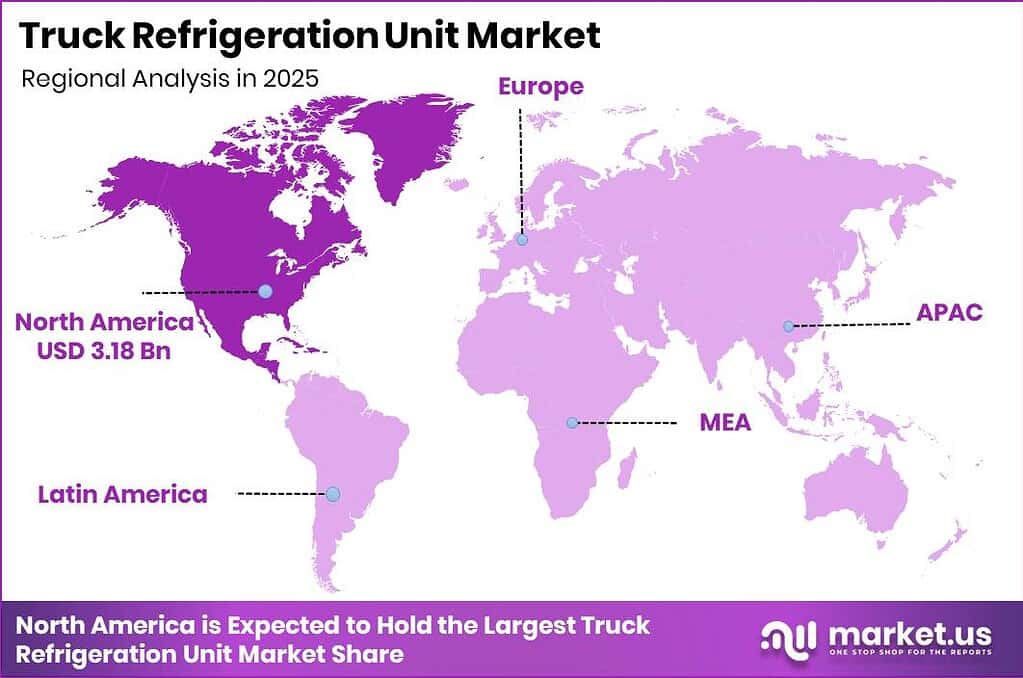
- North America dominates regionally with a 37.50% market share, valued at USD 3.18 Billion.
Government mandates are reshaping procurement decisions across this market. California’s zero-emission truck and TRU phase-in schedule, alongside EU F-gas refrigerant quota rules, is forcing fleet operators to accelerate replacement cycles before regulatory deadlines. These compliance pressures translate directly into forward order books for electric and low-GWP refrigerant units, giving manufacturers with certified product lines a structural sales advantage over traditional diesel-only suppliers through the near and medium term.
A 2025 peer-reviewed study found that alternative Refrigerated Transport systems, including cryogenic units, can reduce CO₂ emissions by up to 80% and NOx and particulate-matter emissions by up to 100%. This performance gap over diesel TRUs gives fleet buyers a quantifiable compliance tool, not just an environmental preference. Operators in regulated corridors who adopt alternative systems now avoid retrofit liability costs and position their fleets for tightening urban access rules.
As per our research, Staples Vegetables’ first 2 electric units are estimated to eliminate 256 tonnes of CO₂ over 10 years, an average of 12.8 tonnes per unit per year. This per-unit carbon abatement figure gives procurement teams a measurable cost-of-carbon argument alongside the operating-cost case. Vendors who package verified lifecycle carbon data alongside unit specifications will accelerate purchase decisions in sustainability-mandated logistics contracts.
System Type and Propulsion Analysis
Diesel-engine TRUs dominate with 72.60% due to universal fuel access and proven cold-chain reliability.
In 2025, Diesel-engine TRUs held a dominant market position in the By System Type and Propulsion segment of the Truck Refrigeration Unit Market, with a 72.60% share. According to Thermo King product specifications, the T-690 delivers engine-driven cooling of 19,000 BTU/h at 35°F, 12,000 BTU/h at 0°F, and 7,250 BTU/h at −20°F, while the higher-capacity T-690 MAX reaches 21,000 BTU/h at 35°F. This output range covers virtually every frozen and chilled cargo profile in commercial use, giving diesel TRUs a near-unmatched functional footprint that limits displacement by alternative propulsion types in the near term.
Electric TRUs serve fleet operators seeking fuel cost reduction and urban access compliance in zero-emission zones. Thermo King data shows the T-690 operating on SmartPower electric standby delivers 16,500 BTU/h at 35°F, 11,000 BTU/h at 0°F, and 6,500 BTU/h at −20°F. The T-690’s refrigerant charge is 6.2 lb and its standard weight is 910 lb, rising to 973 lb with SmartPower. These specifications confirm that electric standby preserves near-diesel thermal performance while eliminating idle emissions, making eTRUs the preferred upgrade path for depot-based multi-drop fleets where stationary charging is available.
Hybrid TRUs address operators who require both long-haul diesel range and urban-access compliance without committing to full electrification infrastructure. This system type captures fleet buyers sitting between full diesel and full electric replacement cycles, particularly in markets where grid charging infrastructure remains inconsistent. The Hwasung Thermo HT-100-II, a fully electric unit, provides 2,841 W at 0°C, 2,144 W at −10°C, and 1,454 W at −20°C under ATP test conditions at 35°C ambient, establishing a benchmark that hybrid systems must match to justify their added mechanical complexity. Cryogenic Systems serve specialist frozen-cargo corridors where no-power operation and ultra-low temperature performance below −20°C are operational requirements. These two sub-segments collectively hold the remaining share of the propulsion segment.
Vehicle Type Analysis
Heavy Commercial Vehicles dominate due to long-haul frozen cargo volume requirements.
In 2025, Heavy Commercial Vehicles held a dominant market position in the By Vehicle Type segment of the Truck Refrigeration Unit Market. HCVs carry the largest refrigerated payloads across national and cross-border corridors, requiring high-capacity TRU systems such as the T-690 MAX with its 947 lb base weight and 7.9 lb refrigerant charge. According to IRU (International Road Transport Union) fleet composition data, heavy trucks above 16 tonnes account for the majority of international refrigerated freight tonne-kilometres in Europe and North America. This structural volume dependency means HCV-segment TRU demand is directly tied to macroeconomic freight cycles, making it the segment most sensitive to freight-rate downturns and fleet renewal deferrals.
Medium Commercial Vehicles serve regional distribution networks where payload requirements sit between full truckload and last-mile van operations. MCV operators typically run mixed temperature fleets covering chilled and ambient loads on the same route, requiring TRU systems with flexible temperature-range switching. According to UNIDO industrial logistics data, MCV fleet growth in Asia-Pacific and Latin America is outpacing HCV additions as organized retail distribution infrastructure expands into secondary cities. This sub-segment offers vendors a growing attachment point for mid-range TRU products, particularly where fuel efficiency and compartment flexibility justify premium pricing over entry-level units.
Light Commercial Vehicles account for 50.00% within their sub-segment tier and represent the fastest-cycling replacement category in urban and peri-urban distribution. LCVs serve last-mile cold-chain delivery, including pharmacy home delivery, quick-commerce grocery dispatch, and foodservice distribution from micro-fulfilment nodes. The HT-100-II supports refrigerated compartments up to 13 m³ for frozen cargo and 22 m³ for fresh cargo, fitting LCV body dimensions used in van-class urban delivery. This compartment range, combined with the unit’s 350 V DC or 650 V DC stationary supply compatibility, makes purpose-built electric TRUs technically viable for LCV fleet operators already charging battery-electric delivery vans at depot infrastructure.
Mount Location Analysis
Roof-mount dominates with 63.00% due to space efficiency and multi-temperature compatibility.
In 2025, Roof-mount systems held a dominant market position in the By Mount Location segment of the Truck Refrigeration Unit Market, with a 63.00% share. Roof-mounted TRUs preserve cargo floor space entirely, allow multi-temperature compartment configurations, and reduce loading-bay access conflicts compared with front-mount alternatives. According to European Automobile Manufacturers Association (ACEA) commercial vehicle body-builder data, roof-mount configurations account for the majority of factory-fit and post-registration TRU installations on rigid trucks in the EU. Fleet operators in food and pharmaceutical logistics favor roof-mount placements because they support dual-evaporator layouts without cargo-space penalties, directly increasing revenue per trip for mixed-temperature loads.
Front-mount or Nose-mount systems serve heavy trailer applications where aerodynamic drag considerations are secondary to refrigeration output capacity. Nose-mount placement allows larger compressor and condenser assemblies, making this configuration the standard choice for long-haul frozen-cargo trailers operating at sustained −20°F or below. According to the American Trucking Associations (ATA), nose-mount TRUs represent the dominant installation type across refrigerated semi-trailer fleets in North America, where trailer lengths and interstate highway operations favor maximum unit output over urban maneuverability. This sub-segment’s demand is structurally tied to HCV procurement cycles and cross-border frozen food trade volumes.
Under-mount systems occupy a specialized niche serving urban delivery vehicles and refrigerated vans where roof-mount access is restricted by loading-dock height limits or vehicle design constraints. Under-mount configurations are common in municipal food distribution fleets operating in older European city centers with restricted overhead clearance. According to UK Department for Transport commercial vehicle statistics, under-mount TRU configurations appear predominantly on short-wheelbase rigid trucks used in urban grocery and catering supply. This sub-segment holds the remaining share of the mount location segment and competes primarily on installation flexibility rather than output capacity.
End-User Industry Analysis
Food and Beverage Logistics dominates with 60.00% due to mandatory cold-chain compliance across all perishable categories.
In 2025, Food and Beverage Logistics held a dominant market position in the By End-User Industry segment of the Truck Refrigeration Unit Market, with a 60.00% share. FAO food loss and waste data confirms that temperature failure during transport accounts for a significant portion of post-harvest losses in both developed and emerging markets, creating regulatory and commercial pressure on fleet operators to maintain certified cold chains. This compliance imperative drives continuous TRU replacement and upgrade activity, independent of freight rate cycles, because food safety enforcement carries direct liability exposure for carriers and shippers operating under HACCP and equivalent national standards.
Pharmaceutical and Healthcare logistics represent the fastest-growing end-user segment by unit value, as biologics, vaccines, and temperature-sensitive specialty medicines require tighter temperature bands and more rigorous audit documentation than standard food cargo. WHO Good Distribution Practice guidelines and national medicines regulatory authority inspection regimes mandate continuous temperature logging, real-time alert capability, and validated cold-chain equipment for licensed pharmaceutical distributors. According to IQVIA industry data, global pharmaceutical cold-chain logistics spending has expanded consistently as biologic drug volumes rise, directly increasing demand for high-specification Refrigeration Equipment with integrated telematics and calibration traceability.
Chemicals and Floriculture represent the remaining end-user share and serve distinct but structurally stable cold-chain niches. Chemical cargo requiring temperature-controlled transport includes adhesives, resins, and agricultural inputs sensitive to thermal degradation, while floriculture logistics spans intercontinental cut-flower supply chains with narrow temperature windows between harvest and retail. According to UN Comtrade trade flow data, the Netherlands and Kenya anchor global cut-flower export corridors that depend on certified refrigerated road transport at the first and last mile of air-freight supply chains. These sub-segments generate consistent recurring TRU demand tied to agricultural export seasonality rather than discretionary industrial capex cycles.
Key Market Segments
By System Type and Propulsion
- Diesel-engine TRUs
- Electric TRUs (eTRUs)
- Hybrid TRUs
- Cryogenic Systems
By Vehicle Type
- Heavy Commercial Vehicles (HCVs)
- Medium Commercial Vehicles (MCVs)
- Light Commercial Vehicles (LCVs)
By Mount Location
- Front-mount / Nose-mount
- Roof-mount
- Under-mount
By End-User Industry
- Food and Beverage Logistics
- Pharmaceutical and Healthcare
- Chemicals and Floriculture
Regional Analysis
North America Dominates the Truck Refrigeration Unit Market with a Market Share of 37.50%, Valued at USD 3.18 Billion
North America leads the global Truck Refrigeration Unit Market, driven by its mature cold-chain infrastructure, stringent food safety enforcement under FSMA, and California’s zero-emission TRU phase-in mandates that are accelerating fleet electrification investment. As reported by Market.us, the region holds 37.50% of global market value at USD 3.18 Billion in 2025. This regulatory pressure creates a replacement-purchase cycle independent of freight demand, giving North American TRU vendors a structurally elevated order base through the forecast period.
Asia-Pacific represents the fastest-growing regional market, where organized cold-chain infrastructure is expanding rapidly across China, India, and Southeast Asian economies to serve modern retail, foodservice, and pharmaceutical distribution. Food processing capacity build-out across India and ASEAN is converting informal ambient supply chains into certified refrigerated networks, creating first-time TRU demand across vehicle classes. This greenfield expansion distinguishes Asia-Pacific from mature markets where growth depends primarily on fleet replacement, giving new market entrants a lower-competition entry window in the region’s secondary cities and emerging pharmaceutical corridors.
Europe holds a significant share of the global market, supported by the EU F-gas refrigerant quota phase-down, GDP pharmaceutical cold-chain mandates, and a dense cross-border refrigerated freight network connecting food-producing regions in Southern and Eastern Europe to consumption centers in the West. Latin America and the Middle East and Africa regions contribute the remaining global share, with Brazil and Gulf states representing the primary investment anchors in each bloc. Vaccine and biologics cold-chain development in Sub-Saharan Africa and ASEAN is creating a nascent but structurally significant TRU demand pipeline that will materialize over the long-term forecast horizon.
Key Regions and Countries
North America
- US
- Canada
Europe
- Germany
- France
- The UK
- Spain
- Italy
- Rest of Europe
Asia Pacific
- China
- Japan
- South Korea
- India
- Australia
- Rest of APAC
Latin America
- Brazil
- Mexico
- Rest of Latin America
Middle East and Africa
- GCC
- South Africa
- Rest of MEA
Market Dynamics
Market Opportunity Analysis - Underserved vehicle classes, regions, and service models offer high-margin entry points for focused competitors
Light Commercial Vehicles represent the least saturated TRU sub-segment relative to their growth trajectory. LCVs account for 50.00% of their sub-segment tier, yet product development has historically focused on heavy trailer-class units. New entrants who engineer purpose-built electric TRUs for van-class bodies below 3.5 tonnes, compatible with existing 350 V DC depot infrastructure, can capture fleet-block purchase orders from quick-commerce operators before dominant players retool their lighter product lines to compete.
Asia-Pacific’s secondary cities present a greenfield cold-chain opportunity with no incumbent service network to displace. Unlike North America and Europe, where TRU replacement cycles follow established dealer channels, new markets in India, Vietnam, and Indonesia are building refrigerated distribution infrastructure for the first time. This means early entrants set the service standard rather than compete against it. Vendors who pair affordable mid-range TRU product with local technician training programs will lock in aftermarket revenue that compounds over the full asset lifecycle.
The Pharmaceutical and Healthcare end-user segment is the highest-value underpenetrated opportunity within the 60.00%-dominant food logistics market structure. Biologics and vaccine shipments require tighter temperature bands and more rigorous audit documentation than food cargo, commanding a price premium for validated, telematics-equipped TRU systems. By contrast, most current TRU fleets in emerging pharmaceutical corridors across Sub-Saharan Africa and South Asia run general-purpose food-grade equipment without continuous logging capability, creating a direct replacement demand for compliance-grade systems.
Cooling-as-a-service subscription models remain structurally underdeveloped, with sold-hour contracting confined to pilot programs. This creates an asymmetric opportunity: vendors who industrialize outcome-based contracting first will capture service gross margins of 40% to 55% versus the high-teens margins on equipment sales alone. The operators most likely to convert are LCV and MCV fleet buyers currently blocked by debt-service-coverage screens, for whom an operating-expense contract at USD 0.9 to USD 1.6 per refrigerated hour is more accessible than a capital purchase.
Technology and Innovation Landscape - Solar integration, electric drivetrain advances, and emissions-verified platforms redefine TRU competitive positioning
Solar-powered TRU operation has moved from concept to verified commercial deployment. A 2025 Sunswap case study reports that Staples Vegetables’ electric Cold Chain Logistics TRU fleet achieved 96% solar-powered operation at 30°C, requiring zero grid charging during peak summer. The same deployment is expected to cut transport-refrigeration operating costs by 78%. These figures establish solar-assisted electric TRUs as a commercially viable cost-reduction tool, not a pilot technology, shifting the business case from emissions compliance to direct operating expense reduction for fleet decision-makers.
Fleet-scale solar TRU adoption is accelerating beyond single-operator trials. Bannister Transport’s conversion program covers 40 refrigerated trailers, with electric units expected to operate on solar energy 80% to 85% of the time. This decision followed a 2-week operational trial under real chilled-delivery conditions. An industry technical article from Emissis reports that solar-powered Temperature Controlled Packaging refrigeration can save approximately 2,000 litres of diesel and more than 5 tonnes of carbon emissions per trailer annually. At current diesel prices, this fuel saving alone funds a meaningful portion of the solar TRU premium, accelerating payback calculations for fleet operators.
Battery-electric TRU specifications are now technically proven across a range of cargo temperature profiles. The Hwasung Thermo HT-100-II delivers 2,841 W at 0°C, 2,144 W at −10°C, and 1,454 W at −20°C under ATP test conditions at 35°C ambient, covering both chilled and frozen cargo requirements in a single platform. This thermal output range, combined with compartment support of up to 13 m³ for frozen and 22 m³ for fresh cargo, confirms that purpose-built eTRUs have closed the performance gap with diesel units across the LCV and MCV vehicle classes where replacement demand is fastest-growing.
Lifecycle emissions verification is becoming a competitive differentiator rather than a marketing footnote. Thermo King’s independently conducted life-cycle assessment found its E-Volution electric TRU reduces CO₂ by up to 45% versus diesel units, while a 2025 peer-reviewed review established that cryogenic and alternative TRU systems can reduce CO₂ by up to 80% and NOx and particulate-matter emissions by up to 100%. Vendors who publish independently verified lifecycle data gain a procurement advantage in regulated freight contracts where carbon certification is becoming a tendering requirement across European and North American logistics markets.
Drivers
Quick-commerce grocery fulfilment is restructuring perishable distribution toward sub-60-minute multi-drop dispatch from micro-fulfilment nodes. A single chilled route now involves 25 to 60 door openings per shift, compressing average TRU replacement intervals from roughly 8 years toward 5 to 6 years. This shift pushes demand toward smaller 2-to-6 kW battery-driven units, converting one-off equipment sales into recurring service contracts worth an estimated 8% to 14% of installed hardware value annually.
California’s zero-emission TRU phase-in schedule is forcing fleet renewal ahead of commercial replacement cycles, while pharmaceutical GDP temperature-integrity mandates and EU F-gas quota rules are expanding certified refrigerant retrofit demand across North America and Europe. Dark-store operators purchasing in fleet blocks of 50 to 400 vehicles cut customer acquisition costs by 20% to 30% versus owner-operator channels. Telematics-linked temperature audit trails are adding a recurring software revenue layer that did not exist in traditional TRU procurement models.
| Driver | (~) % Impact on CAGR Forecast | Geographic Relevance | Impact Timeline |
|---|---|---|---|
| Quick-commerce grocery fulfilment density | +1.2% | Asia-Pacific, Western Europe, North America | Short term (2 years or less) |
| California zero-emission truck TRU phase-in schedule | +1.1% | North America (California-anchored) | Short term (2 years or less) |
| Pharmaceutical GDP temperature-integrity mandates | +0.9% | North America, Europe, Japan | Medium term (2 to 4 years) |
| EU F-gas quota-driven refrigerant retrofit cycle | +0.8% | European Union, United Kingdom | Medium term (2 to 4 years) |
| Telematics-linked temperature audit trails | +0.6% | Global | Short term (2 years or less) |
| Organised food-processing capacity build-out | +0.4% | India, ASEAN, Brazil, Gulf states | Medium term (2 to 4 years) |
Restraints
Policy-rate normalisation documented in Federal Reserve and European Central Bank releases has raised the all-in financed cost of a refrigerated tractor-trailer combination by roughly 12% to 18% versus the pre-tightening cycle. Small carriers running fewer than 20 power units fail debt-service-coverage screens at the 1.25x threshold lenders apply, replacing renewal decisions with 18 to 30 additional months of run-out on units already past design life. This compresses vendor revenue from both equipment sales and new-fleet service attachments simultaneously.
Working-capital rates in middle-income economies sit in the 11% to 16% band, extending payback periods from 4 years to 5.5 to 7 years at prevailing lease factors. Captive finance arms absorb residual-value risk on softening secondary-market units, and vendor discounting runs 3 to 7 percentage points deeper than list price to close orders. Greenfield electrified assembly capacity is being phased in tranches rather than committed, pushing fixed-cost absorption problems into 2027 and effectively capping near-term volume growth regardless of underlying cold-chain freight demand levels.
| Restraint | (~) % Impact on CAGR Forecast | Geographic Relevance | Impact Timeline |
|---|---|---|---|
| Elevated fleet financing and leasing costs | -0.8% | Global, acute in emerging markets | Short term (2 years or less) |
| Upfront capital gap for battery-electric units | -0.6% | North America, Western Europe | Medium term (2 to 4 years) |
| Depot grid-connection queue refusals | -0.4% | United Kingdom, Netherlands, Germany, California | Medium term (2 to 4 years) |
| Import duties on compressors and cooling assemblies | -0.35% | North America, India, Brazil | Short term (2 years or less) |
| Freight-rate downcycle halting fleet renewal | -0.25% | North America, Europe | Short term (2 years or less) |
| Used-reefer inventory overhang | -0.2% | North America, Eastern Europe | Short term (2 years or less) |
Challenges
Servicing a modern TRU now requires three stacked competencies: refrigerant handling under EPA Section 608, diesel and inverter drivetrain diagnostics, and high-voltage battery work above 400 V. Bureau of Labor Statistics and national apprenticeship data show roughly 30% to 38% of the technician workforce within a decade of retirement, with annual intake covering well under half of separations. Mean repair time stretches from a target of 24 hours to 3 to 5 working days in secondary service areas, exposing operators to high-value perishable write-offs on every breakdown event.
Technician wage inflation runs at 6% to 9% annually, outpacing contract escalators typically set at 3%, and warranty accruals drift 40 to 80 basis points above plan in manufacturer annual reports. Vendors must invest USD 12,000 to USD 20,000 per technician to fund multi-year certification academies and must shift 15% to 25% of diagnostic work to remote telematics triage. This creates a scalable remote-service revenue stream for vendors who build telematics infrastructure early, since scarce field labour dispatched only on confirmed hardware faults lowers per-incident cost significantly.
| Challenge | (~) % CAGR Friction Drag | Geographic Relevance | Mitigation Horizon |
|---|---|---|---|
| Certified reefer technician deficit | -0.45% | Global | Long term (4 years or more) |
| Compressor and semiconductor lead-time volatility | -0.35% | Global | Medium term (2 to 4 years) |
| Battery derating in extreme heat | -0.25% | Gulf states, South Asia, Sub-Saharan Africa | Medium term (2 to 4 years) |
| Fragmented cross-border compliance auditing | -0.2% | Europe, ASEAN corridors | Medium term (2 to 4 years) |
| Sparse aftermarket parts networks | -0.15% | Africa, Latin America, Central Asia | Long term (4 years or more) |
| Battery residual-value uncertainty | -0.1% | Global | Long term (4 years or more) |
Opportunities
Cooling-as-a-service remains largely untapped, with sold-hour and sold-degree contracting confined to pilot fleets. Bundled availability contracts covering the unit, refrigerant, preventive maintenance, telematics, and uptime guarantees carry service gross margins in the 40% to 55% range versus high-teens hardware margins. Shifting even a fifth of installed units onto multi-year agreements at 10% to 15% of unit value annually lifts blended margin by an estimated 350 to 600 basis points and converts IFRS 16 balance-sheet purchases into operating expenses of roughly USD 0.9 to USD 1.6 per refrigerated operating hour.
Cryogenic and CO2 platform technology licensing, retrofit shop roll-ups, and vaccine corridor development in Sub-Saharan Africa and ASEAN represent three additional growth vectors for early movers. First movers who couple electrified hardware with outcome-priced contracts can hold 3 to 5 points of price premium because switching costs migrate from the equipment to the data and service relationship. Vendors building residual-value underwriting for battery assets and remote-diagnostics layers that keep service cost-to-serve below 7% of contract value will capture this premium durably through the forecast period.
| Opportunity | (~) % Potential CAGR Upside | Geographic Relevance | Execution Window |
|---|---|---|---|
| Cooling-as-a-service subscription monetisation | +1.1% | Global, led by North America and Western Europe | Medium term (2 to 4 years) |
| Cryogenic and CO2 platform technology licensing | +0.8% | Europe, Japan, North America | Medium term (2 to 4 years) |
| Roll-up of independent retrofit and body-builder shops | +0.6% | North America, Southern and Eastern Europe | Medium term (2 to 4 years) |
| Vaccine and biologics corridors in underserved regions | +0.5% | Sub-Saharan Africa, ASEAN, South Asia | Long term (4 years or more) |
| Solar-assisted multi-drop van cooling | +0.4% | Middle East, India, Australia, Southern Europe | Long term (4 years or more) |
| Refrigerant reclamation and offset monetisation | +0.3% | European Union, Japan, Canada | Long term (4 years or more) |
Key Company Insights
Thermo King holds the clearest technology leadership position in the electric TRU segment, supported by independently verified data. The T-690 delivers up to 30% faster pull-down, up to 35% lower fuel consumption, and up to 25% less engine runtime than competing equipment. Switching to SmartPower electric standby can reduce refrigeration fuel costs by up to 75%. A diesel TRU running 2,000 hours annually consumes more than 35,000 litres of fuel over a 7-year life. In November 2025, Thermo King commercially launched its E-Volution electric TRU range at Solutrans 2025, with an independently conducted life-cycle assessment confirming up to 45% CO₂ reduction versus diesel units.
Carrier Transicold competes directly through a semi-electric product strategy designed to bridge operator hesitancy on full electrification. Its February 2025 Vector S 15 launch targets medium- and heavy-duty truck operators with up to 20% fuel consumption reduction while maintaining diesel-equivalent refrigeration performance. This approach addresses the capital-gap restraint by offering measurable operating cost savings without requiring depot charging infrastructure, positioning Carrier Transicold favorably with fleet operators blocked by grid-connection queue delays in key markets including the UK, Netherlands, Germany, and California.
Key Players
- Thermo King
- Carrier Transicold
- Daikin Industries, Ltd.
- DENSO Corporation
- Mitsubishi Heavy Industries Thermal Systems, Ltd.
- Zanotti S.p.A.
- Webasto SE
- FRIGOBLOCK GmbH
- Hwasung Thermo Co., Ltd.
- Dongin Thermo Co., Ltd.
- Zhengzhou Guchen Thermo Co., Ltd.
- Kingtec Group
- Subros Limited
- Advanced Temperature Control
- Hubbard Products Ltd.
Recent Developments
- February 2025: Carrier Transicold introduced the Vector S 15, a semi-electric truck refrigeration unit designed to reduce fuel consumption by up to 20% while delivering diesel-equivalent refrigeration performance for medium- and heavy-duty trucks.
- May 2025: Thermo King showcased its latest electrified Commercial Vehicle transport refrigeration units and connected telematics technologies at ACT Expo 2025, highlighting commercial deployment of next-generation electric TRU solutions for temperature-controlled transport fleets.
- February 2026: Thermo King acquired CSTK, one of its largest dealership networks in North America, strengthening sales, aftermarket service, and maintenance capabilities for transport refrigeration customers across the Central and Northeastern United States.
Geopolitical Impact Analysis
Trade policy shifts are raising input costs across the TRU supply chain. According to WTO tariff data, import duties on compressors and cooling assemblies in North America, India, and Brazil are running at levels that add an estimated 5% to 12% to landed component costs for manufacturers sourcing from Asia-Pacific. The World Shipping Council reports average container shipping rates on trans-Pacific routes remain elevated relative to pre-2020 baselines, extending lead times on compressor and semiconductor deliveries by 4 to 8 weeks. This combination of tariff exposure and logistics delay is compressing manufacturer gross margins and forcing multi-source procurement strategies that increase unit bill-of-materials costs.
Energy price volatility driven by ongoing geopolitical tensions in Eastern Europe and the Middle East is directly affecting the operating economics of diesel TRUs, which still hold a 72.60% propulsion share in this market. According to IEA oil market data, diesel price volatility has increased the financial case for electric and solar-assisted TRU systems in markets where fuel represents 30% to 40% of refrigerated fleet operating costs. As reported by UNCTAD, supply chain rerouting away from conflict-adjacent corridors has added an average of 2 to 3 transit days to European cross-border refrigerated freight routes, increasing cold-chain duration requirements and raising the technical specification bar for TRU systems operating on extended delivery cycles.
Report Scope
| Report Features | Description |
|---|---|
| Market Value (2025) | USD 8.5 Billion |
| Forecast Revenue (2035) | USD 13.8 Billion |
| CAGR (2026-2035) | 5.00% |
| Base Year for Estimation | 2025 |
| Historic Period | 2020-2024 |
| Forecast Period | 2026-2035 |
| Report Coverage | Revenue Forecast, Market Dynamics, Market Opportunity Analysis, Technology and Innovation Landscape, Competitive Landscape, Recent Developments |
| Segments Covered | By System Type and Propulsion (Diesel-engine TRUs, Electric TRUs (eTRUs), Hybrid TRUs, Cryogenic Systems), By Vehicle Type (Heavy Commercial Vehicles, Medium Commercial Vehicles, Light Commercial Vehicles), By Mount Location (Front-mount / Nose-mount, Roof-mount, Under-mount), By End-User Industry (Food and Beverage Logistics, Pharmaceutical and Healthcare, Chemicals and Floriculture) |
| Regional Analysis | North America (US and Canada), Europe (Germany, France, The UK, Spain, Italy, and Rest of Europe), Asia Pacific (China, Japan, South Korea, India, Australia, and Rest of APAC), Latin America (Brazil, Mexico, and Rest of Latin America), Middle East and Africa (GCC, South Africa, and Rest of MEA) |
| Competitive Landscape | Thermo King, Carrier Transicold, Daikin Industries Ltd., DENSO Corporation, Mitsubishi Heavy Industries Thermal Systems Ltd., Zanotti S.p.A., Webasto SE, FRIGOBLOCK GmbH, Hwasung Thermo Co. Ltd., Dongin Thermo Co. Ltd., Zhengzhou Guchen Thermo Co. Ltd., Kingtec Group, Subros Limited, Advanced Temperature Control, Hubbard Products Ltd. |
| Customization Scope | Customization for segments, region / country-level will be provided. Additional customization can be done based on requirements. |
| Purchase Options | We have three licenses to opt for: Single User License | Multi-User License (Up to 5 Users) | Corporate Use License (Unlimited User and Printable PDF) |





































