Report Overview
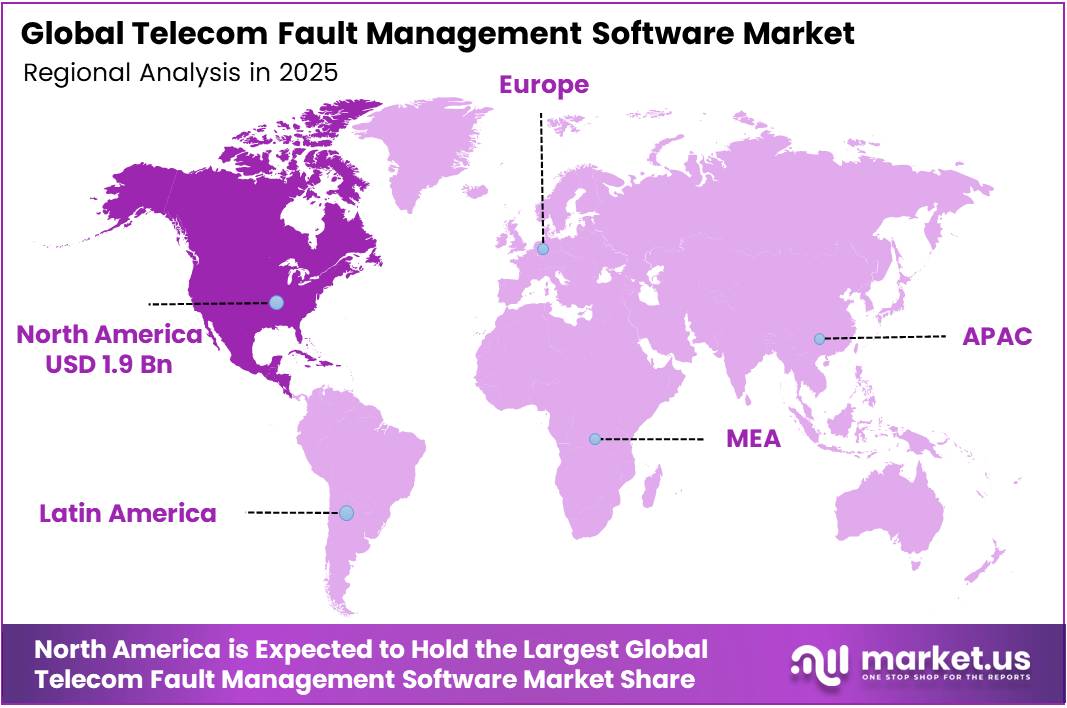
In 2025, the Global Telecom Fault Management Software Market was valued at USD 5.5 billion. The market is projected to grow at a CAGR of 10.5% during 2026–2035, reaching approximately USD 14.8 billion by 2035. North America dominated the global market in 2025, accounting for more than 34.0% of the total market share and generating approximately USD 1.9 billion in revenue.
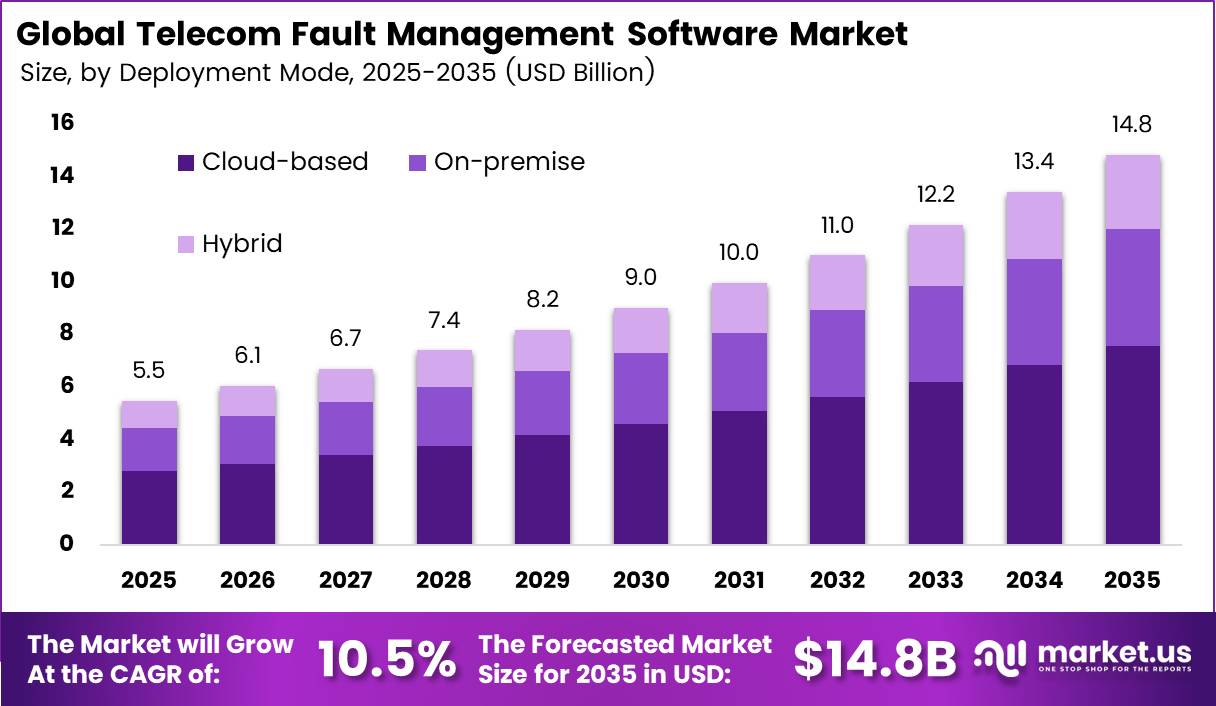
Network investment drives this growth. The GSMA says operators will spend $1.2 trillion on capital expenditure between 2025 and 2030, and 57% of all mobile connections will run on 5G by 2030. Each new 5G site, core function, and cloud layer creates more alarms that operators must sort, link, and fix. The GSMA also reports that mobile services generated $7.6 trillion, or 6.4% of world GDP, in 2025.
That figure should rise to $11.3 trillion by 2030. With so much economic value riding on uptime, operators treat fault detection and fast repair as a revenue shield, not a cost line. Vendor results show the same trend. Nokia grew Network Infrastructure sales by 23% to EUR 7,986 million in 2025.
The North America region holds large carrier software budgets and mature assurance buyers. Amdocs earned $4.53 billion in fiscal 2025, and record managed services revenue of $2.996 billion made up about 66% of that total. Amdocs also signed an eight-year aOS agreement with AT&T, its largest customer, in November 2026.
Key Takeaways
- The Telecom Fault Management Software Market stood at USD 5.5 billion in 2025 and should reach USD 14.8 billion by 2035. at a 10.5% CAGR from 2026 to 2035.
- Software Solutions leads the By Component segment with a 47.2% share.
- Alarm and Event Management leads the By Fault Management Function segment with a 25.8% share.
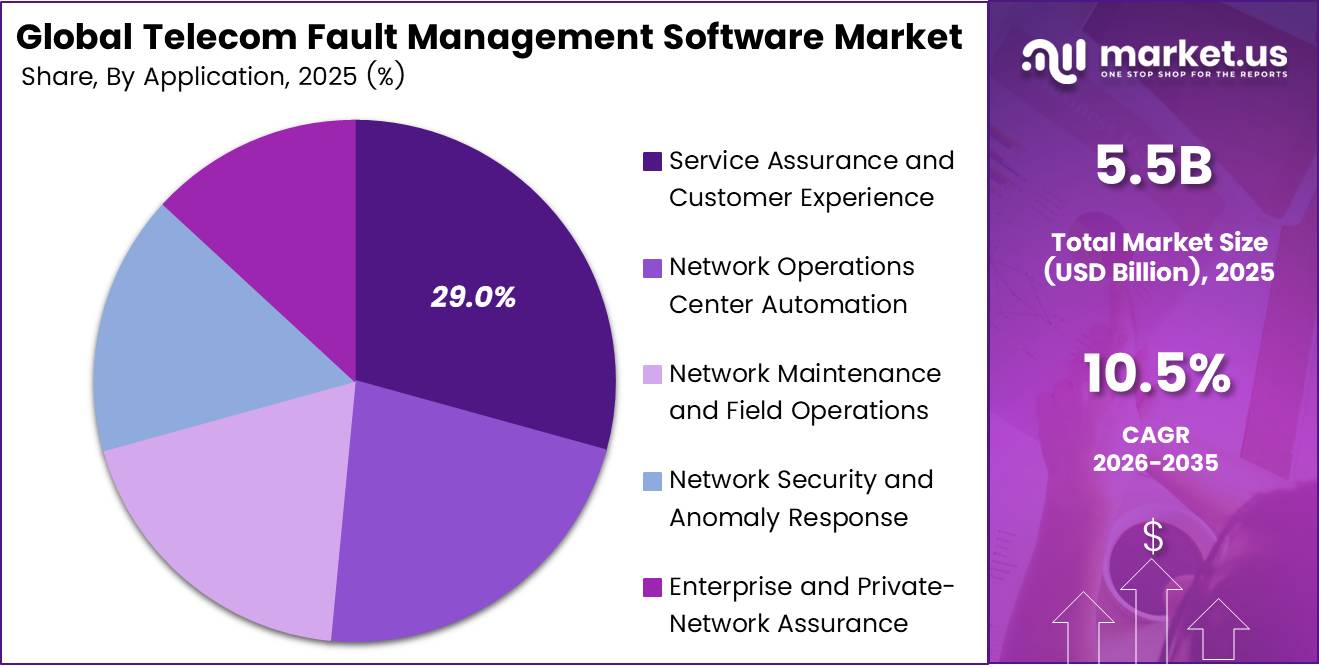
- Service Assurance and Customer Experience leads the By Application segment with a 29.0% share.
- On-premises leads the By Deployment Mode segment with a 56.3% share.
- Large Enterprises lead the By Enterprise Size segment with an 81.0% share.
- North America leads with a 34.0% share and USD 1.9 billion in revenue.
By Component
Software Solutions dominates with 47.2% due to core alarm platforms anchoring operator networks.
Software Solutions lead because operators buy fault platforms before they buy probes or services. Mobile operators spent about $1.3 trillion on capex between 2019 and 2025, and more than 75% of that went to 5G. Every new 5G site creates new alarms, so operators need software that collects, filters, and shows faults on one screen.
Managed Services grow fastest because operators now want to cut costs after heavy build-outs. Asia Pacific operators invested nearly $220 billion in networks from 2019 to 2024. Their capital intensity peaked at 25% in 2023 and then eased. With tighter budgets, many operators hand daily fault monitoring to vendors under multi-year contracts. They pay a fixed fee, close skill gaps, and move their staff to new 5G services.
By Fault Management Function
Alarm and Event Management dominates with 25.8% due to first-line visibility across all network layers.
Alarm and Event Management holds the top spot because every fault process starts with an alarm. Ericsson expects 2.9 billion 5G subscriptions by the end of 2025, or about one-third of all mobile subscriptions. Each subscriber depends on radios, core functions, and transport gear that send event signals all the time.
Automated Remediation and Closed-Loop Control grows fastest because alarm volumes now outpace human teams. Operators added 162 million 5G subscriptions in the third quarter of 2025 alone, which pushes event counts higher every month. Closed-loop systems find a fault, trace its cause, and apply a fix without waiting for an engineer.
By Application
Service Assurance and Customer Experience dominates with 29.0% due to subscriber churn risk from service outages.
Service Assurance and Customer Experience leads because operators earn money only when users stay connected. ITU estimates that about 6 billion people, or 74% of the world, used the internet in 2025. With this many users online, even a short outage hurts revenue, brand trust, and regulatory scores at the same time.
Enterprise and Private-Network Assurance grows fastest as businesses build their own networks for factories, ports, and campuses. ITU data also shows that 2.2 billion people remain offline, and growth in internet users slowed to 3.3% a year. As consumer growth slows, operators look to enterprise clients for new revenue.
By Deployment Mode
On-premises dominates with 56.3% due to strict data control and legacy integration.
On-premises deployment leads because large operators run fault systems close to their core networks. Many of these tools sit in national data centers that operators built over decades, and they connect to older OSS platforms. Data location and network security rules also push operators to keep critical fault data in-house.
In high-income countries, 5G already reaches 84% of people. Operators there protect these mature networks with proven in-house systems. Switching costs stay high, so many operators keep their on-premises setups.
Cloud deployment grows fastest because 5G networks now spread far beyond city centers. ITU reports that 5G covers 55% of the world’s population, but it reaches only 40% of rural residents, compared with 66% in urban areas.
As operators fill these gaps, they need fault-tolerant tools that scale fast without new server rooms. Cloud platforms offer pay-as-you-go pricing, quick updates, and built-in AI. In low-income markets, where 5G reaches just 4% of people, operators can launch cloud tools with little upfront cost.
By Enterprise Size
Large Enterprises dominate with 81.0% due to vast multi-vendor networks needing constant monitoring.
Large Enterprises hold most of the market because tier-one carriers run huge networks with gear from many vendors. In 2025, 5G subscription penetration reached 79% in North America and 60% in Northeast Asia, and large carriers serve most of these users.
Small and Medium-sized Enterprises grow fastest as low-cost cloud tools open the market to them. ITU counts just 20 fixed broadband subscriptions per 100 people worldwide, against 39 per 100 in high-income economies. That gap leaves room for regional ISPs and small carriers to grow. These firms often lack big IT teams, so they pick simple subscription tools with ready-made dashboards.
Key Market Segments
By Component
- Software Solutions
- Hardware and Probe Infrastructure
- Professional Services
- Managed Services
By Fault Management Function
- Alarm and Event Management
- Fault Detection and Localization
- Fault Correlation and Root-Cause Analysis
- Predictive Fault Management
- Incident, Ticket, and Workflow Management
- Automated Remediation and Closed-Loop Control
By Application
- Service Assurance and Customer Experience
- Network Operations Center Automation
- Network Maintenance and Field Operations
- Network Security and Anomaly Response
- Enterprise and Private-Network Assurance
By Deployment Mode
- On-premise
- Cloud
- Hybrid
By Enterprise Size
- Large Enterprises
- Small and Medium-sized Enterprises
Geopolitical Impact Analysis
Trade policy shocks hit the hardware side of fault management first. Probes, servers, and optical test gear cross borders many times before deployment. The WTO cut its 2025 goods trade forecast to -0.2% in April 2025 after new US tariffs. It warned that reciprocal tariffs could remove another 0.6 percentage points of growth.
North America felt the sharpest swing. The WTO expected the region’s exports to fall 12.6% and its imports to drop 9.6% in 2025. Buyers rushed orders ahead of tariffs, and US imports rose 11% in volume in the first half of 2025. Probe vendors and operators pulled forward hardware buys, then faced slower orders as stock ran down.
Shipping routes added delay and cost. UNCTAD found that container tonnage through the Suez Canal fell 82% by February 2024, while tonnage around the Cape of Good Hope rose 60%. An India-to-Europe round trip can stretch from 56 days to 63 days. That adds about 7 days of transit for servers and network appliances moving from Asian factories to European operators.
AI hardware demand now competes for the same parts. The WTO raised its 2025 trade growth forecast to 2.4% because of AI-related goods, but it expects growth to slow to 0.5% in 2026. Higher input prices push operators toward cloud and managed fault software, which cuts their exposure to imported hardware.
Regional Analysis
North America dominates the Telecom Fault Management Software Market, holding a 34.0% share and generating USD 1.9 billion in revenue. The region hosts many of the vendors that shape fault tools for carriers. Hewlett Packard Enterprise closed its $14 billion purchase of Juniper Networks in July 2025, and the deal doubled the size of its networking business.
HPE posted revenue of $12.2 billion in the quarter that ended July 2026, up 33.7% from a year earlier. IBM completed its $6.4 billion HashiCorp purchase in February 2025, adding hybrid cloud automation that supports closed-loop repair. NETSCOUT shows the pressure carriers face. Its cybersecurity line grew nearly 7% in fiscal 2025, while US service provider spending stayed soft as carriers balanced 5G cost against monetization.
Asia Pacific is the fastest-growing region in the Telecom Fault Management Software Market. The GSMA expects 5G to reach 50% of the region’s mobile connections by 2030. Australia, Japan, Singapore, and South Korea are already near mass-market 5G use. China and India add huge subscriber bases and new cloud core networks, and each one creates large alarm volumes.
Europe holds a strong position thanks to its home vendors. Nokia posted net sales of EUR 19,889 million in 2025, and Cloud and Network Services brought in EUR 2,606 million. Ericsson reported sales of SEK 236.7 billion, with organic growth of 2%. Germany, France, the UK, Spain, and Italy run dense multi-vendor networks that need strong cross-domain correlation.
Key Regions and Countries
North America
- US
- Canada
Europe
- Germany
- France
- The UK
- Spain
- Italy
- Rest of Europe
Asia Pacific
- China
- Japan
- South Korea
- India
- Australia
- Rest of APAC
Latin America
- Brazil
- Mexico
- Rest of Latin America
Middle East and Africa
- GCC
- South Africa
- Rest of MEA
Market Dynamics
Drivers
| Driver | (~) % Impact on CAGR Forecast | Geographic Relevance | Impact Timeline |
|---|---|---|---|
| 5G Standalone Core Densification | +2.4% | Global, led by Asia Pacific and North America | Short term (2 years or less) |
| AIOps-Based Alarm Correlation Adoption | +1.9% | North America, Europe | Short term (2 years or less) |
| Cloud-Native Network Function Migration | +1.6% | Global | Medium term (2 to 4 years) |
| Network Resilience Reporting Mandates | +1.1% | North America, Europe, India | Short term (2 years or less) |
| Fiber-to-the-Home Rollout Expansion | +0.9% | Europe, Asia Pacific, Latin America | Medium term (2 to 4 years) |
5G Standalone Core Densification
The move from non-standalone to standalone 5G cores multiplies the number of fault domains operators must watch. Per GSMA Intelligence tracking, more than 60 operators had launched commercial 5G SA networks by 2025. According to Ericsson Mobility Report data, global 5G subscriptions passed 2.3 billion in 2025.
Network slicing, containerized UPF instances and disaggregated RAN raise alarm volumes per site by roughly 3x to 5x compared with LTE-era topologies. Per TRAI and DoT filings in India, Jio and Airtel together deployed more than 450,000 5G base stations in under 24 months. This scale makes manual fault triage unworkable.
Buyers are moving from perpetual OSS licences to consumption-priced SaaS fault platforms metered by managed network function or alarm throughput. Nokia and Ericsson investor disclosures show managed-services and software mix gaining share inside flat radio revenue. That shift lowers upfront CapEx per operator by an estimated 25% to 35% and gives vendors recurring revenue with gross margins above 70%.
Restraints
| Restraint | (~) % Impact on CAGR Forecast | Geographic Relevance | Impact Timeline |
|---|---|---|---|
| Operator CapEx Contraction Cycle | -1.8% | Global, acute in Europe and North America | Short term (2 years or less) |
| High-Risk Vendor Exclusion Rules | -1.0% | Europe, North America, Australia | Short term (2 years or less) |
| Data Localization Restrictions | -0.7% | India, China, Middle East, Indonesia | Medium term (2 to 4 years) |
| Locked-In Legacy OSS Contracts | -0.6% | Europe, Japan | Medium term (2 to 4 years) |
| Elevated Cost of Capital | -0.5% | Emerging markets, Africa, Latin America | Short term (2 years or less) |
Operator CapEx Contraction Cycle
The cause is a gap between revenue and spending. After the 5G build-out peak, operators are earning low returns on their spectrum and radio investments. Per GSMA Intelligence data, global operator CapEx intensity fell from about 20% of revenue to 17% to 18% between 2024 and 2026.
Per the Dell’Oro-tracked earnings commentary of AT&T, Verizon, and Deutsche Telekom in their annual reports, multi-year CapEx guidance is flat to down 5% to 10%. According to ETNO annual economic reports, European telecom return on capital employed sits near 5% to 6%, below its weighted cost of capital.
Procurement teams have answered by stretching OSS refresh cycles from about 5 to 7 years and deferring new fault-management purchases. Vendor deal cycles now run 9 to 14 months, and discounts in competitive renewals are reaching 15% to 20%. Vendors exposed to hardware-tied assurance bundles face margin compression of 200 to 400 basis points.
Challenges
| Challenge | (~) % CAGR Friction Drag | Geographic Relevance | Mitigation Horizon |
|---|---|---|---|
| Multi-Vendor Integration Complexity | -1.2% | Global | Medium term (2 to 4 years) |
| Telecom AI Talent Shortage | -0.9% | North America, Europe, India | Long term (4 years or more) |
| Alarm Data Quality Gaps | -0.6% | Global | Medium term (2 to 4 years) |
| Rising OSS Cyberattack Exposure | -0.5% | North America, Europe, Asia Pacific | Short term (2 years or less) |
| AI Model Explainability Concerns | -0.3% | Europe | Medium term (2 to 4 years) |
Multi-Vendor Integration Complexity
Brownfield networks mix equipment from many generations and suppliers, each with its own alarm formats. Per TM Forum Open API conformance data, fewer than half of operator OSS stacks fully implement the standardized TMF642 Alarm Management API.
Per O-RAN Alliance interoperability plugfest reporting, multi-vendor RAN still needs custom adapters for roughly 30% to 40% of fault event types. In operator annual reports, integration and professional services often take up 40% to 50% of total fault-management project cost.
Deployment timelines stretch to 12 to 18 months. Vendors will need to invest in pre-built adapter libraries and conform to TM Forum and 3GPP SA5 standards. They will also need partner-led delivery models to bring services intensity below 25% of contract value.
Opportunities
| Opportunity | (~) % Potential CAGR Upside | Geographic Relevance | Execution Window |
|---|---|---|---|
| Autonomous Closed-Loop Self-Healing Networks | +1.7% | Global, led by Asia Pacific and Europe | Medium term (2 to 4 years) |
| Private 5G Enterprise Assurance | +1.2% | North America, Europe, Japan | Medium term (2 to 4 years) |
| Satellite-Terrestrial Hybrid Fault Management | +0.8% | Global, rural and maritime | Long term (4 years or more) |
| Tier-2 Operator SaaS Bundles | +0.7% | Africa, Southeast Asia, Latin America | Short term (2 years or less) |
| Assurance Platform M&A Roll-Ups | +0.5% | North America, Europe | Short term (2 years or less) |
Autonomous Closed-Loop Self-Healing Networks
This is still white space. Most of today’s AIOps spend goes to alarm correlation and root-cause suggestions, and a human still approves each fix. Per TM Forum autonomous networks benchmarking, most operators rate themselves at Level 2 to 3. China Mobile, NTT, and Telefónica have publicly targeted Level 4 autonomy by 2027 to 2030.
ETSI ZSM and 3GPP Release 18 intent-based management specifications set up the framework, but few operators have deployed them at scale. Operator investor disclosures cite potential network operations OpEx savings of 20% to 30% from automated remediation. Mean time to repair could fall by up to 50%.
Vendors that price on outcomes, such as per avoided outage minute or per automated ticket closure, could expand gross margins by 500 to 800 basis points. Cost per resolved incident could drop from double-digit dollar levels to under $2, opening a sizable share of untapped operations budget.
Key Players Analysis
Tier 1 leaders combine network equipment scale with operations software. Ericsson reported 2025 sales of SEK 236.7 billion and an adjusted EBITA margin of 18.1%, up from 11.0%. It ended the year with net cash of SEK 61.2 billion and proposed a SEK 15.0 billion share buyback.
Nokia earned EUR 19,889 million in 2025 and invested EUR 4,855 million in R&D. Its $2.3 billion Infinera deal added EUR 1,258 million to net sales. Cloud and Network Services grew 6% against a market that fell 2%.
Amdocs leads in operations software with fiscal 2025 revenue of $4.53 billion and a 12-month backlog of $4.19 billion. HPE spent $14 billion on Juniper, and IBM paid $6.4 billion for HashiCorp. Both deals deepen their AI-driven network automation.
Tier 2 challengers hold niche assurance roles. NETSCOUT earned $822.7 million in fiscal 2025, with product revenue of $359.9 million. VIAVI paid $425 million for Spirent test assets, which should add about $180 million in revenue in the first 12 months after closing. Comarch and Anritsu compete on regional and test-focused deals.
Top Key Players in the Market
- Telefonaktiebolaget LM Ericsson
- Nokia Corporation
- Huawei Technologies Co., Ltd.
- NEC Corporation
- Amdocs Ltd.
- NETSCOUT Systems, Inc.
- Broadcom Inc. (CA Technologies)
- Cisco Systems, Inc.
- Hewlett Packard Enterprise Development LP
- IBM Corporation
- Spirent Communications plc
- VIAVI Solutions Inc.
- Comarch SA
- Anritsu Corporation
Recent Developments
- In February 2025, IBM Corporation completed its acquisition of HashiCorp for $35 per share, an enterprise value of $6.4 billion, to build an end-to-end hybrid cloud automation platform.
- In February 2025, Nokia Corporation closed its acquisition of Infinera at an enterprise value of $2.3 billion, adding EUR 1,273 million in 2025 Network Infrastructure sales growth.
- In July 2025, Hewlett Packard Enterprise completed its $14 billion acquisition of Juniper Networks, which doubled its networking business and added the Mist AIOps platform.
- In October 2025, VIAVI Solutions Inc. completed its $425 million all-cash acquisition of Spirent’s high-speed Ethernet, network security, and channel emulation testing business from Keysight.
- In November 2026, Amdocs Ltd. acquired EIS for about $340 million in cash and signed an eight-year aOS agreement with AT&T to modernize operations.
Report Scope
| Report Features | Description |
|---|---|
| Market Value (2025) | USD 5.5 billion |
| Forecast Revenue (2035) | USD 14.8 billion |
| CAGR (2026-2035) | 10.5% |
| Base Year for Estimation | 2025 |
| Historic Period | 2020-2024 |
| Forecast Period | 2026-2035 |
| Report Coverage | Revenue Forecast, Market Dynamics, Competitive Landscape, Recent Developments |
| Segments Covered | By Component (Software Solutions, Hardware and Probe Infrastructure, Professional Services, Managed Services); By Fault Management Function (Alarm and Event Management, Fault Detection and Localization, Fault Correlation and Root-Cause Analysis, Predictive Fault Management, Incident, Ticket, and Workflow Management, Automated Remediation and Closed-Loop Control); By Application (Service Assurance and Customer Experience, Network Operations Center Automation, Network Maintenance and Field Operations, Network Security and Anomaly Response, Enterprise and Private-Network Assurance); By Deployment Mode (On-premise, Cloud, Hybrid); By Enterprise Size (Large Enterprises, Small and Medium-sized Enterprises) |
| Regional Analysis | North America – US, Canada; Europe – Germany, France, The UK, Spain, Italy, Rest of Europe; Asia Pacific – China, Japan, South Korea, India, Australia, Singapore, Rest of APAC; Latin America – Brazil, Mexico, Rest of Latin America; Middle East & Africa – GCC, South Africa, Rest of MEA |
| Competitive Landscape | Telefonaktiebolaget LM Ericsson, Nokia Corporation, Huawei Technologies Co., Ltd., NEC Corporation, Amdocs Ltd., NETSCOUT Systems, Inc., Broadcom Inc. (CA Technologies), Cisco Systems, Inc., Hewlett Packard Enterprise Development LP, IBM Corporation, Spirent Communications plc, VIAVI Solutions Inc., Comarch SA, Anritsu Corporation |
| Customization Scope | Customization for segments and region/country-level will be provided. Moreover, additional customization can be done based on the requirements. |
| Purchase Options | We have three licenses to opt for: Single User License, Multi-User License (Up to 5 Users), Corporate Use License (Unlimited Users and Printable PDF) |