Report Overview
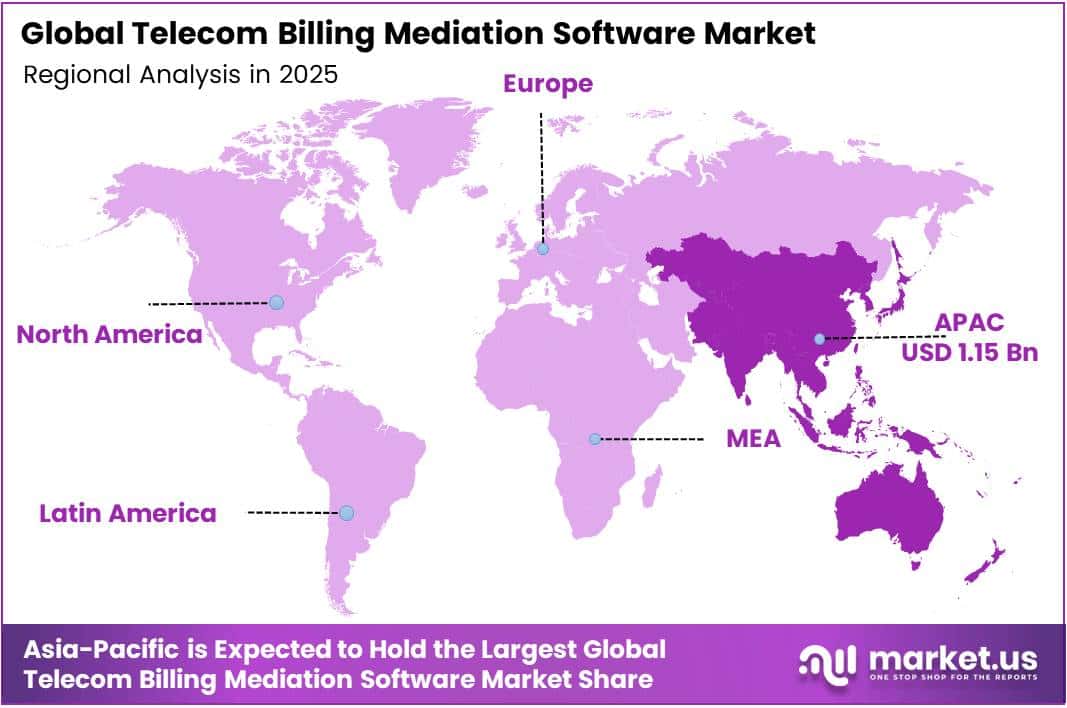
In 2025, the Global Telecom Billing Mediation Software Market was valued at USD 4.0 billion. The market is projected to grow at a CAGR of 7.8% during 2026–2035, reaching approximately USD 8.3 billion by 2035. Asia-Pacific dominated the global market in 2025, accounting for more than 28.8% of the total market share and generating approximately USD 1.15 billion in revenue.
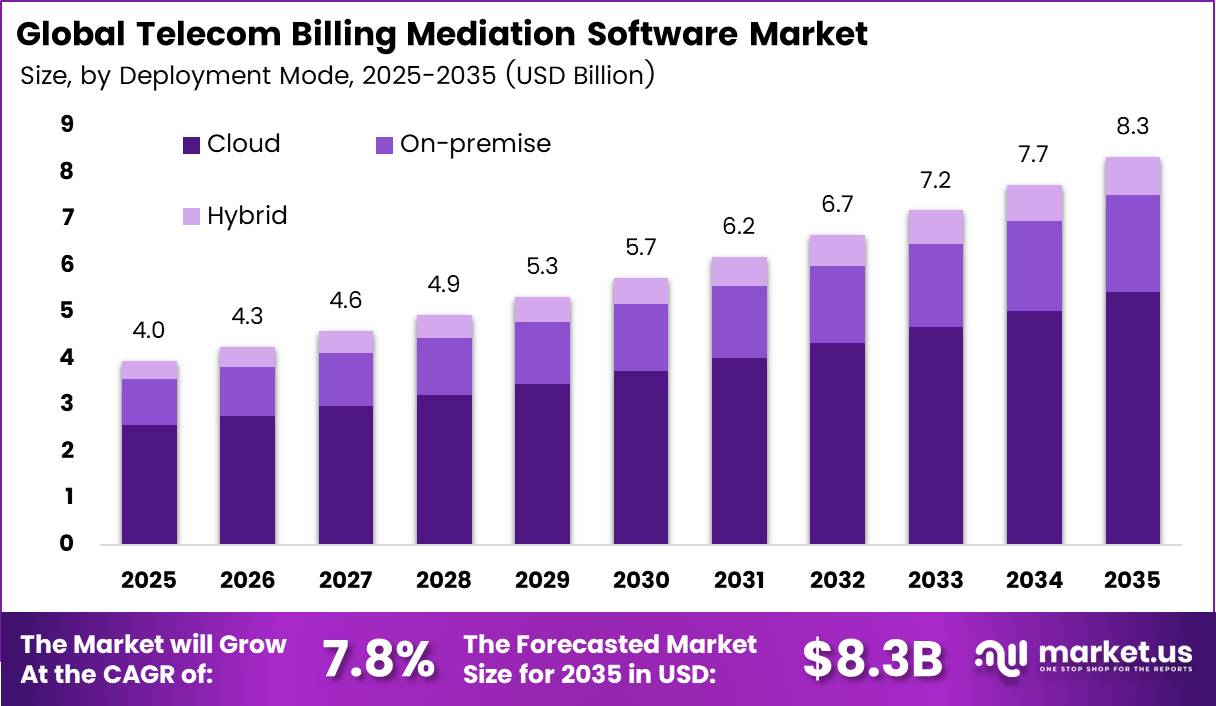
Network traffic keeps rising, and that drives this growth. Mediation software collects raw usage records from the network and turns them into data that billing systems can read. According to ITU, the world had 9.2 billion mobile cellular subscriptions in 2025, or 112 for every 100 people.
Mobile broadband now makes up 89% of all mobile subscriptions, up from under 50% in 2015. 5G already covers 36% of mobile broadband subscriptions, or around 3 billion users. Each 5G session creates more detailed usage records. Operators need faster, real-time mediation to rate data plans and bill for them correctly.
The Asia-Pacific region has the largest subscriber base in the world and some of the fastest 5G rollouts. ITU reports that more than 4 in 10 mobile broadband subscriptions in Asia-Pacific now run on 5G. Operators in China, Japan, South Korea, and India handle huge daily data volumes, so they buy mediation platforms that scale. ITU also notes that 5G reaches 55% of the world population.
Key Takeaways
- The Telecom Billing Mediation Software Market reached USD 4.0 billion in 2025 and will hit USD 8.3 billion by 2035. at a CAGR of 7.8% from 2026 to 2035.
- By Component, Software Solutions lead with a 65.1% share.
- By Deployment Mode, Cloud leads with a 65.5% share and is also the fastest-growing segment.
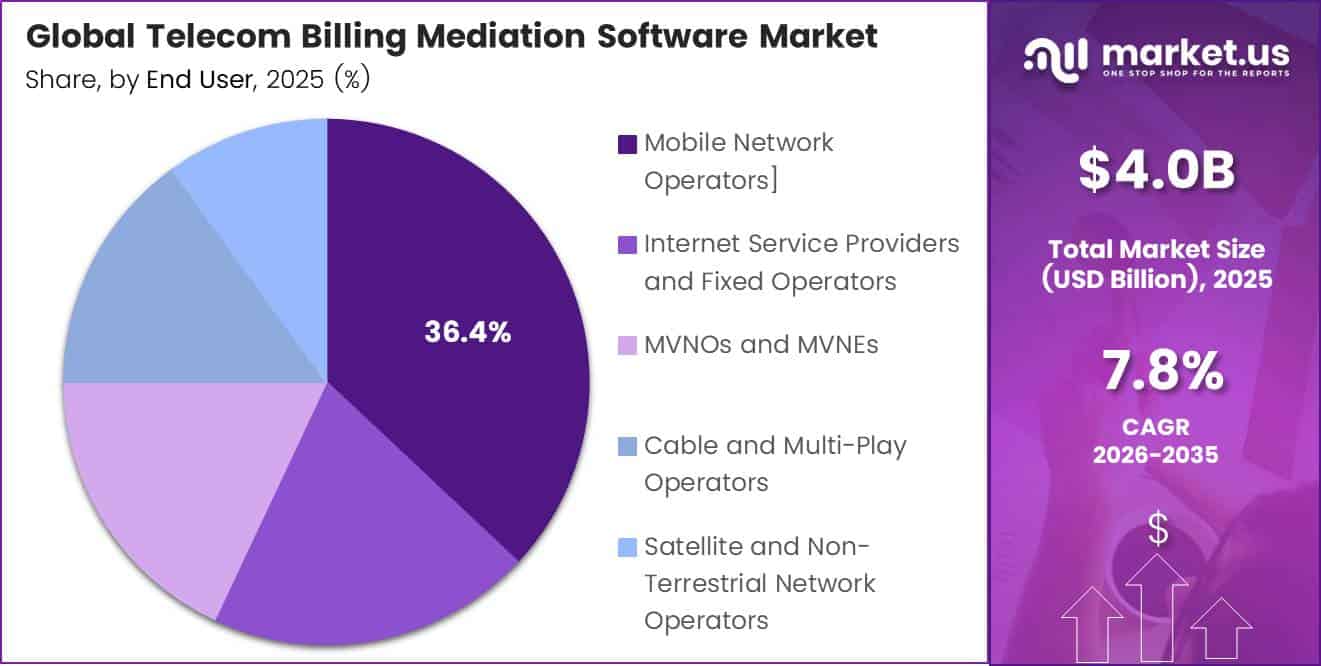
- By End User, Mobile Network Operators lead with a 36.4% share.
- Asia-Pacific leads with a 28.8% share and USD 1.15 billion in revenue.
By Component
Software Solutions dominate with 65.1% due to core usage record processing engine needs.
Software Solutions lead because every operator needs a core engine that collects, cleans, and routes raw usage records before any bill goes out. Buyers spend heavily on these platforms as they modernize old systems. Amdocs, a top billing vendor, reported revenue of $4.53 billion in fiscal 2025. It also said cloud-related work now makes up over 30% of its total revenue, after double-digit cloud growth for the fourth straight year.
Services grow fastest as operators hand daily system work to outside experts. Amdocs earned a record $2.996 billion from managed services in fiscal 2025, about 66% of its total revenue, with near-100% renewal rates. Long contracts like these give vendors steady income. They also show that operators trust partners to run complex mediation for 5G, fiber, and IoT traffic.
The shift keeps gaining speed. Amdocs grew managed services revenue from $2,905 million in FY2024 to $3,023 million in FY2026. Operators now use services to cut staff costs, close skill gaps, and launch new pricing plans faster. As networks grow more complex, more buyers will pair software licenses with ongoing support, integration, and upgrade contracts.
By Deployment Mode
Cloud dominates with 65.5% due to lower upfront infrastructure spending needs.
Cloud leads this segment because operators no longer want to buy and maintain costly in-house servers for mediation workloads. Pay-as-you-go models turn large capital costs into flexible monthly fees. Across the European Union, 52.74% of enterprises used paid cloud computing services in 2025, and that share reached 84.67% among large firms, the group that includes most telecom operators.
Cloud is also the fastest-growing mode, and the pace remains strong. The EU share of firms buying cloud services rose by 7.42 percentage points between 2023 and 2025. In addition, 40.89% of all EU enterprises bought at least one advanced cloud service, which Eurostat calls being highly dependent on the cloud.
Developer demand adds further fuel. Nearly 13.76% of EU firms bought cloud platforms to build, test, or deploy their own applications. Operators follow the same path to roll out new 5G and IoT billing rules quickly. On-premises and hybrid setups still serve buyers with strict data rules, but most new projects now start in the cloud.
By End User
Mobile Network Operators dominate with 36.4% due to massive daily mobile usage volumes.
Mobile Network Operators hold the largest share because they handle the biggest flow of calls, texts, and data sessions on Earth. The world had 9.2 billion mobile-cellular subscriptions in 2025, or 112 for every 100 people. Every one of these lines creates usage records that need mediation before rating and billing.
The move to 5G deepens this lead. Around 36% of all mobile broadband subscriptions are now 5G, and mobile broadband makes up 89% of all mobile subscriptions. New 5G plans, network slices, and data bundles force operators to process richer and more frequent records, so they keep investing in stronger mediation platforms.
Satellite and Non-Terrestrial Network Operators grow fastest as space-based links join mainstream telecom billing. Starlink reached 13.6 million consumer subscribers by the end of the third quarter of 2026. Its mobile service passed 22 million monthly users, up 37% in three months, all through partner carriers.
Key Market Segments
By Component
- Software Solutions
- Services
- Mobile Network Mediation, 2G, 3G, 4G, and 5G
- Fixed, Broadband, Fiber, and FTTx Mediation
- IMS, Voice, Messaging, and Unified Communications
- IoT, M2M, and Connected-Device Mediation
- Other
By Deployment Mode
- Cloud
- On-premise
- Hybrid
By End User
- Mobile Network Operators
- Internet Service Providers and Fixed Operators
- MVNOs and MVNEs
- Cable and Multi-Play Operators
- Satellite and Non-Terrestrial Network Operators
- Cloud Communications and Digital Service Providers
Geopolitical Impact Analysis
Trade policy shifts now shape the cost of the hardware that billing mediation software runs on. The WTO found that the share of world trade under most favoured nation terms fell from 80% in 2024 to about 72% by early 2026. New tariff actions drove this drop. Servers, storage, and network gear for on-premises mediation now carry less predictable import costs.
The Middle East conflict hit energy flows in 2026. The WTO reported that liquefied natural gas exports from the Middle East fell by 47% in the first half of the year, and crude exports dropped by nearly a quarter. Higher energy prices raise power costs for data centers that host mediation workloads. Vendors pass part of these costs into cloud hosting fees.
Shipping routes remain a weak point for network hardware. UNCTAD reported that weekly Suez Canal transits fell by 42% during the Red Sea crisis, and container ship transits dropped by 67% year on year. Longer routes around Africa delay deliveries of routers and servers, which slows mediation rollouts tied to new 5G sites.
AI demand offsets part of this pressure. The WTO reported that merchandise trade volume grew 4.6% in 2025, and it now expects 3.9% growth in 2026. AI-enabling goods made up 47% of trade growth in value terms in the first half of 2026. This keeps chip and server supply flowing, but at higher prices for telecom buyers.
Regional Analysis
Asia-Pacific dominates the Global Telecom Billing Mediation Software Market, holding a 28.8% share and generating USD 1.15 billion in revenue. The region leads because it has the largest pool of mobile users and the most active network expansion. China runs the biggest 5G network in the world, and its operators process billions of usage records each day.
The WTO expects Asia to post the fastest merchandise import growth of any region in 2026, at 3.3% under its baseline scenario. Strong imports of servers and network gear support new data centers that host cloud mediation platforms. Local operators also prefer cloud deployment to cut costs and launch new services faster.
North America is the fastest-growing region in the market. ITU reports that the Americas have 132 mobile broadband subscriptions per 100 people, the highest rate of any region. NEC bought US-based CSG, a firm with a strong telecom and broadband customer base in the US, for about USD 2.9 billion. Canada’s operators are also upgrading their charging systems for 5G standalone services.
Europe holds a steady position, driven by Germany, France, the UK, Spain, and Italy. The WTO expects European merchandise imports to grow just 1.3% in 2026, which points to careful spending. Even so, vendors still win large deals. Amdocs reported that Europe made up 15.6% of its fiscal 2025 revenue. It also signed a 10-year modernization deal with BT-EE in the UK.
Key Regions and Countries
North America
- US
- Canada
Europe
- Germany
- France
- The UK
- Spain
- Italy
- Rest of Europe
Asia Pacific
- China
- Japan
- South Korea
- India
- Australia
- Rest of APAC
Latin America
- Brazil
- Mexico
- Rest of Latin America
Middle East and Africa
- GCC
- South Africa
- Rest of MEA
Market Dynamics
Drivers
| Driver | (~) % Impact on CAGR Forecast | Geographic Relevance | Impact Timeline |
|---|---|---|---|
| 5G Standalone Core Rollouts and Converged Charging Function Integration | +1.6% | Global, led by Asia-Pacific and North America | Short term (2 years or less) |
| Cloud-Native BSS Migration and Containerized Mediation | +1.3% | North America, Europe, Middle East | Medium term (2 to 4 years) |
| Cellular IoT Connection Proliferation | +1.1% | China, India, Europe | Medium term (2 to 4 years) |
| Fixed Wireless Access Subscriber Expansion | +0.7% | North America, Gulf Cooperation Council, Nordics | Short term (2 years or less) |
| Revenue Assurance and Leakage Control Mandates | +0.5% | Africa, South Asia, Latin America | Short term (2 years or less) |
| Data Protection Rule Operationalization (Usage Record Traceability) | +0.4% | India, European Union | Short term (2 years or less) |
5G Standalone Core Rollouts and Converged Charging Function Integration
5G standalone cores replace legacy CDR streams with service-based charging records. Each record carries slice identifiers, tenant IDs, QoS parameters, and SLA metrics, which must be mediated with almost no delay, as set out in the 3GPP network-slice charging management specifications.
This shifts mediation from batch processing toward real-time event streaming that feeds the Charging Function, and it lifts the market’s growth by an estimated +1.6% above the 7.8% baseline. The milestones from 2024 to 2025 show the shift is already commercial.
Per Ookla network deployment tracking, Elisa sold an SA-enabled premium tier at an 18% price premium and Three Austria sold bandwidth-guaranteed home internet at a 23% premium. Deutsche Telekom bundled low-latency gaming access for €10, and GSA standalone tracking through November 2025 confirms fixed wireless access as the clearest SA revenue use case at scale.
Restraints
| Restraint | (~) % Impact on CAGR Forecast | Geographic Relevance | Impact Timeline |
|---|---|---|---|
| Operator CapEx Contraction and Flat ARPU | -1.2% | Europe, North America | Short term (2 years or less) |
| Procurement Freezes During Large-Scale BSS Migrations | -0.8% | Global | Short term (2 years or less) |
| Elevated Cost of Capital for Tier-2 and Tier-3 Operators | -0.6% | Africa, Latin America, South Asia | Medium term (2 to 4 years) |
| Vendor Exclusion Rules on High-Risk Suppliers | -0.4% | European Union, United States, United Kingdom | Medium term (2 to 4 years) |
| Bundling of Mediation Inside Core-Network Vendor Contracts | -0.3% | Global | Long term (4 years or more) |
Operator CapEx Contraction and Flat ARPU
Operators are spending less after the 5G build-out, and that directly freezes mediation purchases. GSMA Intelligence operator capital tracking shows global telecom CapEx falling for a second year in a row, as capital intensity moves back toward the low-to-mid teens as a percentage of revenue.
Earnings disclosures from large European and North American operators show annual budget cuts in the mid-single digits, a pullback this analysis puts at 5–8%. Inflation-adjusted mobile ARPU has been flat to negative across most OECD markets, according to OECD communications outlook data.
Discretionary BSS line items, including mediation upgrades, are the first to be deferred, which subtracts an estimated -1.2% from the baseline. In practice, this pushes mediation refresh cycles back by an estimated 12–18 months. Vendors face harder renewal pricing, with estimated discounts of 10–15% on support renewals in European tenders, as reflected in vendor annual report commentary.
Challenges
| Challenge | (~) % CAGR Friction Drag | Geographic Relevance | Mitigation Horizon |
|---|---|---|---|
| Legacy-to-Cloud Parallel Running Complexity | -0.9% | Global | Medium term (2 to 4 years) |
| Scarce Telecom BSS Engineering Talent | -0.6% | North America, Europe, India | Long term (4 years or more) |
| Fragmented Data Residency Compliance | -0.5% | India, European Union, Middle East | Medium term (2 to 4 years) |
| Multi-Protocol Record Translation Overhead | -0.4% | Global | Medium term (2 to 4 years) |
| Cybersecurity Exposure of Usage Pipelines | -0.3% | Global | Short term (2 years or less) |
Legacy-to-Cloud Parallel Running Complexity
Operators have to run legacy 2G, 3G, and 4G mediation alongside 5G service-based records during migration, which doubles their usage pipelines. Telenor Group operating disclosures show the scale involved: Telenor Pakistan moved 90 million subscribers onto a cloud-native charging and billing stack in 2025, which required long parallel-run and reconciliation phases.
Based on TM Forum transformation benchmarking, dual-stack operation typically adds an estimated 20–30% to mediation operating cost during cutover. Programmes of this kind commonly run 18–36 months, and the 3GPP Release 15 to 18 specification sequence keeps adding record formats that both stacks must handle.
This caps growth at an estimated -0.9% without stopping current sales. Over the long term, vendors need automated record-equivalence testing, phased migration in subscriber cohorts, and fixed-price migration contracts to protect delivery margins.
Opportunities
| Opportunity | (~) % Potential CAGR Upside | Geographic Relevance | Execution Window |
|---|---|---|---|
| Network API Exposure Monetization (Open Gateway Usage Mediation) | +1.4% | Global, led by Europe and Asia-Pacific | Medium term (2 to 4 years) |
| Mediation-as-a-Service for Tier-3 and MVNO Operators | +0.9% | Africa, Latin America, Southeast Asia | Short term (2 years or less) |
| AI-Driven Usage Anomaly and Fraud Analytics Layer | +0.7% | Global | Medium term (2 to 4 years) |
| Private 5G and Enterprise Campus Network Billing | +0.6% | Germany, Japan, United States, Middle East | Long term (4 years or more) |
| Non-Terrestrial Network and Satellite Roaming Settlement | +0.4% | Global, remote and maritime regions | Long term (4 years or more) |
Network API Exposure Monetization (Open Gateway Usage Mediation)
Network API exposure is still largely unexploited. The GSMA Open Gateway framework has standardized network APIs such as quality on demand, number verification, and SIM-swap checks. However, per GSMA programme updates.
If vendors package API usage mediation, they could add an estimated +1.4% above baseline. Margins on API mediation could reach an estimated 60–70%, compared with 35–45% for classic CDR mediation, in line with gross-margin profiles in Ericsson and Oracle annual filings.
Per-event pricing could also cut operators’ cost per settled transaction by an estimated 30–40% compared with manual reconciliation, consistent with TM Forum open API economics. Execution depends on operators aligning on ITU and 3GPP exposure standards, which leaves a medium-term window for whoever moves first.
Key Players Analysis
Tier 1 leaders include Amdocs, Ericsson, Nokia, Huawei, Oracle, and Netcracker. Amdocs posted revenue of USD 4.53 billion in fiscal 2025. Managed services brought in a record USD 3 billion, or 66% of revenue. Cloud work grew at a double-digit rate and passed 30% of revenue. Amdocs spent USD 166.1 million on R&D in the first half of fiscal 2025 and plans to invest more in GenAI in fiscal 2026.
Nokia posted net sales of EUR 19.89 billion in 2025 and spent EUR 4.86 billion on R&D. Its Network Infrastructure unit grew 23% to EUR 7.99 billion, helped by the Infinera deal, which cost EUR 2.5 billion. Ericsson posted fourth-quarter 2025 sales of SEK 69.3 billion and approved a USD 1.7 billion share buyback.
Netcracker grew much larger in 2026 when its parent, NEC, closed the USD 2.9 billion purchase of CSG. NEC paid USD 80.70 per share, a 17.38% premium. The deal values CSG at 10.3 times its expected 2026 adjusted EBITDA, and NEC expects it to lift its non-GAAP EPS by 7.7%.
Tier 2 challengers include SAP, Comarch, Optiva, Tecnotree, and Cerillion. These firms win deals with mid-sized operators, MVNOs, and regional carriers. They compete on fast setup, flexible pricing, and cloud-native BSS products.
Top Key Players in the Market
- Amdocs
- Telefonaktiebolaget LM Ericsson
- Oracle Corporation
- Huawei Technologies Co., Ltd.
- Netcracker Technology Corporation
- Nokia Corporation
- CSG Systems International, Inc.
- SAP SE
- Comarch S.A.
- Optiva Inc.
- Tecnotree Corporation
- Cerillion plc
Recent Developments
- In February 2025, Nokia Corporation completed its acquisition of Infinera for EUR 2.5 billion. The deal added EUR 1.26 billion to Nokia’s 2025 net sales.
- In October 2025, NEC Corporation agreed to buy CSG Systems International for USD 80.70 per share in cash, a total enterprise value of about USD 2.9 billion.
- In October 2025, NVIDIA agreed to invest USD 1 billion in Nokia Corporation at USD 6.01 per share for a 2.9% stake to speed up AI-RAN products.
- In January 2026, Telefonaktiebolaget LM Ericsson announced a USD 1.7 billion share buyback after posting fourth-quarter sales of SEK 69.3 billion.
Report Scope
| Report Features | Description |
|---|---|
| Market Value (2025) | USD 4.0 Billion |
| Forecast Revenue (2035) | USD 8.3 Billion |
| CAGR (2026-2035) | 7.8% |
| Base Year for Estimation | 2025 |
| Historic Period | 2020-2024 |
| Forecast Period | 2026-2035 |
| Report Coverage | Revenue Forecast, Market Dynamics, Competitive Landscape, Recent Developments |
| Segments Covered | By Component (Software Solutions, Services, Mobile Network Mediation, 2G, 3G, 4G, and 5G, Fixed, Broadband, Fiber, and FTTx Mediation, IMS, Voice, Messaging, and Unified Communications, IoT, M2M, and Connected-Device Mediation, Other); By Deployment Mode (Cloud, On-premise, Hybrid); By End User (Mobile Network Operators, Internet Service Providers and Fixed Operators, MVNOs and MVNEs, Cable and Multi-Play Operators, Satellite and Non-Terrestrial Network Operators, Cloud Communications and Digital Service Providers) |
| Regional Analysis | North America – US, Canada; Europe – Germany, France, The UK, Spain, Italy, Rest of Europe; Asia Pacific – China, Japan, South Korea, India, Australia, Singapore, Rest of APAC; Latin America – Brazil, Mexico, Rest of Latin America; Middle East & Africa – GCC, South Africa, Rest of MEA |
| Competitive Landscape | Amdocs, Telefonaktiebolaget LM Ericsson, Oracle Corporation, Huawei Technologies Co., Ltd., Netcracker Technology Corporation, Nokia Corporation, CSG Systems International, Inc., SAP SE, Comarch S.A., Optiva Inc., Tecnotree Corporation, Cerillion plc |
| Customization Scope | Customization for segments and region/country-level will be provided. Moreover, additional customization can be done based on the requirements. |
| Purchase Options | We have three licenses to opt for: Single User License, Multi-User License (Up to 5 Users), Corporate Use License (Unlimited Users and Printable PDF) |