


Report Overview
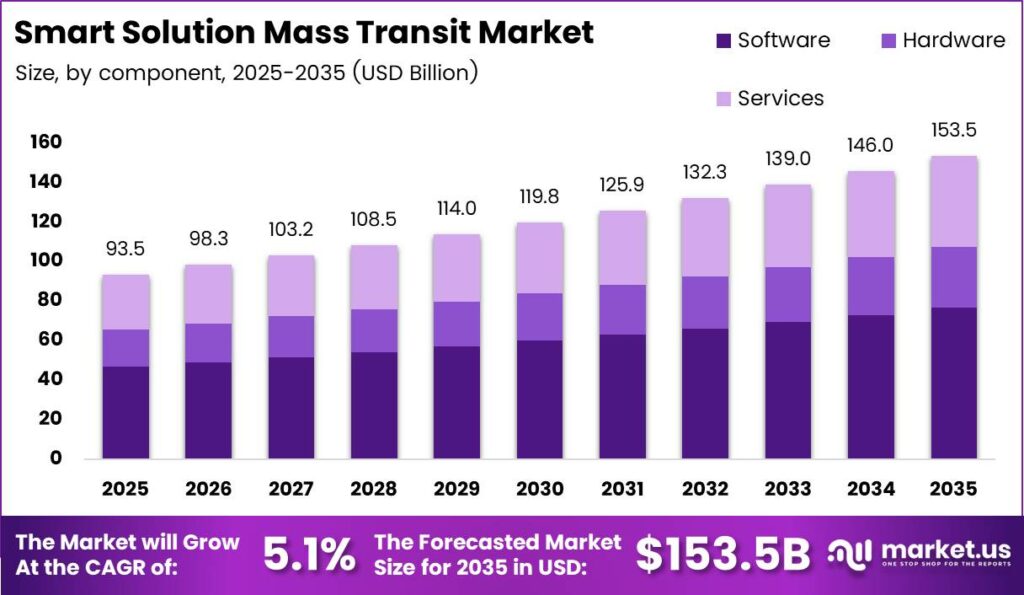
Global Smart Solution Mass Transit Market size is expected to be worth around USD 153.5 Billion by 2035 from USD 93.5 Billion in 2025, growing at a CAGR of 5.1% during the forecast period 2026 to 2035.
The Smart Solution Mass Transit Market encompasses the hardware, software, and managed-service systems that cities and transit operators deploy to automate fare collection, manage fleets, inform passengers in real time, and optimize network performance. The market spans bus, rail, metro, light rail, and ferry modes and serves public operators, private operators, and government agencies across all major geographies.
Key Takeaways
- The global Smart Solution Mass Transit Market is valued at USD 93.5 Billion in 2025 and is forecast to reach USD 153.5 Billion by 2035 at a CAGR of 5.1%.
- Software leads the Component segment with a 42.0% share, reflecting operator preference for analytics and platform-based revenue models.
- Automated fare-collection systems hold a 29.0% share in the Solution Type segment, driven by open-loop migration across metropolitan networks.
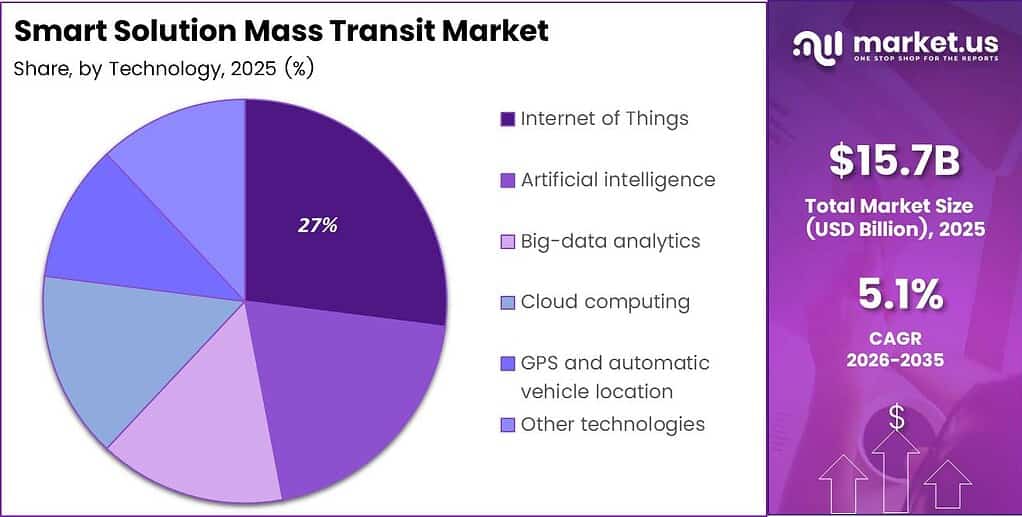
- Internet of Things technology leads the Technology segment with a 27.0% share, supported by rising connected-device penetration in transit infrastructure.
- Bus transit commands a 32.0% share in the Transit Mode segment, anchored by high fleet volumes and active electrification programs.
- On-premises deployment holds a 52.0% majority in the Deployment segment, driven by data sovereignty and security requirements in public-sector contracts.
- Public transport operators lead the End User segment with a 47.0% share, reflecting their dominant purchasing role in transit technology contracts.
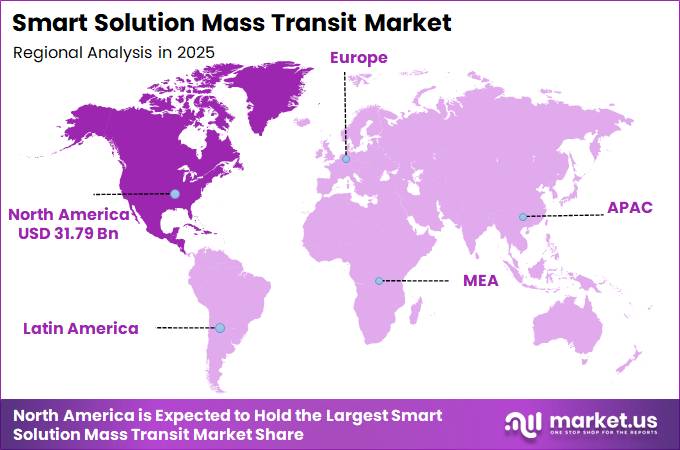
- North America is the dominant region with a 34.0% share, valued at USD 31.79 Billion in 2025.
As per our research, worldwide transport emissions reached 8.4 gigatonnes of carbon-dioxide equivalent in 2024, with road transport contributing just over 6 gigatonnes. This emissions profile is forcing transit authorities to accelerate fleet modernization and attach digital control layers to new vehicle procurement. Vendors able to bundle fleet telematics with decarbonization reporting gain a structural advantage in public tender evaluations.
According to the World Bank, 4.7 billion people, about 58% of the global population, lived in urban areas in 2026. This urban concentration places direct pressure on transit networks to expand capacity without proportional increases in operating cost. Smart solution vendors that can demonstrate measurable throughput gains per dollar of deployment are best positioned to win multi-year platform contracts.
As per our research, a World Bank-backed Bangladesh program included approximately 400 zero-emission electric buses, signaling that emerging-market procurement is now reaching scale. This creates a replicable contracting model for vendors targeting South and Southeast Asia. On 31 May 2024, Hitachi Rail completed its €1.66 billion acquisition of Thales’ Ground Transportation Systems business, consolidating two significant technology portfolios and intensifying competitive pressure across the global rail signalling and passenger-information landscape.
Component Analysis
Software dominates with 42.0% due to operator demand for platform-based analytics revenue.
In 2025, Software held a dominant market position in the By Component segment of the Smart Solution Mass Transit Market, with a 42.0% share. Operators increasingly procure software as a recurring subscription rather than a one-time license, improving vendor revenue predictability. This shift rewards vendors with modular, API-connected platforms over those reliant on proprietary closed architectures.
Hardware forms the physical backbone of transit digitization, covering onboard computing, sensors, fare validators, and display units. Transit agencies in active fleet-renewal programs commit hardware budgets early in procurement cycles, giving established equipment vendors first-mover advantage before software integrators enter. This sequencing makes hardware a reliable early-cycle revenue indicator for the broader market.
Services cover system integration, maintenance, training, and managed operations across the full contract lifecycle. Long-term availability contracts are displacing one-time implementation fees, as operators seek predictable support costs alongside capital expenditure. Vendors that build service capability at scale can extract stronger margins than hardware-only or software-only competitors over a full contract term.
Solution Type Analysis
Automated fare-collection systems dominate with 29.0% due to open-loop migration across metro networks.
In 2025, Automated Fare-Collection Systems held a dominant market position in the By Solution Type segment of the Smart Solution Mass Transit Market, with a 29.0% share. Cities migrating from closed-loop transit cards to open-loop bank-card acceptance require full backend replacement, creating large, non-deferrable procurement events. This mandatory replacement dynamic insulates the sub-segment from budget deferral risk more than discretionary digital layers.
Real-time tracking systems give operators and passengers live visibility of vehicle positions and arrival predictions, directly reducing perceived wait times and improving ridership retention. As per our research, US fixed-route transit-bus ridership reached 317 million trips in June 2026, 13 million more than in June 2025. This ridership recovery makes the business case for real-time tracking investment easier to justify in operating budgets.
Passenger information systems deliver dynamic displays, audio announcements, and mobile alerts that connect riders to live service data across stations and vehicles. Integrated ticketing solutions unify multi-modal journeys under a single fare instrument, reducing friction for riders transferring between bus, rail, and metro services. On 2 February 2026, Kapsch TrafficCom introduced a connected-tolling platform processing transactions from two sources: 5G Network V2X and 5.9 GHz direct C-V2X, illustrating how next-generation connectivity is redefining the boundary between tolling and transit fare infrastructure. Other solutions, covering command-and-control and analytics dashboards, hold the remaining share collectively.
Technology Analysis
Internet of Things dominates with 27.0% due to its role in real-time fleet and asset monitoring.
In 2025, Internet of Things technology held a dominant market position in the By Technology segment of the Smart Solution Mass Transit Market, with a 27.0% share. According to GSMA data, active NB-IoT and LTE-M connections reached 1 billion worldwide at the end of 2025. This connected-device milestone means transit operators can instrument vehicles, stations, and fare points at a cost point that now supports mass deployment rather than pilot programs.
Artificial intelligence applications in transit span predictive maintenance scheduling, passenger-flow forecasting, and anomaly detection across fare and operational systems. Based on OECD data, big-data analysis and IoT were each used by approximately 25% of firms in a cross-country assessment, confirming that AI adoption in transit remains an early-majority rather than a universal standard. Vendors that can demonstrate measurable cost savings through AI-driven scheduling win faster procurement approvals from budget-constrained operators.
Big-data analytics platforms aggregate fare transaction records, vehicle telemetry, and passenger-movement data to generate network-optimization insights operators cannot produce manually. Cloud computing enables operators to scale analytics workloads without capital investment in on-premises server infrastructure. GPS and automatic vehicle location systems provide the positioning layer that underpins real-time tracking, driver management, and automated schedule-adherence reporting. As per our research, approximately 2.2 billion people remained offline worldwide in 2025, highlighting that cloud-dependent transit solutions face real connectivity gaps in emerging-market deployments. Other technologies hold the remaining share collectively.
Transit Mode Analysis
Bus transit dominates with 32.0% due to high fleet volumes and active electrification pipelines.
In 2025, Bus Transit held a dominant market position in the By Transit Mode segment of the Smart Solution Mass Transit Market, with a 32.0% share. Large urban bus fleets generate repeated procurement cycles for onboard telematics, passenger counting, and fare validation hardware. Electrification programs across India, North America, and Europe are attaching digital charging-control and fleet-management layers directly to new bus procurement, compounding the addressable technology spend per vehicle.
Rail transit covers intercity and commuter rail networks that require complex signalling, timetabling, and revenue-collection systems across high-volume corridors. According to Eurostat, EU rail passenger activity reached 443 billion passenger-kilometres in 2024, increasing 5.8% from 2023. This volume growth translates into direct capacity pressure on existing signalling and passenger-information infrastructure, accelerating upgrade procurement cycles across European rail operators.
Metro and subway systems serve the highest-density urban corridors and require fully integrated command, control, and communication architectures. As reported by Eurostat, EU passengers made 8.7 billion rail trips covering 444.5 billion passenger-kilometres in 2024, reflecting the scale of urban rail demand that metro system upgrades must accommodate. Light rail, tram, ferry transit, and other transit modes hold the remaining share collectively, with light rail gaining traction as cities invest in surface-level rapid transit alternatives to underground metro construction.
Deployment Analysis
On-premises deployment dominates with 52.0% due to data sovereignty and public-sector security mandates.
In 2025, On-Premises deployment held a dominant market position in the By Deployment segment of the Smart Solution Mass Transit Market, with a 52.0% share. Public transit contracts routinely mandate that operational and passenger data remain within national or municipal infrastructure, making cloud migration legally constrained in many jurisdictions. This regulatory floor preserves on-premises revenue for vendors even as cloud economics improve.
Cloud-based deployment is gaining ground among operators seeking to reduce capital expenditure on server hardware and accelerate software updates without manual on-site intervention. Data from Eurostat shows 52.7% of EU enterprises used paid cloud-computing services in 2025, up 7.4 percentage points from 2023. This enterprise-level cloud adoption trend is gradually shifting transit operator procurement committees toward hybrid architectures that keep operationally critical systems on-premises while moving analytics and reporting workloads to cloud platforms.
End User Analysis
Public transport operators dominate with 47.0% due to their role as primary transit technology contract holders.
In 2025, Public Transport Operators held a dominant market position in the By End User segment of the Smart Solution Mass Transit Market, with a 47.0% share. These operators control the largest and most complex transit networks and purchase integrated technology suites rather than point solutions. Their multi-year procurement cycles and standardized tendering processes create repeatable revenue opportunities for vendors with established compliance and integration credentials.
Private transport operators are expanding their role in markets where governments contract out bus and ferry services to third-party operators under performance-based agreements. This shift transfers technology purchasing decisions from public agencies to commercial operators with stronger cost-optimization incentives, creating demand for SaaS-based fleet management and analytics tools over capital-intensive hardware solutions. Government and municipal agencies and other end users hold the remaining share collectively, with agencies playing a key policy and funding role even when direct technology procurement sits with operators.
Key Market Segments
By Component
- Software
- Hardware
- Services
By Solution Type
- Integrated Ticketing Solutions
- Automated Fare-Collection Systems
- Real-Time Tracking Systems
- Passenger Information Systems
- Other Solutions
By Technology
- Internet of Things
- Artificial Intelligence
- Big-Data Analytics
- Cloud Computing
- GPS and Automatic Vehicle Location
- Other Technologies
By Transit Mode
- Bus Transit
- Rail Transit
- Metro and Subway Systems
- Light Rail and Tram Systems
- Ferry Transit
- Other Transit Modes
By Deployment
- On-Premises
- Cloud-Based
By End User
- Public Transport Operators
- Private Transport Operators
- Government and Municipal Agencies
- Other End Users
Regional Analysis
North America Dominates the Smart Solution Mass Transit Market with a Market Share of 34.0%, Valued at USD 31.79 Billion
North America commands a 34.0% share of the global market, equivalent to USD 31.79 billion in 2025. The United States made USD 20.5 billion of federal transit funding available in 2024, channeling capital toward fleet electrification, automated fare systems, and real-time passenger information across major metropolitan networks. This federal commitment creates a predictable pipeline for technology vendors operating in the region.
Asia Pacific represents the fastest-growing region, driven by large-scale metro construction, bus electrification programs, and government mandates for integrated digital transit platforms across China, India, and Southeast Asia. On 9 March 2026, Delhi Metro Line 7 and Line 8 extensions entered revenue service under Alstom’s wider €312 million, 312-car Phase IV program, demonstrating the scale and velocity of transit technology deployment across the region’s major urban corridors.
Latin America is accelerating transit digitization through major metro projects anchored by multilateral financing. Bogotá Metro Line 1 was projected to carry up to 600,000 passengers per day, while São Paulo Metro Line 4 carried more than 650,000 passengers on an average weekday after full operation. As per GSMA data, mobile technologies and services generated $600 billion in Latin America in 2025, equivalent to 8.6% of regional GDP, underpinning the digital infrastructure that connected transit solutions depend upon. On 1 June 2026, Alstom secured the first €69 million tranche of a €214 million Queensland digital-signalling framework contract, reflecting broader Asia Pacific momentum in rail digitization that is also influencing investment patterns across Latin American rail corridors.
The Middle East and Africa region is emerging as an active procurement market supported by international development financing. The World Bank approved $100 million in concessional financing for Dakar’s urban-mobility transformation in June 2025, signaling multilateral confidence in African transit infrastructure. As per GSMA data, mobile technologies contributed $240 billion to Africa’s economy in 2025, equivalent to 7.8% of GDP, reflecting a digital foundation that positions the region for accelerated smart transit adoption over the forecast period. Europe benefits from the European Union’s selection of 94 transport projects for nearly €2.8 billion in grants in 2025, with rail receiving 77% of that allocation and reinforcing the continent’s leadership in rail digitization investment.
Key Regions and Countries
North America
- US
- Canada
Europe
- Germany
- France
- The UK
- Spain
- Italy
- Rest of Europe
Asia Pacific
- China
- Japan
- South Korea
- India
- Australia
- Rest of APAC
Latin America
- Brazil
- Mexico
- Rest of Latin America
Middle East and Africa
- GCC
- South Africa
- Rest of MEA
Market Dynamics
Market Opportunity Analysis - Underserved transit modes and emerging-market corridors offer entry points for vendors ready to move beyond core metro markets
Bus transit holds the largest transit-mode share at 32.0%, yet the technology intensity per vehicle in emerging-market bus fleets remains low compared to European or North American counterparts. Vendors that offer modular, low-cost telematics and fare-validation packages sized for fleet operators in South Asia, Southeast Asia, and Sub-Saharan Africa can capture share in a segment where hardware procurement cycles are shorter and less encumbered by legacy system lock-in.
Cloud-based deployment currently holds the minority position in a market where on-premises solutions command a 52.0% majority. This gap reflects regulatory caution rather than operator preference in many cases. Vendors that develop compliant hybrid architectures, keeping operationally critical functions on-premises while migrating analytics to cloud, are positioned to convert existing on-premises clients into higher-margin hybrid contracts as data governance frameworks mature.
Private transport operators hold a minority end-user share but represent a faster procurement cycle compared to government agencies and public operators. As more governments shift service delivery to performance-based concession models, private operators gain technology purchasing authority and preference for SaaS tools with transparent cost-per-trip pricing. This means vendors that develop commercial pricing models oriented toward private operators can build recurring revenue ahead of anticipated concession expansion.
The Middle East and Africa region is the least penetrated major region by smart transit technology, yet multilateral financing is actively reducing the barrier to entry. The World Bank’s $100 million commitment to Dakar’s urban-mobility transformation signals that development-finance institutions are now a viable procurement pathway for regional market entry. Vendors experienced in multilateral-funded project structures can use these programs as anchor contracts to establish regional reference sites and support subsequent commercial bids.
Technology and Innovation Landscape - Connected infrastructure, AI-driven analytics, and open-standard data frameworks are redefining what transit technology vendors must deliver to remain competitive
IoT connectivity is transitioning from a pilot-stage capability to a deployment standard across transit networks. According to ITU data, 5G networks covered an estimated 55% of the global population in 2025, providing the high-bandwidth, low-latency backbone that real-time vehicle telemetry, remote diagnostics, and dynamic passenger-information systems require to perform at scale. Vendors that architect solutions for 5G network environments now avoid costly mid-contract infrastructure upgrades later.
Generative AI is entering the transit technology landscape through scheduling optimization, incident-response drafting, and passenger-communication tools. As reported by WIPO, published generative-AI patent families increased from 18,862 in 2024 to 37,808 in 2025, reflecting a near-doubling of competitive innovation intensity in a single year. Transit technology vendors that integrate generative AI into their platform roadmaps gain differentiation in competitive bids where operators are evaluating long-term software capability, not just current feature sets.
ITU-T Y.4611, published in November 2025, classifies smart-city infrastructure data into five types: sensing, networking, device-control, processed, and linkage-management data. This international standard gives transit operators and vendors a shared taxonomy for data architecture, interoperability contracts, and regulatory compliance. Vendors that align their platform data models to ITU-T Y.4611 categories reduce integration friction when connecting to third-party smart-city systems, opening cross-sell opportunities beyond the core transit technology scope.
Based on OECD data, AI and 3D-printing adoption ranged from approximately 4% to 10% among firms in a cross-country assessment, confirming that advanced manufacturing and AI deployment in transit-adjacent industries are still early-majority adoption stages. This signals that transit technology vendors supplying hardware components face near-term competitive stability but must invest in additive manufacturing capabilities now to protect cost positions as 3D-printing adoption scales and incumbent suppliers begin offering on-demand spare-part production as part of maintenance contracts.
Drivers
Ring-fenced fleet-modernization programs are the strongest active driver, contributing an estimated +0.9% to the 5.1% baseline CAGR. India’s PM E-DRIVE program, notified on September 29, 2024, supports 14,028 electric buses and 1,800 fast chargers, with 13,800 buses allocated and major tenders concluded by June 30, 2026. These programs attach fleet telematics, depot management, and passenger-information systems directly to vehicle procurement, shifting suppliers toward multi-year availability contracts and recurring analytics subscriptions.
The United States made US$20.5 billion of federal transit funding available in 2024, while the European Union selected 94 transport projects for nearly €2.8 billion in grants in 2025, with rail receiving 77% of that allocation. These funding commitments improve revenue visibility for vendors and lower customer acquisition costs across repeat depot deployments. Mandatory data interoperability, open-loop fare migration, real-time service optimization, and cloud-edge platform convergence each add further positive CAGR contributions of +0.7%, +0.5%, +0.4%, and +0.3% respectively.
Market Drivers
| Driver | (~) % Impact on CAGR Forecast | Geographic Relevance | Impact Timeline |
|---|---|---|---|
| Funded Fleet Decarbonization | +0.9% | Global; India, North America, Europe | Short term (≤ 2 years) |
| Mandatory Data Interoperability | +0.7% | Europe; advanced Asian metros | Short term (≤ 2 years) |
| Open-Loop Fare Migration | +0.5% | Global metropolitan networks | Medium term (2–4 years) |
| Real-Time Service Optimization | +0.4% | High-density urban corridors | Short term (≤ 2 years) |
| Cloud-Edge Platform Convergence | +0.3% | North America, Europe, East Asia | Medium term (2–4 years) |
Restraints
Persistent operating deficits are the largest immediate restraint, reducing the baseline CAGR by an estimated -0.7%. Passenger fares covered only 32% of United States transit operating expenses in 2024, while the national state-of-good-repair backlog exceeded US$105 billion. Transit authorities prioritize service frequency, payroll, and safety maintenance over discretionary digital upgrades, freezing otherwise viable fare-system and passenger-analytics purchases.
Legacy system lock-in, protracted public procurement cycles, data sovereignty restrictions, and uneven connectivity coverage add further negative CAGR impacts of -0.5%, -0.4%, -0.3%, and -0.2% respectively. These restraints extend approval cycles, force vendors to absorb bid-extension costs and milestone-payment delays, and compress project margins even where headline infrastructure grants remain available. Suppliers operating in affected markets must price implementation risk into fixed-cost proposals from the outset.
| Restraint | (~) % Impact on CAGR Forecast | Geographic Relevance | Impact Timeline |
|---|---|---|---|
| Unfunded Operating Deficits | -0.7% | North America, Europe, emerging cities | Short term (≤ 2 years) |
| Legacy System Lock-In | -0.5% | Mature metro and rail networks | Medium term (2–4 years) |
| Protracted Public Procurement | -0.4% | Global public-sector buyers | Short term (≤ 2 years) |
| Data Sovereignty Restrictions | -0.3% | Europe, China, Middle East, India | Medium term (2–4 years) |
| Uneven Connectivity Coverage | -0.2% | Emerging and rural transit corridors | Long term (≥ 4 years) |
Challenges
The integration of ticketing, mobile applications, vehicle telemetry, and operational-control interfaces creates a structural cybersecurity vulnerability across connected transit networks. Transport-sector ransomware rose from 13% of recorded attacks in 2021 to 25% in 2022, and ransomware represented 45% of identified railway attacks. European authorities subsequently identified transport as the second-most-targeted sector in the 2024 threat landscape, imposing an estimated -0.5% friction drag on attainable CAGR.
Suppliers are incorporating security operations, network segmentation, software bills of materials, continuous patching, and 24/7 monitoring into lifecycle delivery. An analyst allowance of roughly 4 to 7% of implementation expenditure for these controls can protect contract renewals but raises near-term delivery costs and requires permanent cybersecurity staffing. AI safety assurance, specialized talent scarcity, tunnel positioning limitations, and component lifecycle mismatch add further friction drags of -0.4%, -0.3%, -0.2%, and -0.2% respectively.
| Challenge | (~) % CAGR Friction Drag | Geographic Relevance | Mitigation Horizon |
|---|---|---|---|
| Expanding Cyberattack Surface | -0.5% | Global connected transit networks | Long term (≥ 4 years) |
| AI Safety Assurance | -0.4% | Europe; regulation-sensitive markets | Medium term (2–4 years) |
| Specialized Talent Scarcity | -0.3% | Global; acute in emerging markets | Long term (≥ 4 years) |
| Tunnel Positioning Limitations | -0.2% | Underground metro networks | Medium term (2–4 years) |
| Component Lifecycle Mismatch | -0.2% | Global rail and metro fleets | Long term (≥ 4 years) |
Opportunities
Outcome-based predictive maintenance represents the most quantifiable near-term opportunity, with potential to contribute up to +0.6% above the 5.1% baseline CAGR. Properly implemented predictive programs can save approximately 8 to 12% versus preventive maintenance, while London Underground has reported maintenance and renewal activity representing roughly 60% of its total budget. Converting conventional software licenses into availability-based contracts could expand service gross margins by an estimated 4 to 7 percentage points as reusable analytics models replace bespoke engineering per deployment.
Suppliers that retain an estimated 15 to 25% of verified savings under outcome-based contracts build a recurring revenue stream that compounds as more fleets are instrumented and asset data is standardized. Autonomous feeder services, peri-urban demand response, accessibility analytics, and guaranteed-journey products offer additional CAGR upside of +0.5%, +0.4%, +0.3%, and +0.2% respectively. Early movers that standardize data collection and contract structures across their first deployments will hold a durable cost advantage as these opportunity categories scale.
| Opportunity | (~) % Potential CAGR Upside | Geographic Relevance | Execution Window |
|---|---|---|---|
| Outcome-Based Predictive Maintenance | +0.6% | Global rail, metro and bus fleets | Medium term (2–4 years) |
| Autonomous Feeder Services | +0.5% | Europe, East Asia, North America | Long term (≥ 4 years) |
| Peri-Urban Demand Response | +0.4% | Emerging cities and suburban corridors | Medium term (2–4 years) |
| Accessibility Analytics Services | +0.3% | North America, Europe, ageing markets | Medium term (2–4 years) |
| Guaranteed-Journey Products | +0.2% | High-income multimodal cities | Long term (≥ 4 years) |
Key Company Insights
Siemens Mobility GmbH generated €12.444 billion in revenue, €16.994 billion in orders, and €1.099 billion in profit in fiscal 2025. This order-to-revenue ratio signals strong future backlog coverage and positions Siemens Mobility as a financially stable long-cycle supplier. On 16 July 2026, a Siemens Mobility and Stadler consortium received approval for a Berlin S-Bahn program covering 350 trains and a 30-year maintenance term, embedding the company in one of Europe’s most visible urban rail programs for three decades.
Alstom S.A. reported FY2025/26 sales of €19.171 billion and adjusted EBIT of €1.168 billion, with Americas order intake reaching €7.888 billion compared with €3.441 billion in FY2024/25. This more than doubling of Americas orders reflects successful geographic diversification across North and South America. On 21 May 2026, Conduent agreed to sell its Public Transit business to Modaxo for $164 million, and on 30 June 2026, Conduent agreed to sell its tolling business to Quarterhill for $70 million in cash plus a 7% interest in Quarterhill, signaling a sector-wide consolidation that reshapes the competitive landscape Alstom and Siemens operate within.
Key Players
- Siemens Mobility GmbH
- Alstom S.A.
- Thales Group
- Cubic Transportation Systems
- Conduent Transportation
- INIT Innovation in Traffic Systems SE
- Trapeze Group
- Indra Sistemas S.A.
- Hitachi Rail Limited
- Scheidt & Bachmann GmbH
- Masabi Ltd.
- Vix Technology
- Clever Devices Ltd.
- Kapsch TrafficCom AG
- Luminator Technology Group
Recent Developments
- 3 August 2026 – Alstom received a €270 million order for 25 additional X’trapolis 2.0 trains, increasing the Victorian fleet under manufacture to 50 trains.
- 30 July 2026 – Alstom placed the first of 100 Next Generation G Class trams into Melbourne passenger service under a €700 million contract.
- 20 March 2026 – Alstom signed an approximately €800 million five-year extension to operate and maintain GO Transit and UP Express fleets through 2031.
- 20 January 2026 – Alstom and Santiago Metro presented the first Line 7 train under three contracts that include 20 years of maintenance.
- 2 July 2026 – São Paulo Metro Line 6-Orange began commercial operation with an Alstom program covering 22 trains and approximately 5,000 jobs.
- 11 June 2026 – Alstom produced the 500th Omneo Régio2N train; 567 trains from the platform had been ordered.
- 5 June 2026 – The first of 10 new Elizabeth line Aventra trains rolled off Alstom’s Derby production line.
- 1 June 2026 – Alstom secured the first €69 million tranche of a €214 million Queensland digital-signalling framework contract.
Report Scope
| Report Features | Description |
|---|---|
| Market Value (2025) | USD 93.5 Billion |
| Forecast Revenue (2035) | USD 153.5 Billion |
| CAGR (2026-2035) | 5.1% |
| Base Year for Estimation | 2025 |
| Historic Period | 2020-2024 |
| Forecast Period | 2026-2035 |
| Report Coverage | Revenue Forecast, Market Dynamics, Market Opportunity Analysis, Technology and Innovation Landscape, Competitive Landscape, Recent Developments |
| Segments Covered | By Component (Software, Hardware, Services), By Solution Type (Integrated Ticketing Solutions, Automated Fare-Collection Systems, Real-Time Tracking Systems, Passenger Information Systems, Other Solutions), By Technology (Internet of Things, Artificial Intelligence, Big-Data Analytics, Cloud Computing, GPS and Automatic Vehicle Location, Other Technologies), By Transit Mode (Bus Transit, Rail Transit, Metro and Subway Systems, Light Rail and Tram Systems, Ferry Transit, Other Transit Modes), By Deployment (On-Premises, Cloud-Based), By End User (Public Transport Operators, Private Transport Operators, Government and Municipal Agencies, Other End Users) |
| Regional Analysis | North America (US and Canada), Europe (Germany, France, The UK, Spain, Italy, and Rest of Europe), Asia Pacific (China, Japan, South Korea, India, Australia, and Rest of APAC), Latin America (Brazil, Mexico, and Rest of Latin America), Middle East and Africa (GCC, South Africa, and Rest of MEA) |
| Competitive Landscape | Siemens Mobility GmbH, Alstom S.A., Thales Group, Cubic Transportation Systems, Conduent Transportation, INIT Innovation in Traffic Systems SE, Trapeze Group, Indra Sistemas S.A., Hitachi Rail Limited, Scheidt & Bachmann GmbH, Masabi Ltd., Vix Technology, Clever Devices Ltd., Kapsch TrafficCom AG, Luminator Technology Group |
| Customization Scope | Customization for segments, region/country-level will be provided. Additional customization can be done based on requirements. |
| Purchase Options | We have three licenses to opt for: Single User License, Multi-User License (Up to 5 Users), Corporate Use License (Unlimited User and Printable PDF) |





































