Service Topology Discovery Market By Component (Software, Services), By Deployment Mode (On-Premises, Cloud), By Application (Network Management, IT Operations, Security and Compliance, Others), By Organization Size (Large Enterprises, Small and Medium Enterprises), By End-User (BFSI, Healthcare, IT and Telecommunications, Retail, Manufacturing, Government, Others), By Regional Analysis, Global Trends and Opportunity, Future Outlook By 2026-2035
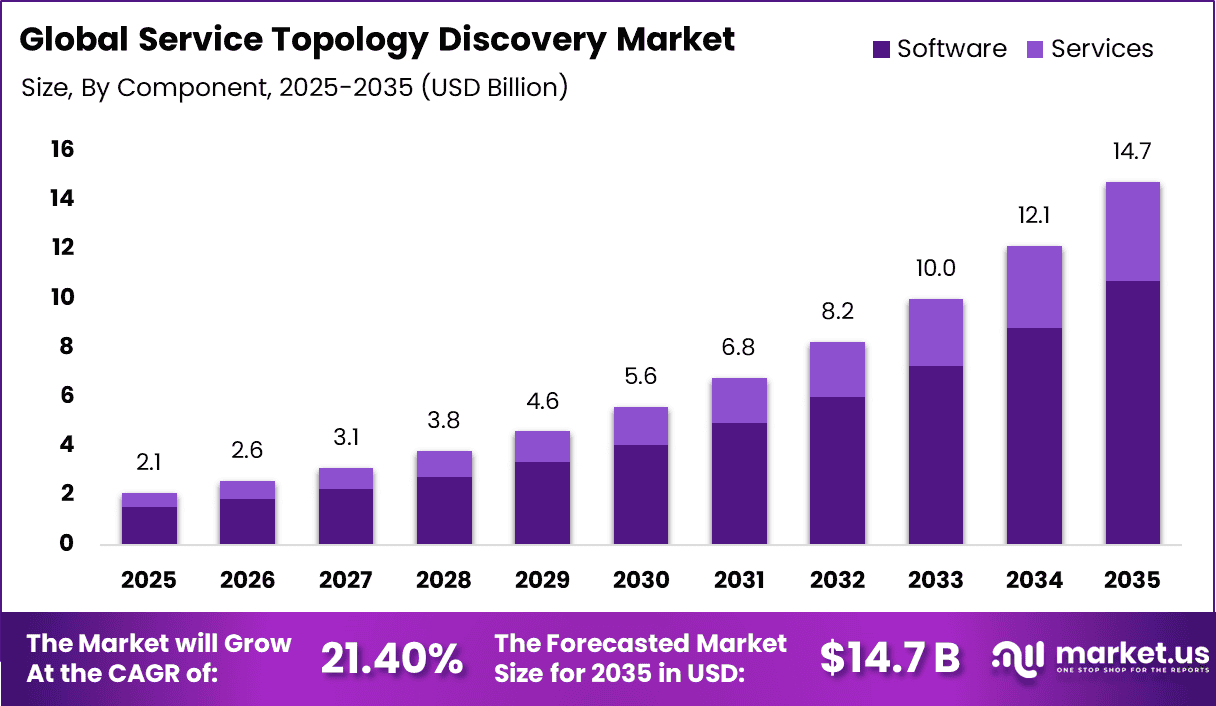
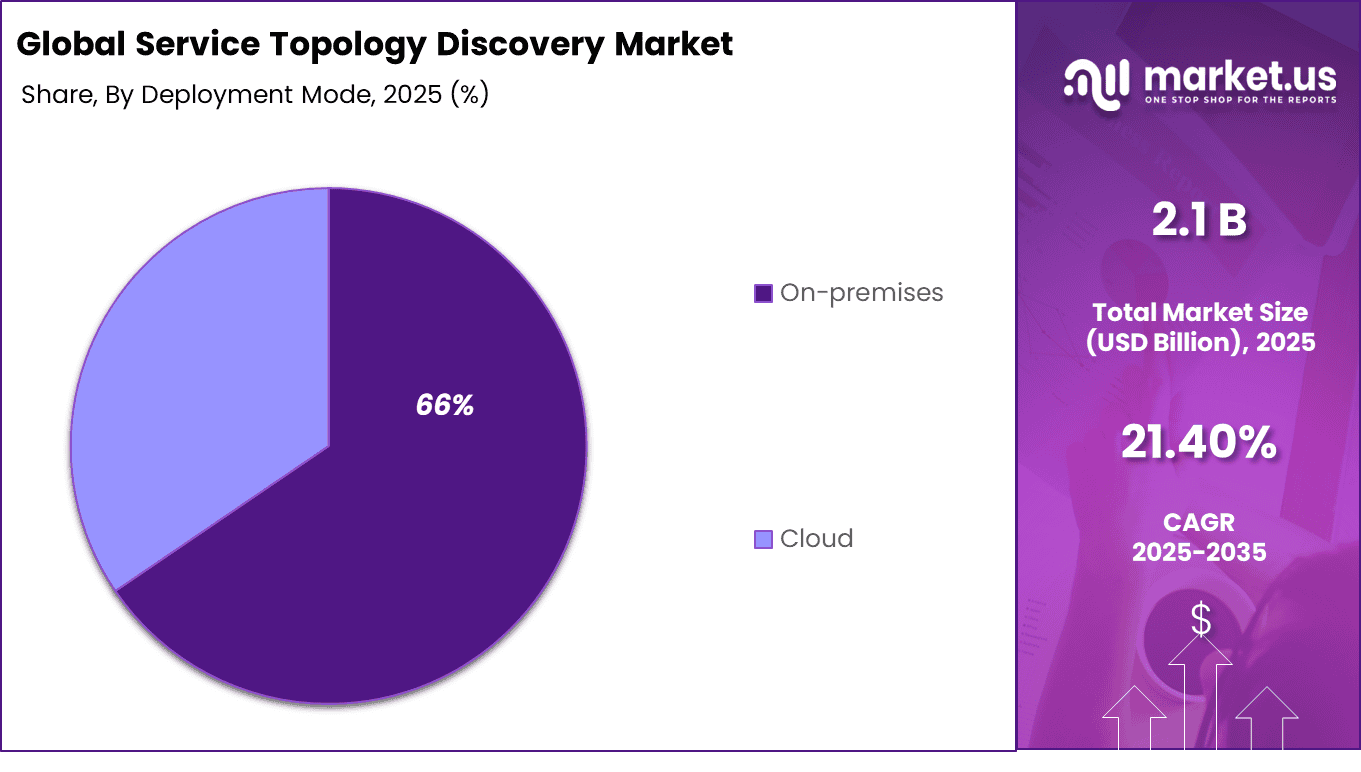
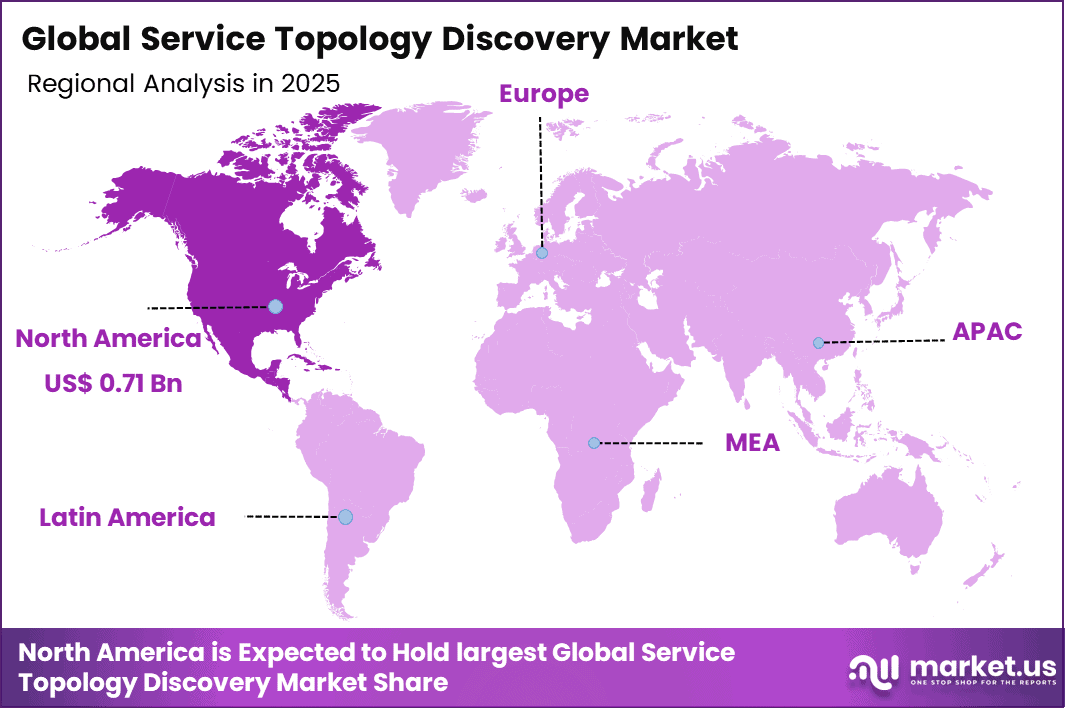
The Global Service Topology Discovery Market generated USD 2.1 billion in 2025 and is predicted to register growth from USD 2.6 billion in 2026 to about USD 14.7 billion by 2035, recording a CAGR of 21.40% throughout the forecast span. In 2025, North America held a dominant market position, capturing more than a 33.7% share, holding USD 0.71 Billion revenue.
Top Market Takeaways
Software commands 72.7% market share, delivering agentless discovery, dependency mapping, and real-time topology visualization across multi-cloud and legacy environments.
On-premises deployment captures 65.5%, enabling air-gapped scanning, custom protocol support, and integration with enterprise SIEM/CMDB systems.
Network management applications claim 40.8%, powering automated change detection, impact analysis, and troubleshooting workflows for distributed infrastructures.
Large enterprises hold 75.6%, leveraging comprehensive platforms for service dependency mapping, capacity planning, and digital twin creation.
BFSI sector represents 38.9%, utilizing topology discovery for transaction processing resilience, fraud detection correlation, and audit-ready network documentation.
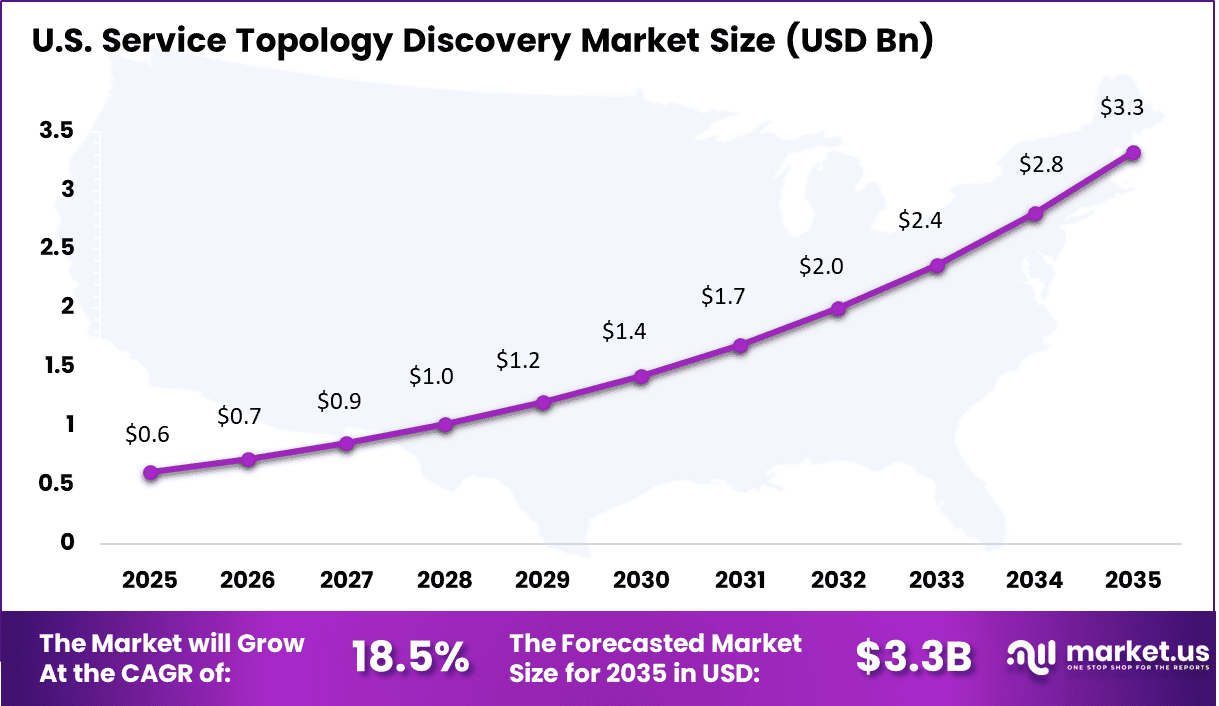
North America drives 33.7% global value, with U.S. market at USD 0.61 billion and 18.5% CAGR, fueled by Dodd-Frank reporting and zero-trust architecture mandates.
Service Topology Discovery market refers to software and monitoring solutions that automatically identify services, applications, infrastructure components, and the relationships between them across an IT environment.
These tools create a live map of how systems connect and depend on each other, which helps operations teams understand service structure more clearly. The market is gaining importance as enterprises run more distributed applications across cloud, on premises, and hybrid environments and need better visibility into service dependencies.
One of the main factors driving this market is the growing complexity of modern IT environments. When applications span multiple services, platforms, and infrastructure layers, manual mapping becomes difficult and often becomes outdated. Service topology discovery helps organizations reduce blind spots, improve incident investigation, and support change management by showing how different services and dependencies interact in real time.
Demand for service topology discovery is increasing among enterprises that rely on cloud applications, digital services, and complex operational systems where downtime and troubleshooting delays can affect business performance.
These buyers want practical tools that can improve observability, speed up root cause analysis, and provide a clearer operational view of service dependencies. Demand is also rising because IT teams increasingly prefer automated mapping instead of manually maintained service diagrams that can quickly become inaccurate.
Drivers Impact Analysis
Key Driver
Impact on CAGR Forecast (~%)
Geographic Relevance
Impact Timeline
Strategic Effect
Increasing complexity of hybrid and multi cloud IT environments
+3.6%
North America, Europe, Asia Pacific
Short to Mid Term (2025–2031)
Enhances visibility across systems
Rising adoption of microservices and containerized architectures
+3.3%
Global
Mid Term (2026–2032)
Improves service mapping accuracy
Growing demand for real time IT infrastructure monitoring
+3.0%
Global
Mid Term (2026–2032)
Supports proactive issue resolution
Expansion of DevOps and continuous delivery practices
+2.7%
Global
Mid to Long Term (2026–2035)
Drives automated topology discovery
Increasing need for application performance management
+2.5%
Global
Mid to Long Term (2026–2035)
Improves service reliability
Restraints Impact Analysis
Key Restraint
Impact on CAGR Forecast (~%)
Geographic Relevance
Impact Timeline
Strategic Effect
Complexity in integrating with legacy IT systems
-2.5%
North America, Europe
Mid Term (2026–2032)
Delays implementation
High cost of advanced monitoring and discovery tools
-2.2%
Global
Mid Term (2026–2032)
Limits adoption among SMEs
Data privacy and security concerns
-2.0%
Europe, North America
Mid to Long Term (2026–2035)
Restricts data visibility
Lack of skilled IT professionals for deployment
-1.8%
Global
Mid Term (2026–2032)
Slows adoption
Challenges in handling dynamic and large scale environments
-1.6%
Global
Mid to Long Term (2026–2035)
Affects accuracy
By Component Analysis
Software accounted for 72.7% of the Service Topology Discovery Market. This segment leads because organizations rely on automated tools to map network assets, applications, and service dependencies in real time. These platforms help create accurate topology views, which improve visibility and support faster issue identification.
The segment is also supported by increasing complexity in IT environments. As systems become more interconnected, software based discovery tools help maintain updated topology data and reduce manual effort, which strengthens their adoption across enterprise networks.
By Deployment Mode Analysis
On premises deployment held 66% of the market. This segment leads because organizations prefer to keep network discovery systems within their internal infrastructure to maintain control over sensitive operational data. It allows direct monitoring and secure handling of network information.
The segment is also driven by the need for stable and reliable performance. Enterprises use on premises solutions to ensure consistent operation and maintain compliance with internal security requirements, especially in critical IT environments.
By Application Analysis
Network management represented 40.8% of the market. This segment dominates because topology discovery plays a key role in monitoring network structure, identifying dependencies, and supporting troubleshooting processes. It helps organizations manage performance and maintain service continuity.
The segment is driven by the need for better visibility and control over network operations. Companies use discovery tools to detect configuration changes, optimize performance, and reduce downtime, which supports strong demand in this application area.
By Organization Size Analysis
Large enterprises accounted for 75.6% of the market. This segment leads because large organizations operate complex IT infrastructures with numerous interconnected systems. They require advanced discovery tools to manage dependencies and maintain operational efficiency.
The segment is supported by higher investment capacity and strong focus on IT governance. Large enterprises adopt topology discovery solutions to improve system visibility, support decision making, and enhance overall infrastructure management.
By End User Analysis
BFSI captured 38.9% of the market. This segment dominates because financial institutions manage highly interconnected systems that require continuous monitoring and strong visibility. Topology discovery helps them understand system relationships and reduce operational risks.
The segment is driven by strict regulatory requirements and the need for system reliability. BFSI organizations invest in discovery tools to maintain service continuity, improve incident response, and ensure efficient management of critical IT infrastructure.
Investor Type Impact Analysis
Investor Type
Growth Sensitivity
Risk Exposure
Geographic Focus
Investment Outlook
Venture Capital Firms
Very High
High
US, Europe, Israel
Strong cloud observability opportunity
Private Equity Firms
High
Medium
North America, Europe
Expansion in IT operations platforms
Strategic Technology Investors
Very High
Medium
US, China, Japan
Strengthens cloud ecosystem
Corporate Venture Arms
High
Medium
Global
Supports DevOps and monitoring tools
Government and Digital Infrastructure Funds
Medium
Low
Asia Pacific, Europe
Supports digital transformation initiatives
Technology Enablement Analysis
Technology Enabler
Impact on CAGR Forecast (~%)
Geographic Relevance
Impact Timeline
Implementation Significance
AI driven topology discovery and dependency mapping
+3.8%
Global
Short to Mid Term (2025–2031)
Improves accuracy and automation
Cloud native monitoring and observability platforms
+3.4%
Global
Short to Mid Term (2025–2030)
Enables scalable deployment
Integration with DevOps and CI CD pipelines
+3.1%
Global
Mid Term (2026–2032)
Supports continuous monitoring
Real time analytics and visualization tools
+2.8%
Global
Mid to Long Term (2026–2035)
Enhances decision making
API based integration across IT ecosystems
+2.5%
Global
Mid to Long Term (2026–2035)
Improves interoperability
Key Challenges
Mapping complex IT environments is a major challenge because service topology discovery tools must identify relationships across applications, servers, cloud services, networks, and databases.
Integration can be difficult because many organizations use old systems, cloud platforms, and third party tools that do not share data in a consistent way.
Data accuracy is a key issue because frequent infrastructure changes, temporary workloads, and incomplete system visibility can lead to wrong service maps.
Real time discovery can be hard because large enterprise environments generate huge volumes of system activity that are difficult to track continuously.
User adoption can be slow because IT teams need training to understand discovered dependencies, validate results, and use the software effectively in daily operations.
Emerging Trends
A key trend in the Service Topology Discovery market is the growing use of automated mapping tools that visualize relationships between applications, services, and infrastructure components in real time. These systems continuously track how services interact across cloud and on premises environments, helping teams understand dependencies without manual documentation.
Organizations are adopting solutions that provide dynamic and accurate topology views, which improves visibility into complex digital ecosystems. This trend reflects a shift toward continuous discovery where system relationships are updated automatically as environments change.
Growth Factors
The increasing complexity of modern IT environments is supporting the growth of service topology discovery solutions. Businesses operate across multiple platforms, which makes it difficult to track how services are connected and how changes impact overall performance.
Discovery tools help teams identify dependencies, reduce troubleshooting time, and improve system reliability. At the same time, the need for better operational visibility encourages organizations to adopt solutions that provide clear insights into service interactions and support more efficient management of digital infrastructure.
Key Market Segments
By Component
Software
Services
By Deployment Mode
On-Premises
Cloud
By Application
Network Management
IT Operations
Security and Compliance
Others
By Organization Size
Large Enterprises
Small and Medium Enterprises
By End-User
BFSI
Healthcare
IT and Telecommunications
Retail
Manufacturing
Government
Others
Regional Analysis
North America accounted for 33.7% of the Service Topology Discovery Market, reflecting strong adoption of advanced IT operations and network visibility solutions across enterprises. Organizations across the region increasingly deploy topology discovery tools to map complex application environments, identify dependencies, and improve system performance monitoring. The growing shift toward hybrid cloud and microservices architectures continues to increase network complexity, which drives demand for automated discovery and visualization solutions across North America.
The U.S. generated about USD 0.61 Billion within the regional market and is projected to expand at a CAGR of 18.5%. Enterprises across the country continue to invest in platforms that provide real time visibility into application and infrastructure relationships.
Service topology discovery solutions help IT teams detect issues faster, optimize resource allocation, and support efficient incident management. As organizations manage highly dynamic and distributed IT environments, demand for intelligent topology discovery tools continues to grow rapidly across the US market.
Key Regions and Countries
North America
US
Canada
Europe
Germany
France
The UK
Spain
Italy
Russia
Netherlands
Rest of Europe
Asia Pacific
China
Japan
South Korea
India
Australia
Singapore
Thailand
Vietnam
Rest of APAC
Latin America
Brazil
Mexico
Rest of Latin America
Middle East & Africa
South Africa
Saudi Arabia
UAE
Rest of MEA
Competitive Analysis
The competitive landscape of the Service Topology Discovery market includes major IT management, network monitoring, and enterprise software providers. IBM Corporation, Cisco Systems, Inc., SolarWinds Worldwide, LLC, Microsoft Corporation, ManageEngine, Broadcom Inc., BMC Software, Inc., and AppDynamics hold strong positions because they offer platforms that help businesses map IT assets, understand service relationships, and improve visibility across complex infrastructure. These companies compete through automation, monitoring depth, and integration with wider IT operations tools.
Other players such as NetBrain Technologies, Inc., Paessler AG, Nagios Enterprises, LLC, ScienceLogic, Inc., Auvik Networks Inc., Micro Focus International plc, Progress Software Corporation, Kentik Inc., LogicMonitor, Inc., Entuity, Inc., HelpSystems, LLC, and FNT GmbH add competition through network discovery, dependency mapping, and performance monitoring solutions. The market is shaped by real time visibility, ease of deployment, scalability, and the ability to support hybrid and multi cloud environments.
The future outlook for the Service Topology Discovery Market looks strong as IT teams need better visibility into how applications, infrastructure, and service dependencies connect across cloud and on premises environments. Current platform guidance shows that service topology discovery helps identify components, map relationships, and build a clearer view of business services, which supports faster troubleshooting and better change planning. As digital systems become more complex and organizations focus more on uptime, automation, and root cause analysis, demand for service topology discovery solutions is expected to grow steadily in the coming years.
Recent Developments
February, 2026 – IBM Instana adds auto-topology for Kubernetes clusters with AI root cause. Maps app-to-infra deps across AWS and Azure. Targets enterprises with Turbonomic links for auto-scale.
March, 2026 – Cisco AppDynamics rolls ThousandEyes integration for full-stack topology. Discovers BGP paths and SaaS deps in real-time. Boosts zero-trust with device health overlays.
Report Scope
Report Features
Description
Market Value (2025)
USD 2.1 Billion
Forecast Revenue (2035)
USD 14.7 Billion
CAGR(2025-2035)
21.40%
Base Year for Estimation
2024
Historic Period
2020-2024
Forecast Period
2026-2035
Report Coverage
Revenue forecast, AI impact on Market trends, Share Insights, Company ranking, competitive landscape, Recent Developments, Market Dynamics and Emerging Trends
Segments Covered
By Component (Software, Services), By Deployment Mode (On-Premises, Cloud), By Application (Network Management, IT Operations, Security and Compliance, Others), By Organization Size (Large Enterprises, Small and Medium Enterprises), By End-User (BFSI, Healthcare, IT and Telecommunications, Retail, Manufacturing, Government, Others)
Regional Analysis
North America – US, Canada; Europe – Germany, France, The UK, Spain, Italy, Russia, Netherlands, Rest of Europe; Asia Pacific – China, Japan, South Korea, India, New Zealand, Singapore, Thailand, Vietnam, Rest of Latin America; Latin America – Brazil, Mexico, Rest of Latin America; Middle East & Africa – South Africa, Saudi Arabia, UAE, Rest of MEA