


Report Overview
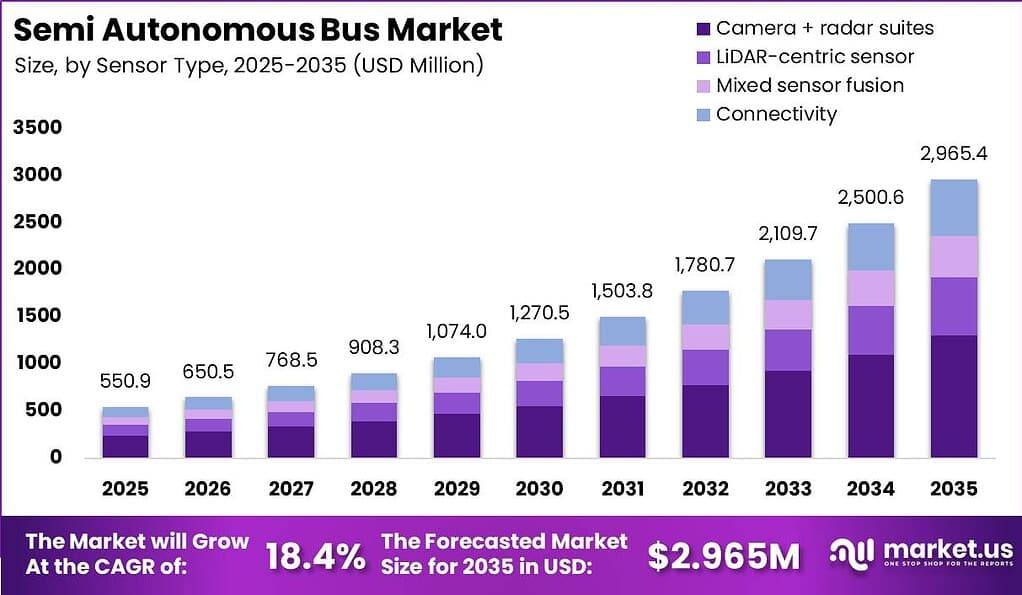
Global Semi Autonomous Bus Market size is expected to be worth around USD 2,965.4 Million by 2035 from USD 550.9 Million in 2025, growing at a CAGR of 18.4% during the forecast period 2026 to 2035.
The semi autonomous bus market covers transit vehicles equipped with partial-to-conditional automation, spanning Level 1 driver assistance through Level 4 high automation. These platforms integrate sensor suites, software stacks, and connectivity systems into commercial bus frames. Operators deploy them across urban fixed routes, campus shuttles, airport loops, and intercity corridors. Propulsion types include electric, diesel, and hybrid powertrains, each paired with distinct automation architectures suited to specific operating environments.
Key Takeaways
- The global Semi Autonomous Bus Market is valued at USD 550.9 Million in 2025 and is forecast to reach USD 2,965.4 Million by 2035, at a CAGR of 18.4%.
- By Propulsion Type, Electric holds the leading position and is also the fastest-growing sub-segment.
- By Level of Automation, Level 3 (Semi-Autonomous / Conditional) dominates with a 38.4% share.
- By Sensor, Camera + Radar Suites leads with a 55.4% share.
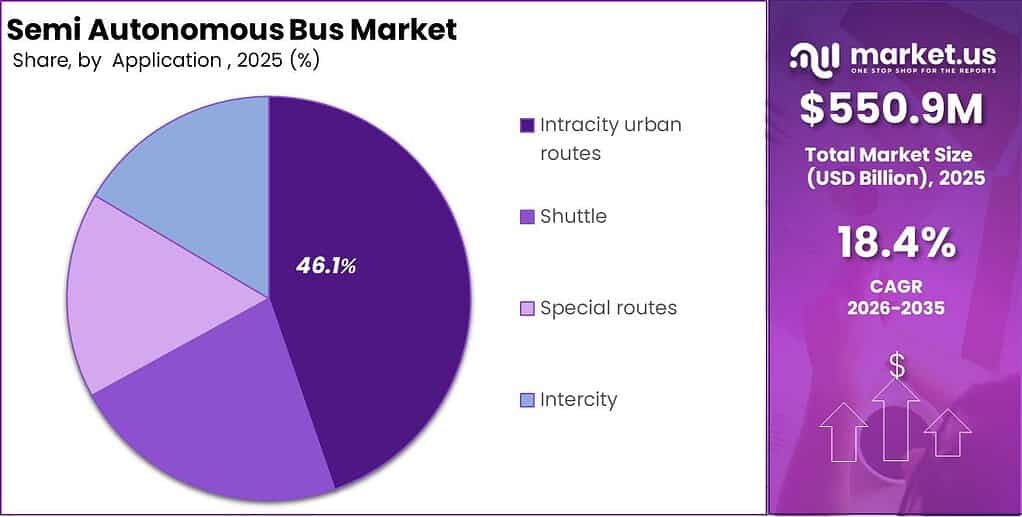
- By Application, Intracity Urban Routes holds the largest share at 46.1%.
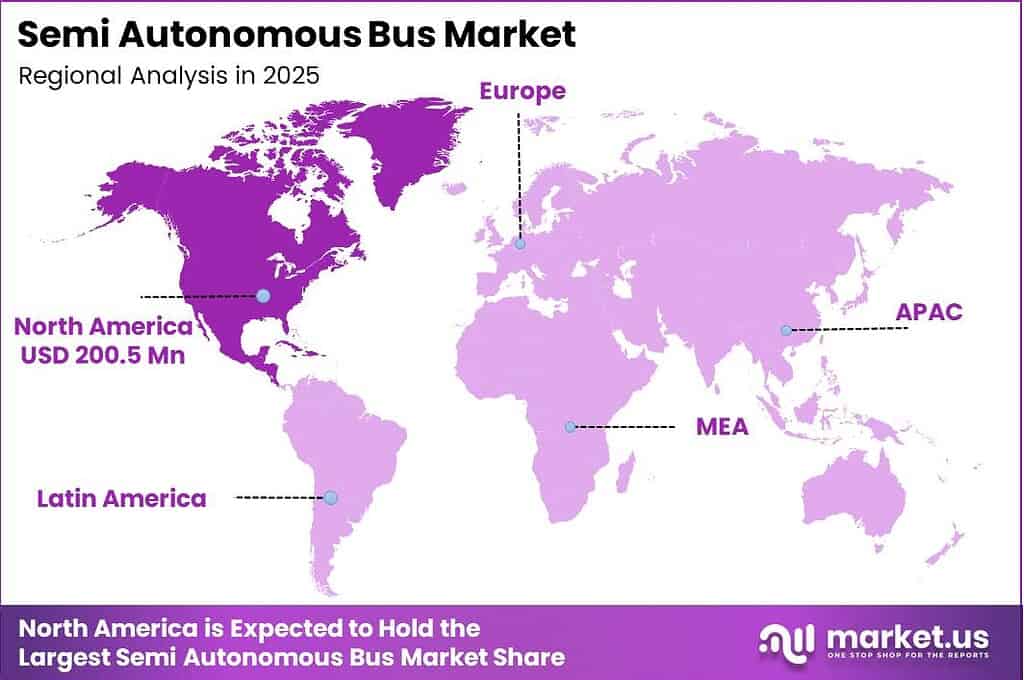
- North America leads all regions with a 36.4% market share, valued at USD 200.54 Million in 2025.
According to Land Transport Authority (Singapore) data, Singapore’s Land Transport Authority launched a pilot to deploy 6 autonomous public buses from mid-2026, with an option to expand by 14 additional units after performance evaluation. This structured pilot signals a shift from laboratory testing to revenue-service deployment. Transit agencies in peer cities will monitor outcomes closely, accelerating their own procurement timelines if Singapore’s operational results confirm reliability on mixed public routes.
As reported by the UK Department for Transport, bus passenger journeys outside London increased by 4% in the year ending March 2025. Expanding ridership volumes strengthen the commercial case for automation investment across the UK network. Transit operators facing rising driver cost pressures now have a measurable demand baseline that justifies semi-autonomous technology procurement over a multi-year fleet renewal cycle.
Land Transport Authority (Singapore) indicates that Singapore’s autonomous bus pilot will operate on two public bus routes, Services 191 and 400, selected for their short routes and controlled operating environments. This controlled-environment approach limits early operational risk while generating validated performance data. Vendors targeting public transit contracts in Asia Pacific should structure their go-to-market strategies around controlled corridor pilots rather than broad network deployments.
Type Analysis
Electric dominates with 53.4% due to electrification mandates accelerating ADS integration.
In 2025, Electric held a dominant market position in the By Propulsion Type segment of the Semi Autonomous Bus Market, with a 53.4% share. Electric drivetrains provide the stable onboard power architecture that advanced driver assistance and autonomous driving systems require. According to the International Energy Agency, global electric bus stock exceeded 800,000 units by 2023, concentrated heavily in China, confirming the scale of the electrification wave that semi-autonomous vendors are now targeting for software stack integration. Fleet operators choosing electric platforms gain a future-proof base for progressive autonomy upgrades.
Diesel buses retain a structural role in intercity and regional transit networks where charging infrastructure remains sparse. The International Road Transport Union reports that diesel still powers more than 70% of bus fleets in emerging markets across Africa, Latin America, and Southeast Asia. This installed base represents a near-term retrofit opportunity for Level 1 and Level 2 driver assistance systems. Vendors offering modular sensor add-ons compatible with diesel frames can capture incremental revenue before full electric transition occurs in these geographies.
Hybrid propulsion serves transit agencies managing the gap between full electrification timelines and existing diesel fleet lifecycles. The European Automobile Manufacturers Association notes that hybrid buses accounted for a meaningful share of new urban bus registrations in Western Europe through 2024. Hybrid platforms give operators partial automation capability today without full EV infrastructure commitment. This positions hybrid as the preferred transitional format for mid-sized European municipalities operating on constrained capital budgets across 2026 to 2028.
Level Of Automation Analysis
Level 3 Semi-Autonomous / Conditional dominates with 38.4% due to regulatory type-approval frameworks enabling urban deployment.
In 2025, Level 3 Semi-Autonomous / Conditional held a dominant market position in the By Level of Automation segment of the Semi Autonomous Bus Market, with a 38.4% share. Level 3 systems allow the vehicle to manage all driving tasks within a defined operational design domain while requiring a human driver to resume control on request. The Society of Automotive Engineers confirms Level 3 as the current commercial threshold for public-road transit deployment. This positioning makes Level 3 platforms the primary target for city fleet procurement tenders globally through 2028.
Level 2 Partial Automation covers systems where the human driver retains continuous supervisory responsibility while automation handles steering, acceleration, or braking in specific conditions. The United Nations Economic Commission for Europe confirms that UN Regulation No. 171 now provides a uniform type-approval route for Level 2 driver control assistance systems across more than 60 contracting parties. This harmonization removes a key certification barrier. Transit agencies in contracting-party markets can now procure Level 2 platforms without navigating separate national approval processes, compressing tender-to-deployment timelines.
Level 4 High Automation is the fastest-growing sub-segment, targeting geofenced and fixed-loop operating environments such as airport aprons, campus circuits, and controlled BRT corridors. The International Transport Forum identifies geofenced public shuttle deployments as the primary initial commercialization pathway for Level 4 systems, with pilot programs active across Asia Pacific and the Middle East. Early movers establishing operational records in geofenced environments will secure the reference contracts needed to qualify for broader urban transit tenders as regulatory frameworks expand. Level 1 Driver Assistance and Level 5 Full Automation hold the remaining share collectively.
Sensor Analysis
Camera + Radar Suites dominates with 55.4% due to proven cost-to-performance ratio in commercial transit.
In 2025, Camera + Radar Suites held a dominant market position in the By Sensor segment of the Semi Autonomous Bus Market, with a 55.4% share. Camera and radar combinations offer OEMs a cost-effective perception architecture validated across millions of passenger vehicle production units before transit adaptation. The IEEE Vehicular Technology Society reports that camera-radar fusion systems achieve object detection ranges exceeding 200 meters in adverse weather, a critical threshold for urban bus safety certification. This performance baseline at accessible unit cost locks camera-radar into the majority of near-term commercial bus platform designs.
Lidar-Centric Sensor Stacks are the fastest-growing sub-segment as solid-state lidar unit costs have fallen sharply from their 2018 peak levels. Velodyne and Innoviz corporate production disclosures confirm solid-state lidar modules entering the sub-USD 500 per unit price band for automotive volume orders. This cost inflection opens lidar integration to transit OEMs previously priced out of the technology. Bus platforms adopting lidar-centric stacks gain a three-dimensional point-cloud advantage that camera-radar alone cannot replicate in complex urban intersection environments.
Mixed Sensor Fusion architectures combine camera, radar, and lidar inputs through a central perception processing unit to provide redundant environmental awareness across all weather and lighting conditions. The ISO 21448 Safety of the Intended Functionality standard, confirmed in UNECE regulatory guidance, explicitly recommends sensor redundancy for public passenger transport applications. Operators selecting mixed fusion platforms meet the highest available safety benchmarks, reducing liability exposure and shortening insurance approval timelines. Connectivity-integrated sensors hold the remaining share, adding V2X data layers to onboard perception pipelines.
Application Analysis
Intracity Urban Routes dominates with 46.1% due to fixed-schedule operations enabling predictable ADS validation.
In 2025, Intracity Urban Routes held a dominant market position in the By Application segment of the Semi Autonomous Bus Market, with a 46.1% share. Fixed urban route operations provide the repeatable, mappable environment that autonomous driving system developers need for high-confidence validation. The International Association of Public Transport reports that urban bus networks in cities with populations above 1 million generate average daily ridership densities exceeding 3,000 passengers per route per day. This density creates a strong operator justification for automation investment on the highest-throughput corridors first.
Shuttle services are the fastest-growing application sub-segment, driven by private-sector deployments across airports, campuses, and industrial parks that operate outside public-road regulatory constraints. The American Public Transportation Association confirms that campus and institutional shuttle contracts represent a growing share of new autonomous vehicle trial agreements signed in North America through 2024. Fixed-loop shuttle economics are compelling because the driver labor cost eliminated by automation represents roughly 50% to 60% of total operating cost on these routes. Operators in this sub-segment achieve payback periods significantly shorter than those on open urban networks.
Special Routes cover non-standard operating environments including tourist circuits, hospital transfer loops, and stadium event shuttles where passenger volumes are periodic and route complexity is low. These corridors offer manufacturers a lower-risk validation environment for new sensor configurations before broader deployment. Intercity services hold the remaining application share, operating on highway and regional road networks that demand higher automation maturity and regulatory clearance than city routes currently require. Intercity growth will accelerate once Level 3 and Level 4 highway-capable certifications achieve broader international recognition.
Key Market Segments
By Propulsion Type
- Electric
- Diesel
- Hybrid
By Level of Automation
- Level 3 Semi-Autonomous / Conditional
- Level 2 Partial Automation
- Level 4 High Automation
- Level 1 Driver Assistance
- Level 5 Full Automation
By Sensor
- Camera + Radar Suites
- Lidar-Centric Sensor Stacks
- Mixed Sensor Fusion
- Connectivity
By Application
- Intracity Urban Routes
- Shuttle
- Special Routes
- Intercity
Regional Analysis
North America Dominates the Semi Autonomous Bus Market with a Market Share of 36.4%, Valued at USD 200.54 Million
North America commands 36.4% of the global Semi Autonomous Bus Market, generating USD 200.54 Million in 2025. The region’s leadership reflects a combination of federal smart mobility funding, active municipal pilot programs, and a deep OEM and Tier 1 supplier ecosystem concentrated in the United States and Canada. As per our research, the mandatory components required for autonomous bus procurement, including integrated fleet management systems, remote operation capability, electric charging infrastructure, and autonomous driving software, are more readily available in North America than in any other region, compressing deployment timelines for transit agencies moving from pilot to revenue service.
Asia Pacific is the fastest-growing region in this market, driven by government-funded smart mobility programs in China, Singapore, Japan, and South Korea. Data from the UK Department for Transport shows bus service mileage in England outside London increased by 3% in the year ending March 2025, signaling expanding transit operations suitable for automation investment across Europe. By contrast, Asia Pacific’s growth pace outpaces Europe because state-directed industrial policy in China and Singapore funds full ecosystem development from vehicle production through infrastructure, eliminating the multi-stakeholder coordination delays that slow European deployment cycles.
Europe and the remaining global regions collectively account for a meaningful secondary share. UK Department for Transport data shows total local bus passenger journeys in England increased by 1% during the year ending March 2025, providing a stable but modest demand foundation for automation adoption. Latin America, the Middle East, and Africa represent earlier-stage markets where geofenced campus and airport shuttle deployments will precede open public-road transit rollouts, consistent with the regulatory sequencing observed in more mature markets.
Key Regions and Countries
North America
- US
- Canada
Europe
- Germany
- France
- The UK
- Spain
- Italy
- Rest of Europe
Asia Pacific
- China
- Japan
- South Korea
- India
- Australia
- Rest of APAC
Latin America
- Brazil
- Mexico
- Rest of Latin America
Middle East and Africa
- GCC
- South Africa
- Rest of MEA
Market Dynamics
Market Opportunity Analysis - Geofenced shuttles, underpenetrated regions, and software licensing offer the clearest near-term entry points
Campus and airport shuttle corridors represent the least-contested entry point in this market. As established in the Application Analysis, Shuttle is the fastest-growing sub-segment. Private landowners fund these deployments outside municipal budget cycles, removing the appropriation friction that delays public transit contracts. New entrants who establish revenue-generating fixed-loop operations in 2026 and 2027 will accumulate the operational safety records that public transit procurement tenders will increasingly require as evaluation criteria through 2029.
The Level 4 High Automation sub-segment is underpenetrated relative to its long-term addressable scale. As shown in the Level of Automation Analysis, Level 4 is the fastest-growing segment but currently holds a minority share of the market. Vendors who invest in geofenced Level 4 operational design domain validation now will hold certified platform advantages when urban regulators expand permitted operating environments. This certification lead time advantage is not easily replicated by later entrants.
Asia Pacific and the Middle East represent the two regions where government-directed funding creates accessible entry for foreign vendors willing to operate through local partnerships. North America dominates today with a 36.4% share, but the growth rate differentials visible in Asia Pacific signal a rebalancing of procurement volume toward 2030. Vendors who secure reference deployments in Singapore, Gulf states, and Southeast Asian cities through 2027 will be positioned for the larger tender cycles those markets will generate in the following forecast years.
The software licensing model represents an underexploited monetization layer across all application sub-segments. As noted in the Application and Sensor analyses, the market’s sensor architectures and automation levels create natural upgrade pathways. Vendors offering subscription-based autonomous driving software upgrades can generate recurring revenue from fleets already in service. This model converts a one-time hardware sale into a multi-year revenue stream, fundamentally improving vendor cash flow predictability and investor return visibility across the 2026 to 2035 forecast window.
Technology and Innovation Landscape - Sensor cost deflation, OTA updates, 5G connectivity, and digital twin validation are reshaping platform economics
The Renault and WeRide autonomous electric minibus demonstration in Barcelona deployed 10 cameras and 8 lidar sensors for environmental perception, according to Associated Press reporting on the Barcelona autonomous bus trial. This sensor density on a single transit platform illustrates the hardware intensity that current Level 3 and Level 4 systems require. As sensor unit costs continue declining, platforms matching this specification will become commercially viable for municipal fleet procurement rather than remaining limited to funded pilot programs.
As reported by Associated Press coverage of the Barcelona autonomous bus trial, the Renault and WeRide vehicle operates over a 2.2 km public route at speeds up to 40 km/h, and delivers a driving range of up to 120 km on a single charge. This combination of operational range, route coverage, and speed ceiling defines the current performance envelope for commercially deployed autonomous electric buses. Operators evaluating technology procurement should benchmark candidate platforms against this validated specification as a minimum commercial threshold.
Over-the-air software updates are becoming standard practice for semi-autonomous bus platforms, eliminating the need for physical service visits to update perception algorithms, operational design domain parameters, or compliance configurations. This shift converts what was previously a hardware maintenance cost into a remote software management function. Fleet operators adopting OTA-capable platforms reduce downtime and allow vendors to deploy perception improvements across entire fleets simultaneously, accelerating safety case maturation without requiring vehicle recalls or depot interventions.
Digital twin simulation platforms are accelerating the validation of autonomous bus operations by allowing engineers to test perception stacks and route behaviors across millions of synthetic scenarios before physical deployment. This simulation-first approach directly addresses the talent and validation cost challenge identified in the Challenges section, reducing the share of program budget consumed by physical validation cycles. Vendors integrating digital twin workflows into their development pipelines will compress time-to-certification and reduce per-platform engineering cost, creating a structural cost advantage over competitors relying on physical-only validation methods.
Drivers
UN Regulation No. 171 on Driver Control Assistance Systems entered into force in September 2024, establishing the first uniform type-approval pathway for SAE Level 2 partial automation across more than 60 contracting parties. This regulatory shift converts a fragmented national certification burden into a single homologation route. OEMs can now amortize a common perception stack across multiple vehicle classes, moving the operator business model toward scalable software feature licensing rather than bespoke per-city retrofit contracts.
The subsequent UNECE emergency lane keeping system regulation entered into force in February 2026, layering mandated ELKS onto the same platform architecture. This reduces the per-variant certification lead time that historically added 9 to 14 months to each platform. The mid-2026 completion target of the ADS Informal Working Group drafting effort aligns with active fleet procurement windows. Vendors who achieve type approval under harmonized standards now capture first-mover advantage in the near-term retrofit demand cycle across all contracting-party markets simultaneously.
| Driver | (~) % Impact on CAGR Forecast | Geographic Relevance | Impact Timeline |
|---|---|---|---|
| Driver Assistance Regulatory Harmonization (UN-R 171 DCAS) | +3.1% | Europe, Japan, South Korea | Short term (2 years or less) |
| Urban Transit Electrification Mandates | +2.6% | China, Western Europe | Medium term (2 to 4 years) |
| Sensor and LiDAR Unit Cost Deflation | +2.4% | Global | Short term (2 years or less) |
| Municipal Driver Shortage Substitution | +2.0% | North America, Western Europe | Medium term (2 to 4 years) |
| Smart City Fixed Route Pilot Funding | +1.7% | China, Middle East, Singapore | Short term (2 years or less) |
| Fleet Total Cost of Ownership Compression | +1.5% | Global | Medium term (2 to 4 years) |
Restraints
IMF World Economic Outlook data and Federal Reserve and European Central Bank benchmark rate disclosures confirm sustained policy interest rates through the baseline period. Semi-autonomous bus procurement is overwhelmingly debt-financed by public transit authorities whose bonding costs rose in tandem with sovereign lending rate indices. A semi-autonomous unit carries an acquisition premium of roughly 40% to 60% over a conventional diesel or electric bus, making every basis point increase in financing cost a direct drag on multi-year tender awards.
A 200 to 300 basis point increase in financing cost translates directly into deferred tender awards and cancelled option orders visible in national procurement notices. OEMs forced to extend vendor financing on their own balance sheets face immediate margin compression and delayed CapEx recovery. This freezes the current-period order book rather than merely slowing its ceiling. Transit agencies unable to secure affordable long-term financing will delay fleet renewal cycles, limiting near-term volume for all semi-autonomous platform suppliers globally.
| Restraint | (~) % Impact on CAGR Forecast | Geographic Relevance | Impact Timeline |
|---|---|---|---|
| Elevated Capital Cost of Financing | -2.9% | North America, Europe, emerging markets | Short term (2 years or less) |
| Prohibitive Vehicle Acquisition Premium | -2.5% | Global | Short term (2 years or less) |
| Municipal Budget Appropriation Constraints | -1.9% | North America, Western Europe | Medium term (2 to 4 years) |
| Restrictive Public Road Operating Bans | -1.6% | Selected US states, parts of Europe | Short term (2 years or less) |
| Insurance and Liability Underwriting Gaps | -1.3% | North America, Europe | Medium term (2 to 4 years) |
Challenges
A persistent shortage of machine learning perception, sensor fusion, and safety validation engineers represents the most structurally damaging challenge facing semi-autonomous bus developers. OECD skills-demand labor market surveys and OEM annual reports document repeated failures to meet autonomy R&D headcount targets. Validation and verification cycles consume 30% to 45% of a semi-autonomous program budget. Unfilled senior perception roles carry recruitment lead times exceeding 6 to 9 months, inflating engineering cost per validated software release.
This talent scarcity slows the pace at which operational design domains can expand from fixed campus loops to mixed urban traffic. The long-term adjustment requires a shift from fully in-house engineering toward tiered supplier partnerships and shared open validation datasets coordinated through industry bodies. Spreading scarce talent across a common safety-case framework reduces duplication overhead. Companies that build supplier partnerships now will compress their validation cycles relative to competitors that persist with isolated in-house development structures through 2028 and beyond.
| Challenge | (~) % CAGR Friction Drag | Geographic Relevance | Mitigation Horizon |
|---|---|---|---|
| Perception Stack Talent Deficit | -1.8% | Global | Long term (4 years or more) |
| Semiconductor Supply Chain Drag | -1.5% | Global | Medium term (2 to 4 years) |
| Fragmented Roadside Infrastructure Readiness | -1.4% | North America, emerging markets | Long term (4 years or more) |
| Public Trust and Acceptance Friction | -1.2% | Global | Medium term (2 to 4 years) |
| Cybersecurity Compliance Overhead | -1.0% | Europe, North America, Japan | Medium term (2 to 4 years) |
Opportunities
Segregated, low-speed, geofenced environments such as airport aprons, university campuses, and industrial parks fall outside the public-road operating restrictions that constrain city routes. These environments allow operators to deploy Level 2 to conditional Level 3 systems within simplified operational design domains. IEA transport electrification tracking confirms that geofenced autonomous fleets doubled during 2025. Private landowners fund these deployments outside constrained municipal appropriation cycles, converting unmet demand into near-term recurring mobility-as-a-service revenue.
The unit economics of geofenced shuttle operations are structurally compelling. Driver labor represents roughly 50% to 60% of conventional shuttle operating cost. Eliminating that labor line expands operator gross margin by an estimated 15 to 20 percentage points once a single trained supervisor oversees multiple vehicles. This margin profile sits entirely above the baseline public transit forecast. Early movers establishing revenue operations in campus and airport environments will accumulate the safety records needed to qualify for broader urban transit tenders as regulation expands.
| Opportunity | (~) % Potential CAGR Upside | Geographic Relevance | Execution Window |
|---|---|---|---|
| Airport and Campus Shuttle White Space | +2.7% | Middle East, Asia-Pacific, North America | Medium term (2 to 4 years) |
| Data and Mobility Software Monetization | +2.3% | Global | Medium term (2 to 4 years) |
| Emerging Market Leapfrog Deployments | +1.9% | India, Southeast Asia, Gulf states | Long term (4 years or more) |
| Retrofit Kit Aftermarket Adjacency | +1.6% | Global | Medium term (2 to 4 years) |
| Supplier Consolidation M&A Roll-Ups | +1.3% | Europe, North America, China | Long term (4 years or more) |
Key Company Insights
AB Volvo has built its semi-autonomous bus position through the Volvo Autonomous Solutions subsidiary, which achieved key commercialization milestones in February 2026, including production of the Volvo VNL Autonomous Platform and the start of autonomous operations with a safety driver. This hardware-first strategy anchors Volvo in the high-assurance segment of the market. Singapore’s pilot requirement for buses with a minimum seating capacity of 16 passengers aligns directly with Volvo’s heavy-transit platform specifications, positioning the company for government contract qualification.
Baidu Apollo commands a software-platform advantage that no hardware-focused OEM can easily replicate. In May 2025, Baidu announced plans to expand its Apollo Autonomous Mobility Platform into Europe, including discussions with Swiss public transport operators. This geographic push extends Baidu’s operational design domain validation beyond China into regulated Western markets. Singapore’s planned 3-year autonomous bus operational period before wider commercial expansion gives software platform vendors like Baidu a defined window to accumulate cross-market safety data that strengthens future tender bids globally.
Key Players
- Ab Volvo
- Daimler Truck AG
- Yutong Bus Co. Ltd.
- Hyundai Motor Company
- Toyota Motor Corporation
- Volkswagen AG
- BYD Company Limited (BYD Auto / BYD Bus)
- Proterra Inc.
- Navya SA
- EasyMile SAS
- Baidu Apollo
- NFI Group Inc.
- Continental AG
- Robert Bosch GmbH
- XCMG Group
Recent Developments
- January 2025: BYD Company Limited unveiled the next-generation electric bus chassis with advanced driver-assistance and intelligent driving capabilities for commercial bus fleets, strengthening its semi-autonomous transit portfolio.
- October 2025: Baidu partnered with Swiss Post’s PostBus to deploy Apollo Go autonomous public transport services in Switzerland, with pilot fleet testing beginning in December 2025.
- January 2026: Baidu and AutoGo launched a fully autonomous commercial mobility service in Abu Dhabi following regulatory approval, supporting wider autonomous public transport deployment across the Gulf region.
- January 2026: Baidu received Dubai’s first driverless vehicle testing permit and established its first overseas autonomous operations hub to support large-scale commercial deployment in the Middle East.
Geopolitical Impact Analysis
According to WTO trade monitoring reports, US semiconductor tariffs introduced in 2024 and extended through 2025 added an estimated 25% to 50% to import costs for advanced chips used in automotive perception stacks. Semi-autonomous bus platforms depend on high-performance computing modules for sensor fusion and path planning. These tariff-driven cost increases translate directly into higher bill-of-materials costs for bus OEMs, compressing per-unit margins and delaying procurement decisions in price-sensitive municipal tender markets across North America and Europe.
World Shipping Council data shows average container transit times on Asia-to-Europe lanes increased by approximately 14 days through 2024 due to Red Sea shipping rerouting via the Cape of Good Hope. Lidar modules, high-resolution camera arrays, and embedded computing units sourced from Asian manufacturers face extended lead times as a direct result. As per IMF World Economic Outlook assessments, these supply chain disruptions add between 3% and 7% to component landed costs for European bus OEMs, reinforcing pressure on tender pricing and pushing procurement timelines further into 2026 and 2027.
Report Scope
| Report Features | Description |
|---|---|
| Market Value (2025) | USD 550.9 Million |
| Forecast Revenue (2035) | USD 2,965.4 Million |
| CAGR (2026-2035) | 18.4% |
| Base Year for Estimation | 2025 |
| Historic Period | 2020-2024 |
| Forecast Period | 2026-2035 |
| Report Coverage | Revenue Forecast, Market Dynamics, Market Opportunity Analysis, Technology and Innovation Landscape, Competitive Landscape, Recent Developments |
| Segments Covered | By Propulsion Type (Electric, Diesel, Hybrid), By Level of Automation (Level 3 Semi-Autonomous / Conditional, Level 2 Partial Automation, Level 4 High Automation, Level 1 Driver Assistance, Level 5 Full Automation), By Sensor (Camera + Radar Suites, Lidar-Centric Sensor Stacks, Mixed Sensor Fusion, Connectivity), By Application (Intracity Urban Routes, Shuttle, Special Routes, Intercity) |
| Regional Analysis | North America (US and Canada), Europe (Germany, France, The UK, Spain, Italy, and Rest of Europe), Asia Pacific (China, Japan, South Korea, India, Australia, and Rest of APAC), Latin America (Brazil, Mexico, and Rest of Latin America), Middle East and Africa (GCC, South Africa, and Rest of MEA) |
| Competitive Landscape | Ab Volvo, Daimler Truck AG, Yutong Bus Co. Ltd., Hyundai Motor Company, Toyota Motor Corporation, Volkswagen AG, BYD Company Limited, Proterra Inc., Navya SA, EasyMile SAS, Baidu Apollo, NFI Group Inc., Continental AG, Robert Bosch GmbH, XCMG Group |
| Customization Scope | Customization for segments, region / country-level will be provided. Additional customization can be done based on requirements. |
| Purchase Options | We have three licenses to opt for: Single User License | Multi-User License (Up to 5 Users) | Corporate Use License (Unlimited User and Printable PDF) |





































