


Report Overview
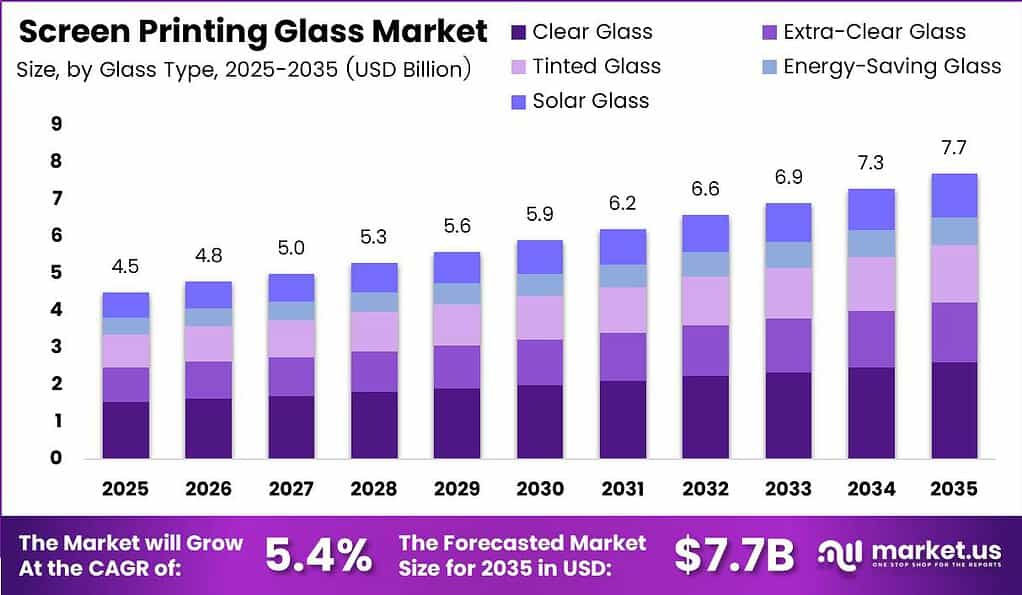
Global Screen Printing Glass Market size is expected to be worth around USD 7.7 Billion by 2035 from USD 4.5 Billion in 2025, growing at a CAGR of 5.4% during the forecast period 2026 to 2035.
The screen printing glass market covers glass substrates that receive functional or decorative ink deposits through mesh-based printing processes, including ceramic, UV, and enamel technologies. These products serve architectural glazing, automotive glazing, solar modules, consumer electronics, and interior decoration. Processors print on clear, tinted, extra-clear, energy-saving, and solar glass, then cure through thermal or UV treatment to create durable, application-ready panels.
Key Takeaways
- Global Screen Printing Glass Market is valued at USD 4.5 Billion in 2025 and forecast to reach USD 7.7 Billion by 2035 at a CAGR of 5.4%.
- By Glass Type, Clear Glass dominates with a 34.00% share in 2025.
- By Printing Type, Ceramic Screen Printing holds the leading position with a 55.00% share in 2025.
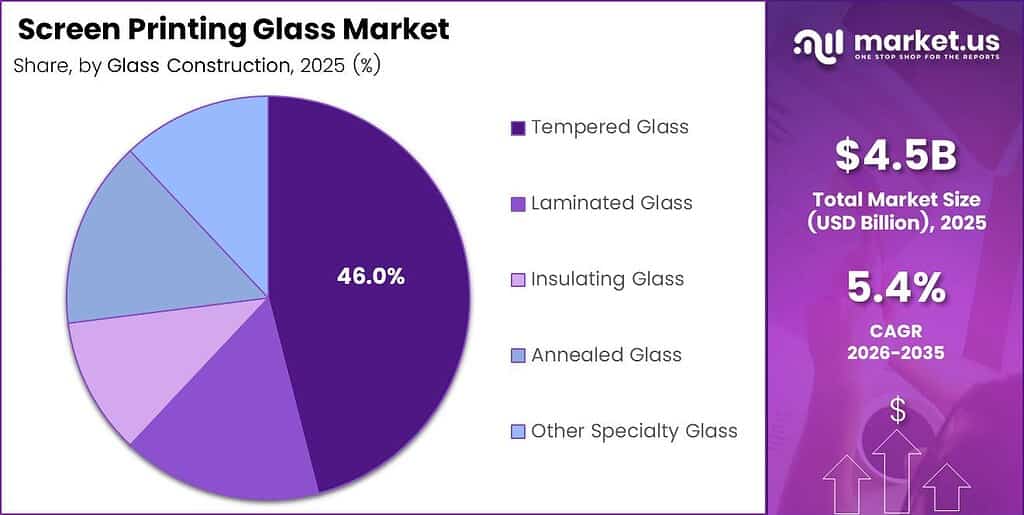
- By Glass Construction, Tempered Glass leads with a 46.00% share in 2025.
- By Application, Architectural Glass accounts for the largest share at 34.00% in 2025.
- By End User, Commercial leads with a 43.00% share in 2025.
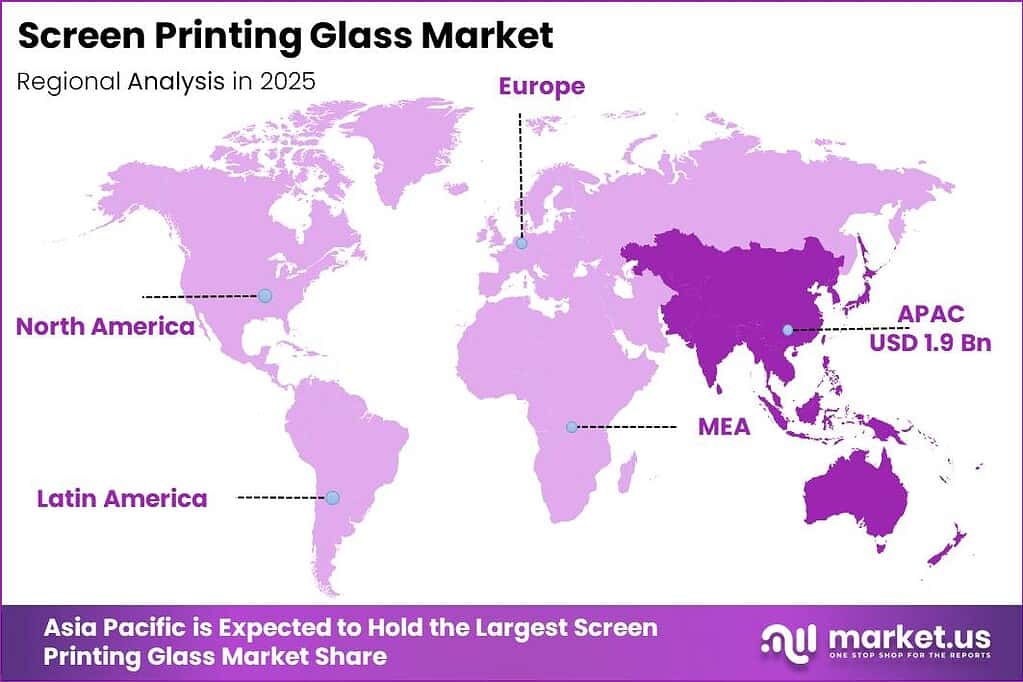
- Asia Pacific is the dominant region, holding 43.00% of the global market, valued at USD 1.9 Billion in 2025.
Government mandates on building energy performance and solar energy deployment are reshaping demand for printed glass products across both developed and emerging markets. Stricter facade efficiency codes in Europe and major Asian cities require glazing that transmits controlled levels of solar radiation, pushing architects toward energy-saving and solar glass with printed functional coatings. These regulatory shifts create durable volume commitments rather than cyclical order patterns, strengthening the investment case for processors able to qualify compliant product lines.
According to the IEA, global renewable-capacity additions increased 16% to 800 GW in 2025, with solar PV additions surpassing 600 GW and cumulative solar PV capacity reaching around 2,800 GW. This scale of deployment requires proportional volumes of solar glass, including antireflective and screen-printed functional surfaces. Processors positioned in solar-glass supply chains can convert this installation pipeline into predictable medium-term order books.
IEA data shows China commissioned nearly 370 GW of solar PV capacity in 2025, 13% higher than in 2024, while Gold Plus Glass announced an INR 2,500 crore investment for capacity expansion and entry into solar-glass manufacturing in January 2025. In the same period, Borosil Renewables approved an INR 950 crore investment for two solar-glass furnaces adding 600 tonnes per day of manufacturing capacity. These capital commitments signal that manufacturers expect solar-glass demand to remain structurally elevated through the forecast period, reducing exposure to near-term volume risk. As per our research, global maritime trade grew 2.2% in 2024 but was projected to slow to 0.5% growth in 2025, a dynamic that adds freight-cost and logistics complexity for processors dependent on cross-border glass substrate supply chains.
Glass Type Analysis
Clear Glass dominates with 34.00% due to universal compatibility across end-use applications.
In 2025, Clear Glass held a dominant market position in the By Glass Type segment of the Screen Printing Glass Market, with a 34.00% share. Clear glass accepts the full range of ceramic, UV, and enamel inks without optical distortion from base tint, making it the default substrate for architectural facades, consumer electronics panels, and interior decoration. Processors who standardize on clear glass benefit from the widest available ink qualification base and the broadest customer addressability.
Extra-Clear Glass serves applications where color neutrality and high light transmission are critical, including premium solar modules and high-end architectural curtain walls. Its low-iron composition allows screen-printed functional coatings to perform without the green-tint interference that limits standard clear glass. Buyers specifying extra-clear glass typically accept a price premium, creating higher-margin opportunities for processors able to hold tight optical consistency across production runs.
Tinted Glass and Energy-Saving Glass address different ends of the solar-control spectrum. Tinted substrates reduce visible light transmission and solar heat gain for commercial glazing in high-solar-irradiance regions. Energy-Saving Glass incorporates low-emissivity coatings that retain heat in cold climates while screen-printed patterns add branding or privacy functions. The European Union added nearly 85 GW of renewable capacity in 2025, approximately 10% more than in 2024, with solar PV accounting for almost 70 GW, reinforcing demand for energy-performing glazing products across the continent.
Solar Glass is a structurally growing sub-segment driven by the global photovoltaic installation pipeline. India’s annual renewable-capacity additions increased almost 60% in 2025, including almost 50 GW of solar PV additions, creating a direct demand pull for printed solar glass in one of the fastest-expanding installation markets. Solar glass, tinted glass, and energy-saving glass collectively hold the remaining share of the By Glass Type segment not captured by clear and extra-clear substrates.
Printing Type Analysis
Ceramic Screen Printing dominates with 55.00% due to thermal durability across automotive and architectural applications.
In 2025, Ceramic Screen Printing held a dominant market position in the By Printing Type segment of the Screen Printing Glass Market, with a 55.00% share. Ceramic inks fuse permanently into glass during tempering, producing patterns that resist abrasion, UV exposure, moisture, and chemical cleaning over decades of service life. This permanence makes ceramic printing the mandated choice for automotive black frits, architectural spandrel panels, and solar module borders where long-term optical stability is a contractual requirement.
UV Screen Printing serves applications where lower curing temperatures are acceptable and faster line speeds are commercially valuable. UV-cured inks do not require a tempering furnace pass, reducing energy consumption per unit and enabling decorative printing on heat-sensitive substrates. This positions UV printing competitively for interior glass decoration, signage, and consumer electronics covers where permanence requirements are less demanding than in automotive or facade glazing.
Enamel Screen Printing occupies a specialized position between ceramic and UV technologies, offering vitreous glass-like finishes for appliance panels, cookware lids, and premium architectural glass. Enamel formulations fuse at intermediate temperatures and produce rich, opaque color effects that ceramic inks do not always replicate economically at small batch sizes. UV screen printing and enamel screen printing collectively hold the remaining share not captured by the ceramic segment.
Glass Construction Analysis
Tempered Glass dominates with 46.00% due to mandatory safety requirements in automotive and commercial glazing.
In 2025, Tempered Glass held a dominant market position in the By Glass Construction segment of the Screen Printing Glass Market, with a 46.00% share. Building codes and automotive safety standards require tempered glass in most occupied spaces and vehicle glazing positions, creating a structurally captive demand base. The tempering process also permanently fuses ceramic screen-printed inks during the same heat cycle, reducing processing steps and aligning the dominant construction type with the dominant printing technology.
Laminated Glass serves applications where post-breakage fragment retention is the primary safety requirement, including automotive windshields, overhead architectural glazing, and hurricane-resistant facades. Screen printing on laminated glass requires ink compatibility with interlayer adhesion and PVB or EVA film chemistry, creating a technical qualification barrier that limits the number of certified processors. This barrier supports pricing power for converters with validated laminated-glass printing programs.
Insulating Glass units incorporate printed layers that contribute to solar-control, decorative, and privacy functions while maintaining their sealed double or triple-pane thermal performance. Printing must be applied before unit assembly, requiring tight coordination between the printing line and the insulating-glass fabrication schedule. Annealed Glass and Other Specialty Glass types hold the remaining construction share, serving lower-stress applications in interior partitions, display cases, and niche decorative uses.
Application Analysis
Architectural Glass dominates with 34.00% due to mandatory printed elements in commercial facade specifications.
In 2025, Architectural Glass held a dominant market position in the By Application segment of the Screen Printing Glass Market, with a 34.00% share. Commercial facades, office towers, retail storefronts, and residential curtain walls require screen-printed spandrel panels, frit patterns, and solar-control gradients that are specified at the design stage and cannot be substituted without re-engineering the building envelope. This design-in dependency creates order stability across multi-year construction project timelines.
Automotive Glass is the second-largest application and the most technically demanding segment for screen-printed functional patterns. Black ceramic frits, antenna bus bars, defrost circuits, and sensor-zone masking patterns must meet tight automotive OEM dimensional and durability standards. Vehicle programs launched in 2024 and 2025 increased the use of panoramic roofs and larger windshields, raising printed area per vehicle even where total production volumes remain flat.
Solar Glass is the fastest-growing application category, driven by the global photovoltaic capacity build-out. In August 2025, India approved a 3D Glass Solutions advanced-packaging and embedded-glass-substrate project with planned annual capacity of about 69,600 glass-panel substrates, 50 million assembled units, and 13,200 3DHI modules, signaling that printed glass is entering next-generation semiconductor packaging applications alongside conventional solar modules. The United States installed 49 GW of renewable capacity in 2025, a 10% decrease from the previous year, indicating that policy uncertainty can interrupt even large installation markets.
Consumer Electronics, Interior Decoration, and Advertising and Signage serve shorter-cycle, design-driven demand. Consumer electronics cover glass requires precise color matching and optical clarity standards that reward processors with tight process controls. Interior Decoration and Advertising and Signage benefit from short run lengths and rapid design turnover, favoring processors with flexible screen-change capabilities. These three sub-segments, together with Other Applications, hold the remaining share of the By Application segment.
End User Analysis
Commercial dominates with 43.00% due to high-volume facade and interior specification requirements.
In 2025, Commercial held a dominant market position in the By End User segment of the Screen Printing Glass Market, with a 43.00% share. Commercial construction projects specify screen-printed glass at the architectural design stage across facades, partitions, balustrades, and signage elements, creating predictable, project-linked volumes that processors can plan production schedules around. Corporate real estate development, hospitality construction, and retail fit-out cycles sustain commercial demand even when residential activity softens.
Residential End Users adopt screen-printed glass primarily through premium window systems, decorative interior partitions, and kitchen splashbacks. Residential uptake is more price-sensitive than commercial procurement and more dependent on discretionary spending cycles, making this segment more volatile across economic downturns. By contrast, the trend toward home renovation and design customization supports gradual volume expansion for printed decorative glass in upper-income residential construction.
Industrial End Users include solar-module fabricators, appliance manufacturers, and specialized equipment producers who require printed glass as a functional component rather than an aesthetic element. Industrial demand is tightly coupled to capital expenditure cycles in manufacturing and energy sectors. Residential and Industrial end users collectively hold the remaining share of the By End User segment not captured by the Commercial category.
Key Market Segments
By Glass Type
- Clear Glass
- Extra-Clear Glass
- Tinted Glass
- Energy-Saving Glass
- Solar Glass
By Printing Type
- Ceramic Screen Printing
- UV Screen Printing
- Enamel Screen Printing
By Glass Construction
- Tempered Glass
- Laminated Glass
- Insulating Glass
- Annealed Glass
- Other Specialty Glass
By Application
- Architectural Glass
- Automotive Glass
- Solar Glass
- Consumer Electronics
- Interior Decoration
- Advertising and Signage
- Other Applications
By End User
- Commercial
- Residential
- Industrial
Regional Analysis
Asia Pacific Dominates the Screen Printing Glass Market with a Market Share of 43.00%, Valued at USD 1.9 Billion
Asia Pacific commands a 43.00% share of the global screen printing glass market, valued at USD 1.9 Billion in 2025. China, Japan, South Korea, and India concentrate the region’s glass manufacturing base, automotive assembly capacity, and solar-module production volume. This industrial co-location means printed glass travels short distances from processor to end-use factory, reducing logistics cost and qualification cycle length compared to regions dependent on imported substrates.
India is the fastest-growing regional market within Asia Pacific, supported by rapidly expanding solar PV installation, new automotive OEM investments, and government-backed electronics manufacturing schemes. In August 2025, Corning and Optiemus Infracom inaugurated the first phase of a tempered cover-glass facility in India with an INR 70 crore initial investment and annual capacity of 25 million units, with Phase II planned to reach 200 million units annually with an additional INR 800 crore investment. This signals that global glass technology leaders view India as a structurally important production and consumption market through the forecast period.
Europe and North America represent mature but technically demanding markets where energy-code compliance and automotive OEM qualification standards drive premium-priced screen-printed glass consumption. The Gulf Cooperation Council is an emerging demand center for high-performance architectural glazing linked to urban construction programs. Latin America and the Middle East and Africa collectively hold smaller but growing shares, with domestic fabrication capacity expanding in Brazil, Mexico, South Africa, and Egypt as construction activity rises.
Key Regions and Countries
North America
- US
- Canada
Europe
- Germany
- France
- The UK
- Spain
- Italy
- Rest of Europe
Asia Pacific
- China
- Japan
- South Korea
- India
- Australia
- Rest of APAC
Latin America
- Brazil
- Mexico
- Rest of Latin America
Middle East and Africa
- GCC
- South Africa
- Rest of MEA
Drivers
Automotive glazing is evolving from a passive enclosure element into a functional platform for sensors, antennas, defrost circuits, and head-up-display masking. Vehicle programs launched in 2024 and 2025 increased panoramic roof and large windshield adoption, raising the number of screen-printing passes per vehicle to 3 to 6 across front, rear, and roof glass positions. Converters able to qualify low-defect, high-durability printed patterns gain defensible margin in a segment where OEM cost-down pressure is constant.
Solar-module glass throughput adds a complementary growth vector, with demand concentrated in China, India, Southeast Asia, Europe, and North America. Energy-performing facade adoption creates a medium-term demand layer as building codes in Europe, the Gulf Cooperation Council, and major Asian cities require glazing with quantified solar-control performance. Appliance premiumization and electronics cover-glass customization extend printed glass demand into shorter-cycle consumer markets, supporting broader revenue diversification for processors with multi-application capabilities.
| Driver | (~) % Impact on CAGR Forecast | Geographic Relevance | Impact Timeline |
|---|---|---|---|
| Automotive glazing functionalization | +1.1% | Global; strongest in China, Europe, North America, Japan and South Korea | Short term (≤ 2 years) |
| Solar-module glass throughput | +0.9% | China, India, Southeast Asia, Europe and North America | Short term (≤ 2 years) |
| Energy-performing façade adoption | +0.7% | Europe, Gulf Cooperation Council, North America and major Asian cities | Medium term (2–4 years) |
| Appliance premiumization | +0.5% | Asia-Pacific, Europe and North America | Short term (≤ 2 years) |
| Electronics cover-glass customization | +0.4% | China, Taiwan, South Korea, Japan and Southeast Asia | Medium term (2–4 years) |
Restraints
Screen-printed glass processors depend on energy-intensive tempering, heat-strengthening, and ceramic-enamel curing operations that expose them to electricity and natural-gas price volatility even when substrate costs are stable. Customer quotations fixed for 6 to 12 months cannot absorb abrupt energy-cost increases, and a sustained 10% rise in delivered energy expense can compress conversion margins by 100 to 250 basis points in plants where surcharges are unavailable. This dynamic deducts an estimated 1.0% from the 5.4% baseline CAGR, particularly in Europe, North America, and Japan.
Construction-project financing delays and automotive supplier price-down pressure compound the energy-cost burden by compressing order visibility and negotiating leverage simultaneously. Environmental permitting constraints in Europe, North America, China, Japan, and South Korea add regulatory timeline risk to capacity expansion decisions. Premium glazing retrofit limits reduce the addressable replacement market in cost-sensitive building segments, collectively creating a multi-factor restraint environment that rewards processors with diversified application portfolios and energy-hedging programs.
| Restraint | (~) % Impact on CAGR Forecast | Geographic Relevance | Impact Timeline |
|---|---|---|---|
| High-temperature energy cost burden | -1.0% | Europe, North America, Japan and import-dependent manufacturing hubs | Short term (≤ 2 years) |
| Construction-project financing delays | -0.7% | Europe, North America, China and selected emerging markets | Short term (≤ 2 years) |
| Automotive supplier price-down pressure | -0.6% | Global automotive production centers | Short term (≤ 2 years) |
| Environmental permitting constraints | -0.5% | Europe, North America, China, Japan and South Korea | Medium term (2–4 years) |
| Premium glazing retrofit limits | -0.3% | Global; most material in cost-sensitive building markets | Medium term (2–4 years) |
Challenges
Ceramic ink qualification presents a systems-level bottleneck because color, opacity, adhesion, chemical resistance, firing profile, and optical appearance must remain consistent across glass suppliers, mesh counts, printing equipment, and furnace cycles. Automotive and facade specifications require accelerated weathering, humidity, abrasion, UV, and thermal-cycling validation before a formulation change is accepted, extending material approval cycles to roughly 6 to 18 months. A 1 to 2% defect-rate increase from a screen, ink, or substrate change can materially reduce first-pass yield because downstream tempering prevents economical rework.
This friction creates an estimated 0.8% drag on attainable CAGR, and manufacturers need standardized color-management systems, dual-qualified ink architectures, automated vision inspection, and data-linked furnace controls to reduce qualification risk. Multi-layer registration control, specialist operator scarcity, substrate quality variation, and small-batch changeover losses add compounding drag totaling an additional estimated 1.8% across the four challenge categories. Processors who invest in precision inspection and digital process integration earliest will capture the qualification contracts that less-automated competitors cannot reliably service.
| Challenge | (~) % CAGR Friction Drag | Geographic Relevance | Mitigation Horizon |
|---|---|---|---|
| Ceramic ink qualification complexity | -0.8% | Global; acute in automotive, solar and architectural supply chains | Medium term (2–4 years) |
| Multi-layer registration control | -0.6% | Global advanced-glazing manufacturing hubs | Short term (≤ 2 years) |
| Specialist operator scarcity | -0.5% | Europe, North America, Japan, South Korea and India | Medium term (2–4 years) |
| Substrate quality variation | -0.4% | Global; concentrated in cross-border supply chains | Short term (≤ 2 years) |
| Small-batch changeover losses | -0.3% | North America, Europe and fragmented Asian fabrication markets | Medium term (2–4 years) |
Opportunities
Printed smart-glass electronics represent the highest-value revenue opportunity available to processors willing to move beyond decorative borders and conventional functional marks. Where functional printed features reduce separate-wire, bracket, or film requirements by approximately 10 to 25% per assembly, processors improve unit economics through lower component count and more automated installation. A successful shift toward qualified smart-glazing modules could expand gross-margin potential by roughly 300 to 600 basis points versus commodity decorative work, with an estimated +1.2% upside above the 5.4% baseline CAGR.
Building-integrated photovoltaic glazing and digital-to-screen hybrid production offer complementary long-term and medium-term revenue streams. Regional fabrication roll-ups in India, Southeast Asia, North America, Europe, and Latin America allow well-capitalized processors to consolidate fragmented local capacity and capture scale advantages in qualification and logistics. Circular cullet traceability services in Europe, North America, Japan, and South Korea create a service-revenue layer that extends processor value beyond the glass panel itself, rewarding early movers who build traceability systems before regulatory mandates formalize the requirement.
| Opportunity | (~) % Potential CAGR Upside | Geographic Relevance | Execution Window |
|---|---|---|---|
| Printed smart-glass electronics | +1.2% | North America, Europe, China, Japan, South Korea and Gulf Cooperation Council | Medium term (2–4 years) |
| Building-integrated photovoltaic glazing | +1.0% | Europe, China, Japan, South Korea, North America and Gulf Cooperation Council | Long term (≥ 4 years) |
| Digital-to-screen hybrid production | +0.8% | Global; strongest in fragmented architectural and appliance markets | Medium term (2–4 years) |
| Regional fabrication roll-ups | +0.6% | India, Southeast Asia, North America, Europe and Latin America | Medium term (2–4 years) |
| Circular cullet traceability services | +0.4% | Europe, North America, Japan and South Korea | Long term (≥ 4 years) |
Key Company Insights
AGC Inc. reported FY2024 consolidated net sales of JPY 2,067.6 billion, up 2.4% from FY2023, with Electronics segment sales rising 16.4% to JPY 364.5 billion while Architectural Glass sales declined 8.0% to JPY 438.0 billion. This divergence signals that AGC’s value lies increasingly in high-tech glass rather than standard construction glazing. The company forecast FY2025 net sales of JPY 2,150.0 billion and capital investment of JPY 240 billion, reflecting continued confidence in long-cycle capacity commitments despite near-term architectural weakness.
Saint-Gobain S.A. operates across architectural, automotive, and high-performance glass markets with a manufacturing footprint spanning more than 70 countries, giving it supply-chain resilience that regional processors cannot easily replicate. India added more than 6 GW of wind capacity in 2025, approximately double the prior year’s additions, illustrating the energy-infrastructure scale in which Saint-Gobain’s building-solutions and glass divisions compete for specification. In September 2025, Asahi India Glass completed a qualified institutional placement raising INR 1,000 crore through the issue of 11,837,261 equity shares at INR 844.79 per share, demonstrating that Indian glass producers are actively building capital reserves to fund capacity expansion ahead of infrastructure-driven demand cycles.
Key Players
- AGC Inc.
- Saint-Gobain S.A.
- NSG Group
- Guardian Glass
- Vitro, S.A.B. de C.V.
- SCHOTT AG
- Xinyi Glass Holdings Limited
- Central Glass Co., Ltd.
- Sisecam Group
- Cardinal Glass Industries
- Fuyao Glass Industry Group Co., Ltd.
- Taiwan Glass Industry Corporation
- Glas Trosch Group
- Viracon, Inc.
- Asahi India Glass Limited
Recent Developments
- August 2025 – Apple committed USD 2.5 billion to Corning for manufacturing all iPhone and Apple Watch cover glass in Harrodsburg, Kentucky, consolidating a high-volume printed cover-glass supply chain within the United States.
- September 2026 – Borosil Renewables revised the estimated cost of its 600-tonnes-per-day solar-glass furnace project to approximately INR 1,100 crore, reflecting updated construction and equipment pricing for one of India’s largest solar-glass capacity additions.
- August 2026 – AGI Greenpac approved approximately INR 700 crore investment for a Madhya Pradesh container-glass plant planned to add 500 tonnes per day of output and expand capacity by approximately 25%.
- February 2024 – Arglass secured more than USD 230 million for a second glass-container production facility in Valdosta, Georgia, adding domestic manufacturing capacity in the southeastern United States.
- September 2026 – Xinmin Glass Egypt began construction of a USD 70 million, 163,000-square-metre glassware plant designed to produce more than 516 million pieces annually, marking a significant capacity expansion in the North Africa glass manufacturing base.
Report Scope
| Report Features | Description |
|---|---|
| Market Value (2025) | USD 4.5 Billion |
| Forecast Revenue (2035) | USD 7.7 Billion |
| CAGR (2026-2035) | 5.4% |
| Base Year for Estimation | 2025 |
| Historic Period | 2020-2024 |
| Forecast Period | 2026-2035 |
| Report Coverage | Revenue Forecast, Market Dynamics, Market Opportunity Analysis, Technology and Innovation Landscape, Competitive Landscape, Recent Developments |
| Segments Covered | By Glass Type (Clear Glass, Extra-Clear Glass, Tinted Glass, Energy-Saving Glass, Solar Glass), By Printing Type (Ceramic Screen Printing, UV Screen Printing, Enamel Screen Printing), By Glass Construction (Tempered Glass, Laminated Glass, Insulating Glass, Annealed Glass, Other Specialty Glass), By Application (Architectural Glass, Automotive Glass, Solar Glass, Consumer Electronics, Interior Decoration, Advertising and Signage, Other Applications), By End User (Commercial, Residential, Industrial) |
| Regional Analysis | North America (US and Canada), Europe (Germany, France, The UK, Spain, Italy, and Rest of Europe), Asia Pacific (China, Japan, South Korea, India, Australia, and Rest of APAC), Latin America (Brazil, Mexico, and Rest of Latin America), Middle East and Africa (GCC, South Africa, and Rest of MEA) |
| Competitive Landscape | AGC Inc., Saint-Gobain S.A., NSG Group, Guardian Glass, Vitro, S.A.B. de C.V., SCHOTT AG, Xinyi Glass Holdings Limited, Central Glass Co., Ltd., Sisecam Group, Cardinal Glass Industries, Fuyao Glass Industry Group Co., Ltd., Taiwan Glass Industry Corporation, Glas Trosch Group, Viracon, Inc., Asahi India Glass Limited |
| Customization Scope | Customization for segments, region/country-level will be provided. Additional customization can be done based on requirements. |
| Purchase Options | We have three licenses to opt for: Single User License, Multi-User License (Up to 5 Users), Corporate Use License (Unlimited User and Printable PDF) |





































