


Report Overview
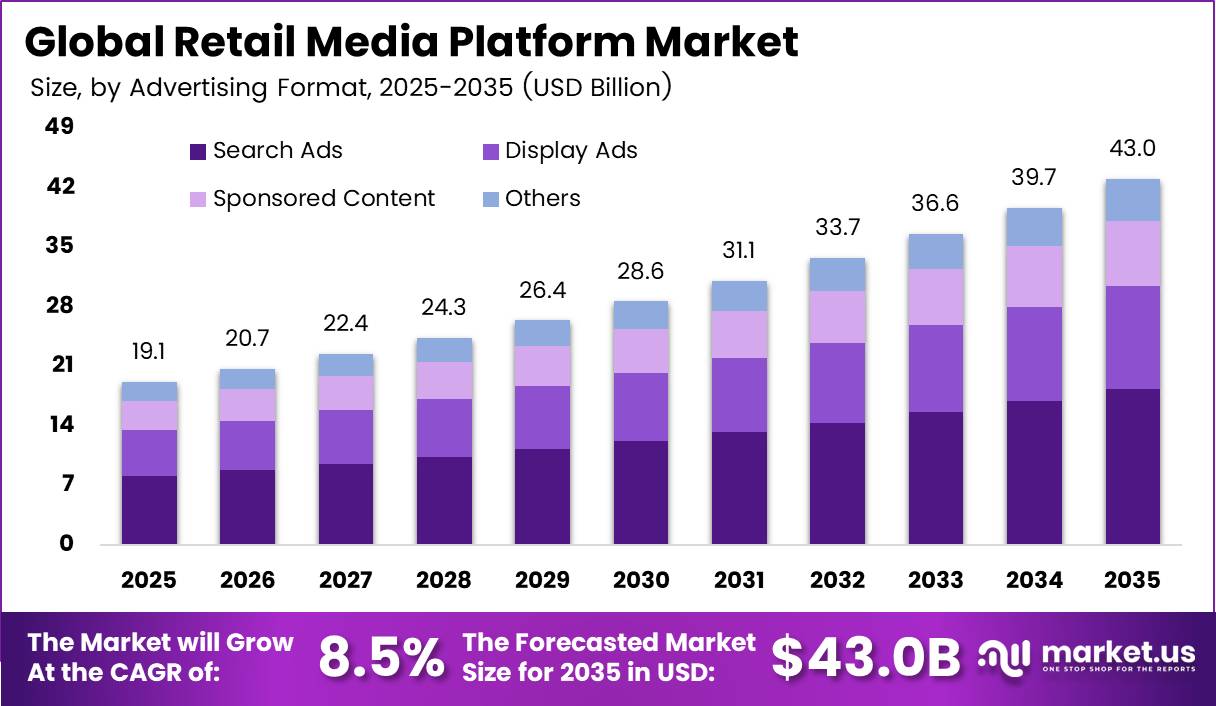
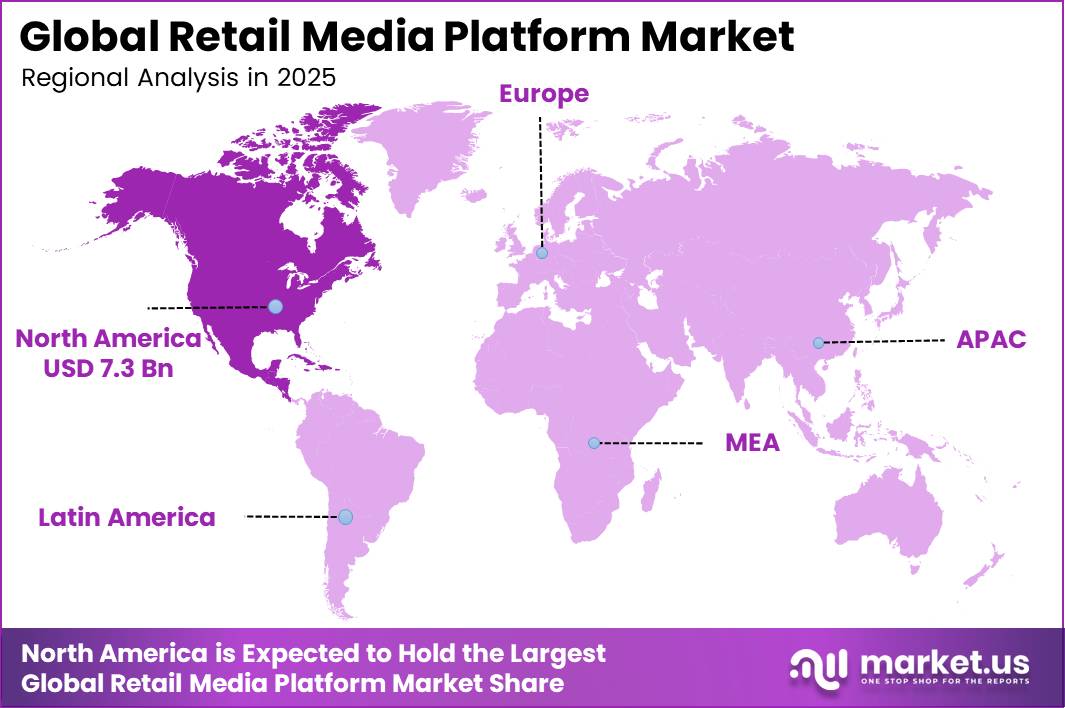
The Global Retail Media Platform Market stands at USD 19.1 billion in 2025 and is set to reach USD 43.0 billion by 2035, growing at a CAGR of 8.5% during the forecast period. This growth tracks closely with the expansion of online retail itself. North America leads the market with a 38.4% share, worth USD 7.3 billion in revenue.
The U.S. Census Bureau reports that e-commerce sales in the first quarter of 2026 rose 9.8% year over year and made up 16.9% of total U.S. retail sales. As more shopping activity moves online, retailers gain more digital space to sell ads next to products, which fuels demand for retail media platforms. Brands are following this shift too, since sponsored placements sit right where shoppers make buying decisions.
North America leads come from the scale of U.S. e-commerce infrastructure and retailer ad networks already in place. Total U.S. retail sales reached USD 1,929.0 billion in the first quarter of 2026, giving retailers a massive base of shopper data and traffic to monetize through ads. Large retailers in the region have built dedicated media arms that plug directly into this traffic.
Key Takeaways
- The Global Retail Media Platform Market is valued at USD 19.1 billion in 2025 and will reach USD 43.0 billion by 2035.
- The market will grow at a CAGR of 8.5% between 2026 and 2035.
- Search Ads lead the Advertising Format segment with a 42.6% share.
- Cloud deployment leads the Deployment segment with a 70.1% share.
- Retailer-Owned Media Networks lead the Platform Type segment with a 58.3% share.
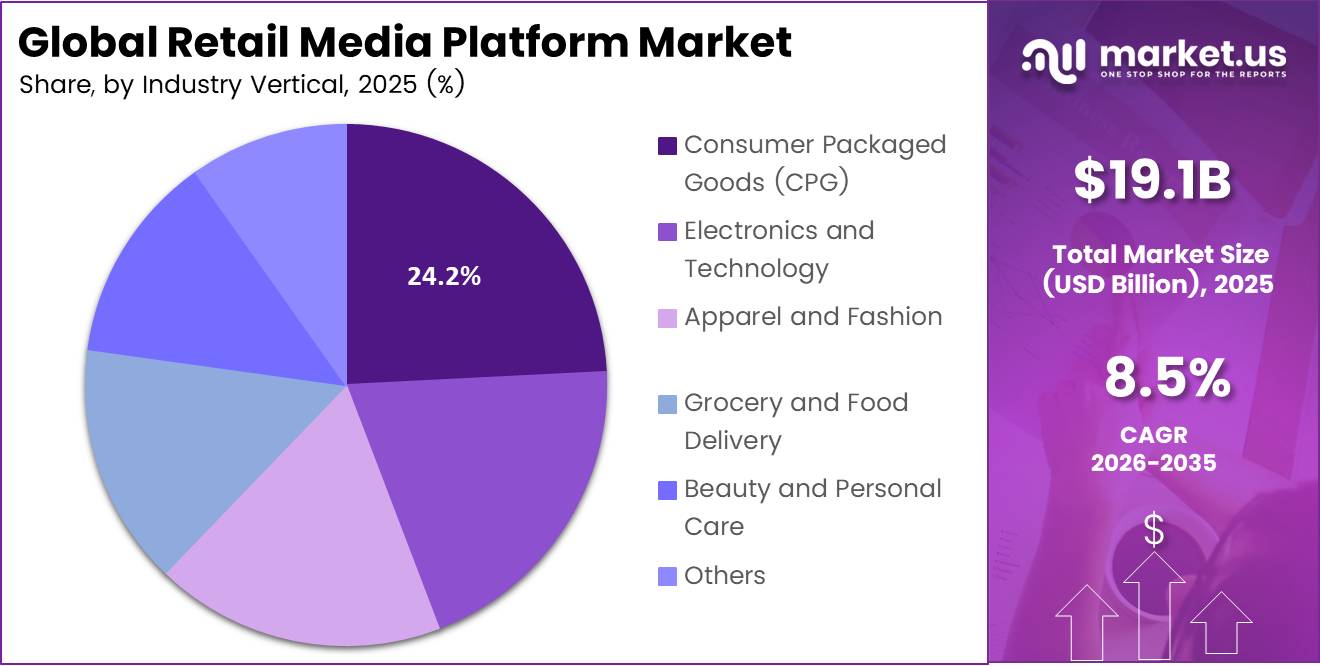
- Consumer Packaged Goods (CPG) leads the Industry Vertical segment with a 24.2% share.
- North America dominates the market with a 38.4% share, generating USD 7.3 billion in revenue.
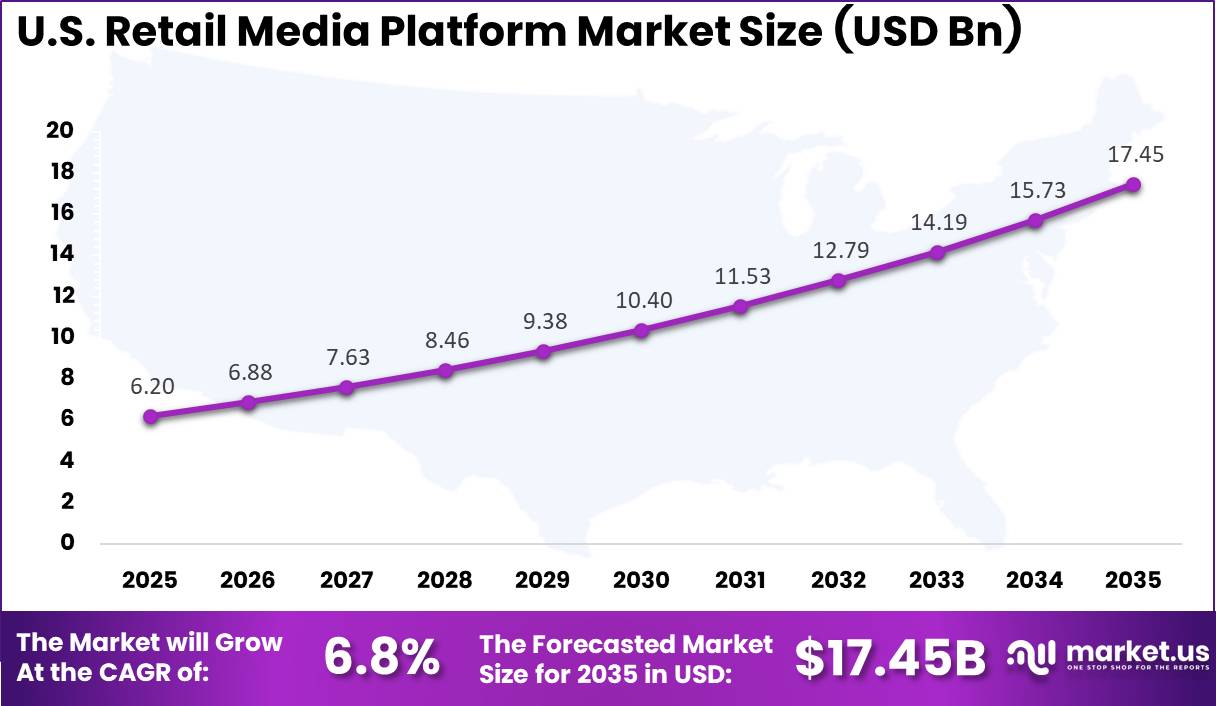
- The US alone contributes USD 6.2 billion, growing at a CAGR of 6.8%.
By Advertising Format
Search Ads dominates with 42.6% due to high purchase intent shopper matching.
Search ads lead the advertising format segment because they connect directly to shopper intent at the exact moment someone types a product name into a retailer’s site. Retail media spend in the US alone is projected to top USD 60 billion in 2025 and near USD 70 billion in 2026, and search remains the workhorse format that captures this spend first.
Sponsored Content is the fastest-growing sub-segment because retailers now push branded video, shoppable articles, and influencer style posts inside their apps to hold shopper attention longer than a plain text ad. The OECD notes that cloud-based data tools now let retailers build these richer formats faster and test them across millions of shoppers at low cost.
By Deployment
Cloud dominates with 70.1% due to elastic scaling for ad auctions.
Cloud deployment leads because retail media platforms must run millions of ad auctions in real time across shopper sessions, and cloud infrastructure lets retailers add server capacity instantly during peak shopping periods without buying new hardware. The IEA reports that global data centre electricity consumption reached around 415 terawatt hours in 2024 and is set to double by 2030, showing how fast cloud infrastructure is expanding to support digital services like ad platforms.
This growth gives retailers access to more computing power at lower cost per unit, making cloud the natural home for ad serving systems. On-premises deployment is growing faster in percentage terms because some large retailers and grocery chains with strict data privacy needs are building private server rooms to keep shopper purchase records fully in-house, away from shared cloud tenants.
By Platform Type
Retailer-Owned Media Networks dominate with 58.3% due to exclusive first-party shopper data access.
Retailer-owned media networks lead this segment because only the retailer holds the actual purchase history and browsing data of its shoppers, letting it sell far more precise ad targeting than any outside platform can offer. Large retailers now treat this owned data as a core profit driver, with advertising and membership income making up roughly a third of quarterly profit for some major chains, based on recent corporate earnings disclosures.
Integrated Media Platforms are the fastest-growing sub-segment because brands are tired of managing separate ad accounts for every retailer and now prefer tools that combine campaign management across multiple retail partners into one dashboard. This integrated approach saves brand teams time and lets them shift budget between retailers based on live performance data rather than guesswork.
By Industry Vertical
Consumer Packaged Goods (CPG) dominates with 24.2% due to high-volume repeat-purchase categories.
Consumer Packaged Goods leads the industry vertical segment because grocery and household staple brands sell high-frequency repeat-purchase items, which makes retail media a natural fit since shoppers return to buy the same products every few weeks. Large CPG advertisers now treat retail media as core budget, with the channel growing fast enough that some corporate reports describe it replacing a meaningful share of traditional TV and social ad budgets inside CPG marketing teams.
Grocery and Food Delivery is the fastest-growing sub-segment because online grocery ordering keeps expanding, and grocery apps now embed sponsored product slots directly into search results and recipe pages where shoppers build their carts.
The US Census Bureau recorded first quarter 2026 e-commerce sales climbing 9.8% year over year, and grocery delivery apps are capturing a growing slice of that online spend, which pulls more ad dollars toward this vertical. As delivery apps add more retail partners, this vertical is closing the gap with CPG in ad spend share.
Key Market Segments
By Advertising Format
- Search Ads
- Display Ads
- Sponsored Content
- Others
By Deployment
- Cloud
- On-Premises
By Platform Type
- Retailer-Owned Media Networks
- Third-Party Media Networks
- Integrated Media Platforms
By Industry Vertical
- Consumer Packaged Goods (CPG)
- Electronics and Technology
- Apparel and Fashion
- Grocery and Food Delivery
- Beauty and Personal Care
- Others
Geopolitical Impact Analysis
Trade tensions are pushing up costs across the technology hardware that retail media platforms run on, even though the ad space itself is digital. The Budget Lab at Yale reports that the overall U.S. average effective tariff rate hit 18.6% in 2025, the highest level since 1933, after a wave of new duties. Semiconductor-linked tariffs matter directly here, since retail media platforms depend on servers, data center chips, and networking gear to run ad auctions and targeting engines.
Tariffs on Chinese semiconductors rose from 25% to 50% starting in 2025, and finished electronics containing chips face added import duties too. This raises the cost of building and scaling the cloud infrastructure that powers 70.1% of retail media deployments. Higher hardware costs can slow data center expansion plans for retailers building out their own ad tech stacks.
Consumer-facing tariffs also squeeze the CPG and apparel brands that buy the most retail media ad space. The Budget Lab notes short-run price increases of 39% for shoes and 37% for apparel tied to 2025 tariff actions. When brands face higher input costs, they often cut discretionary marketing budgets first, which can slow ad spend growth on retail media platforms even as retailer ad inventory keeps expanding.
U.S. real GDP growth is projected to run 0.5 percentage points lower in both 2025 and 2026 due to these tariffs, which can dampen overall consumer spending and, in turn, retail sales volume that retail media ads are built to promote.
Regional Analysis
North America dominates the Retail Media Platform Market, holding a 38.4% share and generating USD 7.3 billion in revenue. The region’s lead rests on the sheer scale of its e-commerce base, with U.S. retail e-commerce sales reaching USD 302.3 billion in the first quarter of 2026 alone on an unadjusted basis.
Large U.S. retailers have already built dedicated advertising arms that plug directly into their storefronts and apps, letting brands buy search and display placements right next to products shoppers are already browsing. Canada adds smaller but steady growth to the regional total, supported by grocery and pharmacy chains that are launching their own sponsored product programs.
Europe holds a meaningful share of the global market, supported by strong e-commerce adoption across Germany, France, and the UK. Retailers in these markets are building sponsored product programs modeled on North American leaders, while strict data privacy rules under regional regulation push more retailers toward first-party data-based ad targeting. Grocery and fashion retailers across the region are the biggest adopters of retail media tools so far.
The United States drives most of this activity, contributing USD 6.2 billion to the regional total and growing at a CAGR of 6.8%, backed by a retail sector that logged USD 1,929.0 billion in total quarterly sales.
The region benefits from mature payment systems, high broadband penetration, and a retail sector that has invested early in first-party data tools, which advertisers need now that third-party cookies are being phased out across major browsers. This head start in data infrastructure gives North American retailers an edge in offering precise ad targeting, which keeps brand spend flowing into the region’s platforms.
Key Regions and Countries
North America
- US
- Canada
Europe
- Germany
- France
- The UK
- Spain
- Italy
- Rest of Europe
Asia Pacific
- China
- Japan
- South Korea
- India
- Australia
- Rest of APAC
Latin America
- Brazil
- Mexico
- Rest of Latin America
Middle East and Africa
- GCC
- South Africa
- Rest of MEA
Market Dynamics
Drivers
| Driver | (~) % CAGR | Geographic Relevance | Impact Timeline |
|---|---|---|---|
| E-commerce traffic concentration on retailer properties | +3.0% | North America, Europe, Asia-Pacific | Short term (≤ 2 years) |
| Shift of CPG ad budgets into onsite retail media | +2.2% | Global | Short term (≤ 2 years) |
| First-party shopper data replacing third-party cookies | +1.5% | US, EU, UK | Medium term (2–4 years) |
| Improved closed-loop attribution and ROAS measurement | +1.2% | Global tier-1 retailers | Medium term (2–4 years) |
| High-margin monetization of digital shelf and search | +0.9% | Global | Long term (≥ 4 years) |
| Retail media integration into omnichannel shopper journeys | +0.7% | Developed markets | Medium term (2–4 years) |
E-commerce traffic concentration on retailer properties
In the 2024–2026 window, rapid growth in digital retail and marketplace penetration has concentrated a rising share of product search and purchase intent on large retailer and marketplace properties, with several mature markets seeing more than 50% of branded product discovery begin on retailer sites rather than generic search engines.
This concentration of traffic allows retailers to reconfigure their business models from pure merchandising to hybrid media-network operators, capturing ad yields that can exceed traditional retail operating margins by 5–10 percentage points per ad dollar, while CPG advertisers are shifting mid-funnel spend from open-web display toward retail media formats with reported ROAS uplifts of 20%–40%.
Operationally, this has driven a migration of hundreds of millions of impressions per month into sponsored listings, onsite display, and shoppable video within retailer ecosystems, with some leading platforms reporting digital ad revenue growth above 30% year-on-year over the last 2 years, thereby adding an incremental +3.0% to the retail media platform market’s baseline CAGR as ad budgets structurally follow shopper traffic.
Restraints
| Restraint | (~) % CAGR | Geographic Relevance | Impact Timeline |
|---|---|---|---|
| Strict data protection enforcement on shopper profiling | -2.4% | EU, UK, selected US states | Short term (≤ 2 years) |
| Legal exposure from opaque in-store tracking and biometrics | -1.8% | North America, Europe | Medium term (2–4 years) |
| Retailer IT budget constraints in high-rate environment | -1.5% | Global | Short term (≤ 2 years) |
| Brand-side skepticism on incremental sales attribution | -1.1% | Global advertisers | Medium term (2–4 years) |
| Fragmented standards for data sharing and clean rooms | -0.9% | US, EU | Medium term (2–4 years) |
| Regulatory scrutiny of competition and self-preferencing | -0.8% | US, EU | Long term (≥ 4 years) |
Strict data protection enforcement on shopper profiling
Stringent enforcement of frameworks such as GDPR in the EU and evolving US state-level privacy laws has tightened constraints around consent, profiling, and cross-context data use for retail media, forcing networks to adjust data flows and limit audience granularity, which directly depresses fill rates and CPMs.
Retailers that previously relied on broad behavioral segments now must obtain explicit opt-in for each processing purpose, with many sites seeing opt-in rates fall into the 60%–70% range instead of near-universal coverage, effectively reducing monetizable impressions by up to 30% and cutting campaign-level reach by millions of users per month on large platforms.
Enforcement actions and lawsuits around in-store cameras and biometric tracking, with statutory penalties that can reach several percent of annual turnover, are prompting risk-averse pauses or rollbacks of advanced targeting programs, delaying capital deployment into new formats and compressing operating margins by an estimated 2–3 percentage points where additional compliance tooling and legal overhead add 10%–20% to data governance costs.
Collectively, these dynamics act as a hard restraint on current sales conversion from high-intent audiences, subtracting approximately -2.4% from the otherwise higher retail media platform CAGR by constraining the effective inventory quality that networks can legally sell today.
Challenges
| Challenge | (~) % CAGR | Geographic Relevance | Mitigation Horizon |
|---|---|---|---|
| Cross-retailer performance comparability | -2.1% | Global advertisers | Medium term (2–4 years) |
| Complex omnichannel measurement stacks | -1.9% | US, Europe | Medium term (2–4 years) |
| Talent scarcity in retail media operations | -1.6% | Global | Long term (≥ 4 years) |
| Inventory quality and brand safety assurance | -1.4% | Global | Short term (≤ 2 years) |
| Integration complexity with advertiser martech | -1.2% | Global enterprises | Medium term (2–4 years) |
| Dependence on few mega-retailers for scale | -1.0% | North America, Europe | Long term (≥ 4 years) |
Cross-retailer performance comparability
The absence of standardized reporting and taxonomy across retail media platforms creates a structural vulnerability in how advertisers allocate budgets, as the same campaign can be measured using divergent attribution windows, incrementality methodologies, and conversion definitions, which complicates optimization and caps the market’s potential growth.
Large CPG advertisers often run dozens of concurrent campaigns across different retailers, yet must reconcile impression, click-through, and sales lift metrics manually, with discrepancies of 10%–30% commonly observed between retailer dashboards and independent measurement, driving cautious under-allocation of spend relative to available inventory.
This friction can add weeks of analytical lag per quarterly planning cycle and requires investment in multi-million-dollar analytics stacks and data clean-room projects, increasing non-media costs by an estimated 5%–8% of total retail media budgets and lowering effective ROI.
Over the 2–4-year horizon, advertisers will push for convergence, but until consistent standards emerge, this comparability challenge imposes a persistent drag of roughly -2.1% on the achievable CAGR by slowing the rate at which incremental dollars can confidently move into retail media at scale.
Opportunities
| Opportunity | (~) % CAGR | Geographic Relevance | Execution Window |
|---|---|---|---|
| Offsite media buying using retailer first-party data | +2.3% | North America, Europe | Medium term (2–4 years) |
| Expansion into physical in-store digital media networks | +2.0% | Global grocery and mass retail | Long term (≥ 4 years) |
| Self-serve platforms for mid-market and long-tail brands | +1.7% | Global | Short term (≤ 2 years) |
| Retail media monetization in emerging markets | +1.5% | Asia-Pacific, Latin America, CEE | Long term (≥ 4 years) |
| Premium creative and new formats (video, social, DOOH) | +1.3% | Developed markets | Medium term (2–4 years) |
| Cross-vertical partnerships and data collaboratives | +1.1% | Global | Long term (≥ 4 years) |
Offsite media buying using retailer first-party data
Offsite activation that uses retailers’ high-quality first-party shopper data to power ads across open-web and social inventory remains materially under-penetrated relative to onsite spending and thus represents future white space rather than a fully baked driver in the baseline forecast, with many networks still seeing less than 25% of their total retail media billings come from offsite channels.
As privacy-compliant data collaboration and clean-room tools mature, retailers can license anonymized audience segments to be activated programmatically, lifting effective CPMs by 10%–20% versus non-retail audiences while giving brands cross-environment frequency control and lowering customer acquisition cost by an estimated 5%–15% per incremental converted buyer.
The unit economics are attractive: incremental data and tech costs typically represent single-digit percentages of media spend, while successful offsite campaigns can show sales lift of 3%–6% across thousands of SKUs when matched back to retailer transaction logs, creating margin expansion potential of several percentage points for both retailers and platforms.
If systematically scaled over the next 2–4 years, offsite retail media using retailer first-party data could add roughly +2.3% upside to the market CAGR above the 8.5% baseline by unlocking a sizable portion of currently untapped demand in broader digital channels without cannibalizing onsite revenue.
Key Players Analysis
Tier 1 market leaders include Walmart Connect, Google Ads, Meta Ads, and The Trade Desk, which command the largest global ad footprints tied to retail commerce. Walmart’s global advertising business, anchored by Walmart Connect, grew 46% in fiscal 2025 to reach nearly USD 6.4 billion, up from USD 4.4 billion the year prior.
Management noted that advertising and membership income made up a third of company profit in the most recent quarter, underscoring how central retail media has become to Walmart’s earnings. This scale gives Walmart Connect outsized influence over how CPG and grocery brands allocate ad dollars across retail platforms.
Tier 2 challengers include Criteo, Kroger Precision Marketing, Instacart Ads, Target Roundel, and Yahoo Advertising and PubMatic, which hold strong niche or regional positions rather than the broad scale of Tier 1 players. Kroger Precision Marketing and Instacart Ads focus heavily on grocery and food delivery verticals, leveraging first-party purchase data that CPG brands value for targeting decisions.
Target Roundel and Criteo compete for cross-retailer ad budgets by offering brands a single platform to manage placements across multiple retail partners, a model that is gaining traction as advertisers look to avoid managing separate campaigns for each retailer’s ad network.
Walmart Connect’s rapid revenue growth, consistently outpacing Walmart’s overall retail sales growth over the past several quarters, signals that ad-driven monetization is becoming a bigger profit lever for large retailers. This trend is pushing challenger platforms to invest more heavily in self-serve ad tools and measurement products to keep pace with brand demand for retail media inventory.
Top Key Players in the Market
- Walmart Connect
- Google Ads
- Meta Ads
- Criteo
- The Trade Desk
- Kroger Precision Marketing
- Instacart Ads
- Target Roundel
- Yahoo Advertising and PubMatic
- Other Key Players
Recent Developments
- In February 2026, Walmart reported that its global advertising business, led by Walmart Connect, grew 46% in fiscal 2025 to nearly $6.4 billion in revenue, including VIZIO. Walmart disclosed that Walmart Connect drove 41% year-over-year net sales growth domestically in the fourth quarter of fiscal 2025.
- In April 2025, the Trump Administration imposed a 10% baseline tariff on most imports along with a 34% reciprocal duty on certain goods, directly raising costs for electronics components used in retail media data infrastructure. The Trump Administration raised the tariff rate on Indian imports to 50%, up from 25% previously, affecting sourcing costs for hardware tied to ad tech operations.
- In May 2026, U.S. Census Bureau data showed first quarter 2026 e-commerce sales rising 9.8% year over year to $326.7 billion on a seasonally adjusted basis, expanding the digital ad inventory base for retail media platforms.
Report Scope
| Report Features | Description |
|---|---|
| Market Value (2025) | USD 19.1 billion |
| Forecast Revenue (2035) | USD 43.0 billion |
| CAGR (2026-2035) | 8.5% |
| Base Year for Estimation | 2025 |
| Historic Period | 2020-2024 |
| Forecast Period | 2026-2035 |
| Report Coverage | Revenue Forecast, Market Dynamics, Competitive Landscape, Recent Developments |
| Segments Covered | By Advertising Format (Search Ads, Display Ads, Sponsored Content, Others); By Deployment (Cloud, On-Premises); By Platform Type (Retailer-Owned Media Networks, Third-Party Media Networks, Integrated Media Platforms); By Industry Vertical (Consumer Packaged Goods (CPG), Electronics and Technology, Apparel and Fashion, Grocery and Food Delivery, Beauty and Personal Care, Others) |
| Regional Analysis | North America – US, Canada; Europe – Germany, France, The UK, Spain, Italy, Rest of Europe; Asia Pacific – China, Japan, South Korea, India, Australia, Singapore, Rest of APAC; Latin America – Brazil, Mexico, Rest of Latin America; Middle East & Africa – GCC, South Africa, Rest of MEA |
| Competitive Landscape | Walmart Connect, Google Ads, Meta Ads, Criteo, The Trade Desk, Kroger Precision Marketing, Instacart Ads, Target Roundel, Yahoo Advertising and PubMatic, Other Key Players |
| Customization Scope | Customization for segments and region/country-level will be provided. Moreover, additional customization can be done based on the requirements. |
| Purchase Options | We have three licenses to opt for: Single User License, Multi-User License (Up to 5 Users), Corporate Use License (Unlimited Users and Printable PDF) |





























