


Report Overview
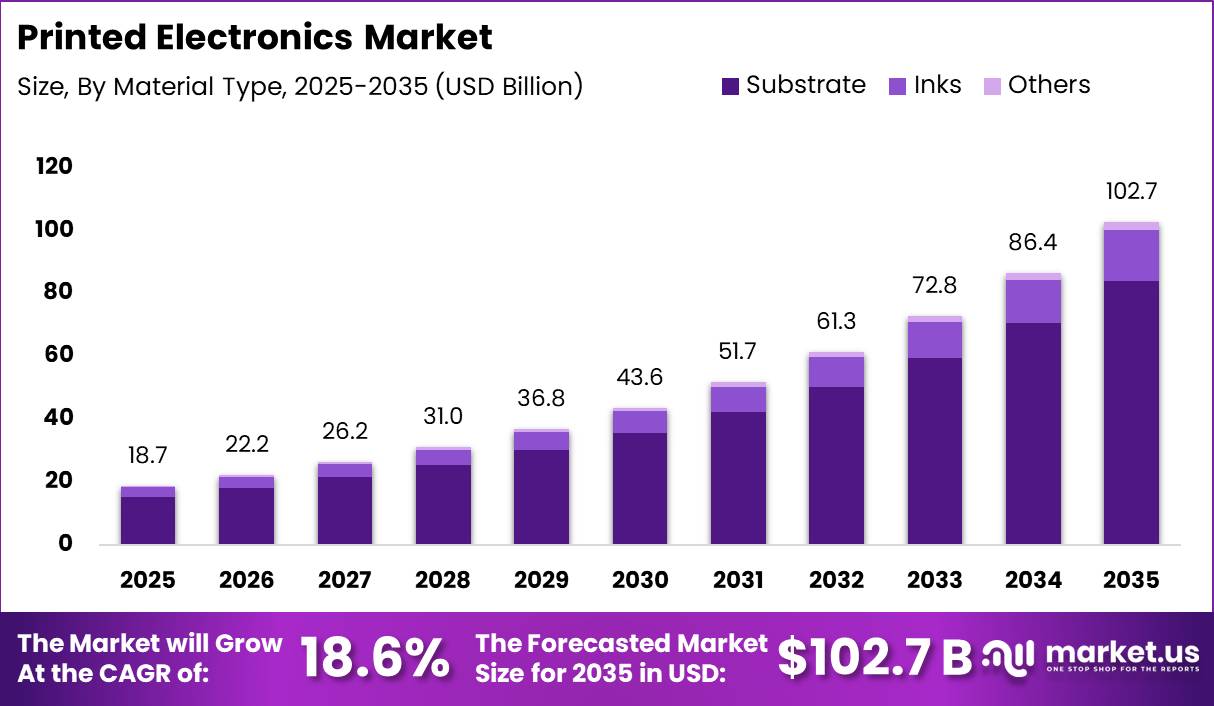
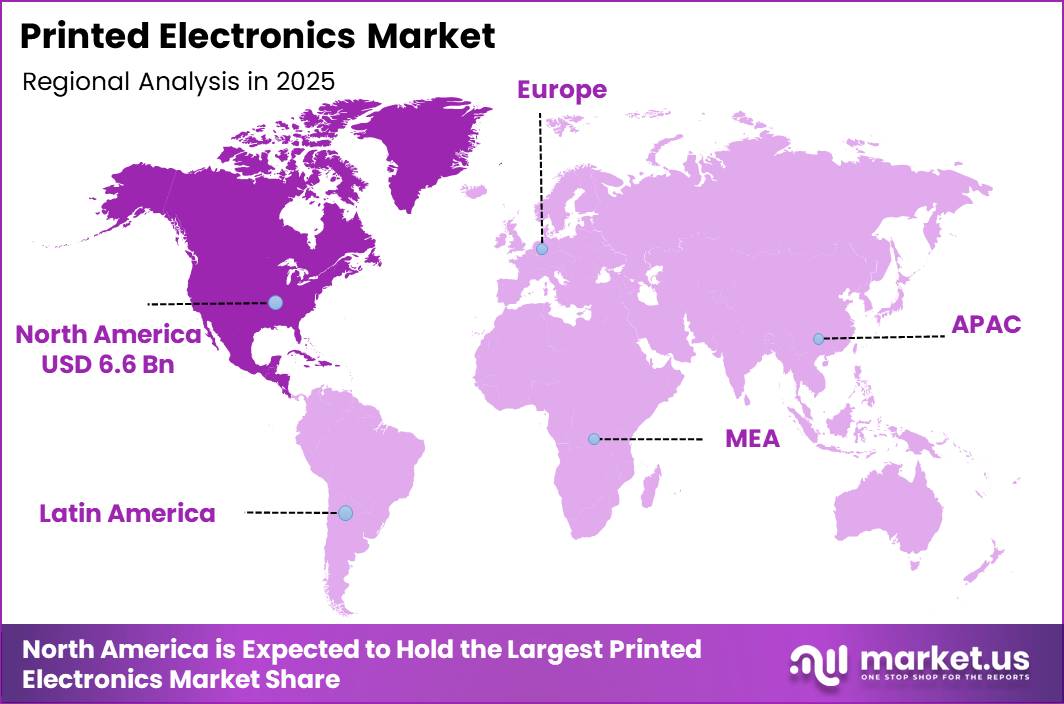
In 2025, the Global Printed Electronics Market was valued at USD 18.7 billion. The market is projected to grow at a CAGR of 18.6% during 2026–2035, reaching approximately USD 102.7 billion by 2035. North America dominated the global market in 2025, accounting for more than 35.21% of the total market share and generating approximately USD 6.6 billion in revenue.
Automotive manufacturing is creating significant demand for printed electronic components. According to the International Organization of Motor Vehicle Manufacturers, global motor vehicle production reached approximately 96.4 million units in 2025, increasing by nearly 4% from 2024. With more than 90 million vehicles being produced annually, the use of printed sensors, touch controls, flexible lighting, battery-monitoring circuits, and smart interior surfaces is increasing.
Demand is also rising across connected devices, wearable electronics, medical patches, smart packaging, NFC tags, and printed RFID labels. European Commission industry monitoring indicates that flexible and printed electronics are increasingly being integrated into films, foils, textiles, packaging, and building materials. As billions of consumer products and packaged goods adopt smart features, even the addition of 1 printed sensor, antenna, or circuit per product can create substantial production volumes.
Key Takeaway
- The market was valued at USD 18.7 billion in 2025 and is forecast to reach USD 102.70 billion by 2035, at a CAGR of 18.6%.
- Global vehicle production of 96.4 million units in 2025 (up 4% year-on-year) is driving demand for printed sensors and circuits.
- Inks dominate the material segment with an 81.67% share, supported by over 80 European ink manufacturers employing about 12,000 people.
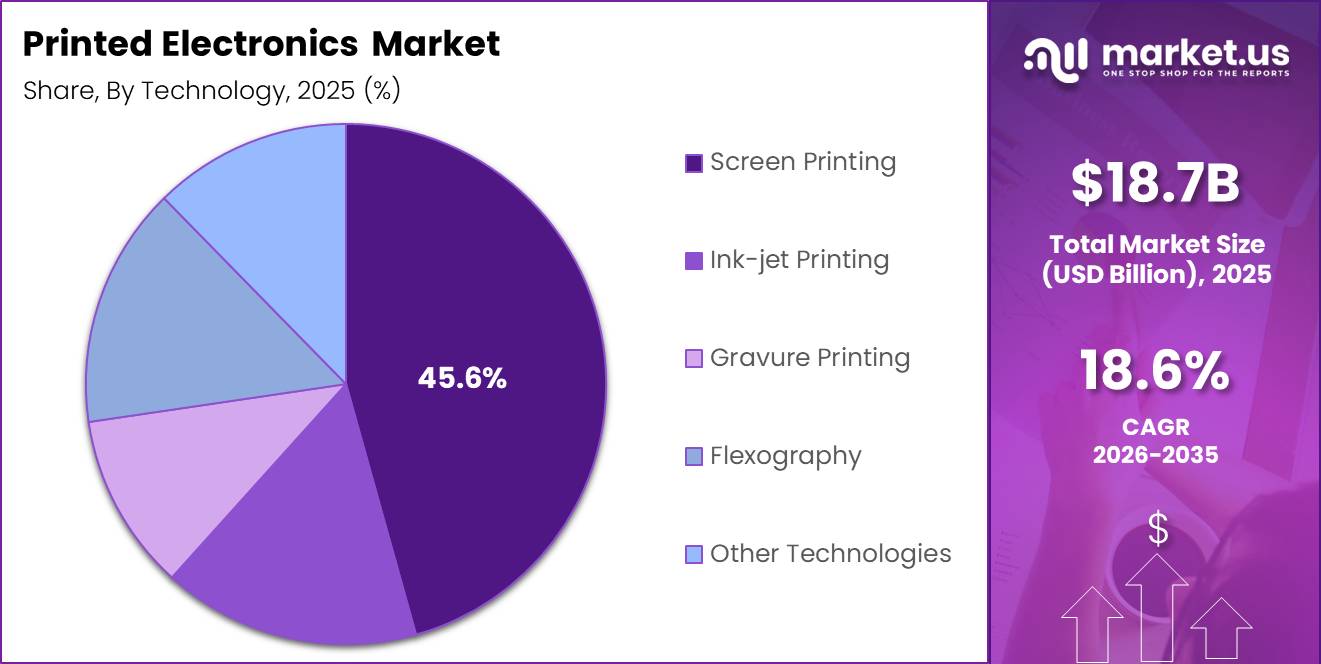
- Screen printing leads the technology segment with a 45.67% share due to its low cost and scalability.
- Displays hold the largest application share at 43.56%, fueled by 910.5 million large-area display shipments in 2025.
- Consumer electronics leads end-use demand at 34.89%, while automotive is the fastest-growing end-use segment.
- North America led the market in 2025 with a 35.21% share, worth approximately USD 6.6 billion.
By Material Type
In the printed electronics market, Inks account for a dominant share of approximately 81.67%, as functional ink is required to create almost every printed circuit, sensor, antenna, and conductive layer. The segment benefits from the well-established printing industry, which already has large-scale manufacturing facilities and technical expertise.
According to the European Printing Ink Association, more than 80 ink manufacturers operate across Europe and employ approximately 12,000 people, highlighting the region’s strong ink production capacity. Demand is also supported by wider industrial growth. According to the World Bank, global manufacturing value added increased by around 6.7% in 2023, reflecting higher activity across packaging, electronics assembly, automotive components, and industrial manufacturing.
By Technology
Screen printing accounts for approximately 45.67% of the printed electronics technology segment because it offers low production costs, strong reliability, and the ability to deposit thick functional ink layers. The technology benefits from a well-established printing industry with existing presses, screens, production facilities, and skilled operators.
According to the FESPA Global Print Census, revenue across graphics, signage, and textile printing increased by around 6% between 2018 and 2023, while screen printing showed annual value growth potential of more than 2%.
By Application
Displays hold a dominant share of approximately 43.56% in the printed electronics market because global demand for screens continues to rise across consumer electronics, automotive systems, wearable devices, and professional applications.
According to Omdia, large-area LCD and OLED display shipments reached around 910.5 million units in 2025, increasing by 2.9% compared with 2024. OLED shipments alone grew by 12.9% to approximately 33.7 million units.
Smartphone display demand also supports the segment’s leadership. Global smartphone display shipments reached about 1.55 billion units in 2024, while AMOLED panel shipments increased to 784 million units, representing nearly 51% of total volume.
By End Use Industry
Consumer electronics account for approximately 34.89% of printed electronics end-use demand because the industry produces devices at billion-unit scale and increasingly uses thin, flexible, and cost-efficient electronic components. Global smartphone shipments reached around 1.25 billion units in 2025, increasing by 2% from 2024 and recording the highest annual level since 2021.
Smartphones, tablets, laptops, televisions, and wearable devices use several printed or print-compatible components, including touch sensors, antenna patterns, flexible interconnects, and advanced display layers. Automotive is emerging as the fastest-growing end-use segment because vehicles are becoming more connected, digital, and sensor-based.
Global motor vehicle production reached approximately 96.4 million units in 2025, representing growth of around 4% from 2024. Modern vehicles increasingly include telematics systems, digital cockpits, battery-monitoring circuits, advanced driver-assistance interfaces, and smart interior surfaces.
Key Market Segments
Material Type
- Substrate
- Inks
- Others
Technology
- Flexography
- Ink-jet Printing
- Gravure Printing
- Screen Printing
- Other
Application
- Sensors
- Displays
- Batteries
- RFID
- Lighting
- Photovoltaic
- Other
End Use Industry
- Aerospace & Defense
- Automotive
- Construction
- Consumer Electronics
- Healthcare
- Packaging
- Retail
- Others
Geopolitical Impact Analysis
Geopolitical tensions are increasing costs and extending delivery times across the printed electronics supply chain by disrupting access to copper foils, specialty polymers, solvents, printing equipment, and transport capacity. The US–China tariff framework continues to apply an additional 25% duty to several Chinese electronics and machinery products under Section 301, increasing the landed cost of screen-printing systems, substrates, and assembly equipment imported into North America. Energy price volatility has created further pressure.
The International Energy Agency reported that North Sea Dated crude reached approximately USD 93 per barrel in October 2022, while diesel prices and refining margins increased by around 70% and 425% year-on-year, respectively. As logistics can represent about 5–10% of electronics production costs, higher fuel prices directly raise expenses for conductive inks, resins, films, printed sensors, and flexible displays.
Trade-route disruptions have also affected material availability. According to UNCTAD, Red Sea diversions through the Cape of Good Hope extended Asia–Europe shipping times by around 10–14 days and reduced Suez Canal traffic by 42%. Shanghai-to-Europe container rates also increased by approximately 256% between December 2023 and February 2024. These delays affect the supply of conductive inks, PET films, polyimide films, and flexible display modules produced mainly in Asia.
Manufacturers may therefore need safety stock equal to 10–20% of quarterly demand, increasing working-capital requirements. Combined tariff increases, freight-rate volatility, and longer transit times are encouraging printed electronics companies to adopt dual sourcing, regional production, and near-shore assembly strategies.
Regional Analysis
North America is currently the leading regional market for printed electronics, accounting for about 35.21% of global revenue and an estimated USD 6.6 billion value in 2025. This dominant position is driven by strong demand from consumer electronics, advanced automotive, healthcare devices, and smart packaging, supported by high R&D investment and early adoption of flexible and hybrid electronic solutions.
Large OEMs and materials suppliers in the US and Canada are integrating printed sensors, flexible circuits, and smart labels into high-value products, which lifts both unit volumes and average value per printed component. The presence of well-developed semiconductor, chemical, and specialty ink industries further supports a stable supply of conductive inks, substrates, and printing equipment, reinforcing North America’s leadership in this market.
Asia-Pacific, however, is the fastest-growing region for printed electronics, underpinned by its role as a global manufacturing hub for displays, smartphones, wearables, and automotive electronics. High-volume production clusters in China, South Korea, Japan, and emerging Southeast Asian economies are rapidly scaling printed display backplanes, antenna structures, and sensor arrays, as local suppliers leverage cost-competitive labor and large-scale printing lines.
Key Regions and Countries
North America
- US
- Canada
Europe
- Germany
- France
- The UK
- Spain
- Italy
- Rest of Europe
Asia Pacific
- China
- Japan
- South Korea
- India
- Australia
- Rest of APAC
Latin America
- Brazil
- Mexico
- Rest of Latin America
Middle East & Africa
- GCC
- South Africa
- Rest of MEA
Market Dynamics
Drivers
| Driver | (~) % Impact on CAGR | Geographic Relevance | Impact Timeline |
|---|---|---|---|
| IoT Device Proliferation & Embedded Sensor Demand | +3.8% | Global — led by North America, East Asia, Western Europe | Short term (≤ 2 years) |
| Wearable Technology Adoption in Consumer & Medical Segments | +3.2% | North America, Europe, Asia Pacific | Short term (≤ 2 years) |
| Cost Advantage of Additive Roll-to-Roll vs. Subtractive PCB Manufacturing | +2.5% | Global — manufacturing hubs in China, South Korea, Germany | Medium term (2–4 years) |
| RFID & Smart Labelling Expansion in Retail & Logistics | +2.0% | North America, Europe, Southeast Asia | Short term (≤ 2 years) |
| Automotive Interior Electrification & Flexible Display Integration | +1.6% | Europe, North America, China | Medium term (2–4 years) |
| Government Manufacturing Incentive Programs (PLI, CHIPS-Adjacent Grants) | +1.4% | India, United States, European Union | Medium term (2–4 years) |
IoT Device Proliferation & Embedded Sensor Demand
The expansion of IoT infrastructure across industrial automation, smart cities, agriculture, and connected appliances is increasing demand for low-cost flexible sensors. Conventional rigid PCB technology is difficult to use below a unit cost of approximately USD 0.30–0.50, while printed electronics can produce sensor nodes for around USD 0.05–0.15. This reduces the cost per node by approximately 60–75%.
Passive RFID tags demonstrate the growing adoption of printed electronics at scale. Shipments reached approximately 55 billion units in 2025, representing a 10% increase from 50 billion units in 2024. This growth is encouraging manufacturers to shift from customized production toward high-volume platform models supported by recurring income from licensing, conductive inks, and substrate supplies.
Wearable IoT applications are also supporting market growth. Inkjet printing accounted for approximately 32.5% of printed electronics device revenue in 2025. This adoption is influencing capital investment among major OEM manufacturers across East Asia and PLI-supported electronics production clusters in India.
Restraints
| Restraint | (~) % CAGR | Geographic Relevance | Impact Timeline |
|---|---|---|---|
| Silver & Specialty Conductive Ink Raw Material Price Volatility | -2.8% | Global — supply concentration in Mexico, Peru, China | Short term (≤ 2 years) |
| EU RoHS 3 & REACH SVHC Compliance Costs Freezing Product Launches | -2.1% | European Union, United Kingdom | Short term (≤ 2 years) |
| High Capital Intensity of Precision Roll-to-Roll Equipment | -1.8% | Global — most acute in South Asia, Latin America, Africa | Medium term (2–4 years) |
| Geopolitical Trade Restrictions on Advanced Ink Precursor Exports | -1.5% | US–China bilateral; EU technology export controls | Short term (≤ 2 years) |
| Performance Gap vs. Copper Conductors in High-Power Applications | -1.2% | Global — industrial, aerospace, power electronics segments | Long term (≥ 4 years) |
Silver & Specialty Conductive Ink Raw Material Price Volatility
Silver-based conductive inks represent the largest input cost in printed electronics manufacturing. Silver accounts for about 30–45% of the total formulation cost, depending on whether nanoparticle, flake, or metal-organic ink is used. The electronics sector consumes around 32–34% of annual global silver supply, equal to more than 300 million troy ounces, while printed and flexible electronics use approximately 48–55 million troy ounces per year. This volume is projected to exceed 74 million troy ounces by 2030.
Silver prices can fluctuate by 15–25% within a single year, as observed during 2024–2025. These changes can reduce margins by 4–9 percentage points for manufacturers operating under fixed-price annual OEM contracts. Reformulating the ink during a contract period requires substrate requalification, which can cost around USD 150,000–400,000 for each formulation change in automotive and medical-grade applications.
Copper and carbon inks offer partial alternatives, but technical limitations restrict their wider use. Copper inks often require sintering temperatures above 150°C, which can damage commonly used polyethylene terephthalate substrates. As a result, silver dependence is expected to remain high across most printed electronics applications over the medium term.
Challenges
| Challenge | (~) % CAGR | Geographic Relevance | Mitigation Horizon |
|---|---|---|---|
| Lab-to-Fab Scale-Up Yield Losses | -2.4% | Global — acute in emerging-market new entrants | Medium term (2–4 years) |
| Ink Formulation & Substrate Interoperability Gaps | -1.9% | Global — cross-platform standardization absent | Long term (≥ 4 years) |
| Multidisciplinary Talent Deficit | -1.6% | Global — most severe in South Asia, Southeast Asia, LATAM | Long term (≥ 4 years) |
| Mechanical Durability Under Cyclical Flex Stress | -1.3% | Global — automotive, aerospace, industrial segments | Long term (≥ 4 years) |
| Fragmented Global Serialization & Recycling Standards | -1.0% | European Union, North America | Medium term (2–4 years) |
Lab-to-Fab Scale-Up Yield Losses
The transition from laboratory prototypes to high-volume roll-to-roll production is a major operational challenge in the printed electronics industry. A process delivering more than 95% yield on a 300 mm laboratory-scale web can decline to 70–82% yield on a commercial R2R line operating at 10–50 metres per minute. This reduction is caused by registration errors, ink rheology changes, temperature variations, and unstable substrate tension.
The yield difference can increase the effective unit cost by 18–35% above the original production estimate. It can also reduce profit margins during production ramp-up periods that may continue for 12–24 months per product line. The absence of standardized process design kits further requires manufacturers to develop their own production methods and invest separately in research and development.
Opportunities
| Opportunity | (~) % CAGR | Geographic Relevance | Execution Window |
|---|---|---|---|
| Printed Diagnostics & Continuous Health Monitoring Patches | +3.5% | North America, Europe, Asia Pacific | Medium term (2–4 years) |
| Organic Photovoltaics (OPV) via Printed Deposition | +2.6% | Europe, China, India | Long term (≥ 4 years) |
| Smart Packaging Sensor Integration (Temperature, Freshness, Authentication) | +2.2% | Global — led by pharmaceutical & food & beverage supply chains | Medium term (2–4 years) |
| India & Southeast Asia Nearshore Manufacturing Buildout | +1.8% | India, Vietnam, Malaysia, Indonesia | Medium term (2–4 years) |
| Flexible Hybrid Electronics (FHE) for Aerospace & Defense | +1.5% | United States, Israel, France, India | Long term (≥ 4 years) |
| E-Textile & Printed Battery Integration for Smart Apparel | +1.2% | North America, Europe, East Asia | Long term (≥ 4 years) |
Printed Diagnostics & Continuous Health Monitoring Patches
The opportunity for printed healthcare electronics remains underdeveloped because most current revenue comes from single-use diagnostic strips. Continuous biometric patches that measure glucose, lactate, cortisol, cardiac rhythm, and skin temperature have not yet achieved the cost levels required for large-scale OEM adoption. The printed electronics healthcare segment was valued at approximately USD 2.74 billion in 2026.
Roll-to-roll printed sensors accounted for approximately 40% of remote patient monitoring technology in 2024. However, current patch-to-cloud clinical reliability remains around 78–84%, below the 92–95% level generally required for FDA 510(k) clearance and CE marking under EU MDR. Improving data accuracy could open significant demand for continuous monitoring patches.
Commercial expansion will require action across 3 areas: telehealth partnerships, improved barrier films, and regulatory approvals. Patch wear life must increase from 3–5 days to more than 14 days, representing a 2–3× extension that could raise average prices from USD 4–8 to USD 15–25 per patch. Regulatory clearance may require 18–30 months, while successful companies could achieve margin gains of 12–18 percentage points. Home healthcare and remote monitoring already generated 38% of flexible healthcare electronics revenue in 2024.
Key Players Analysis
Tier-1 companies in the printed electronics market include Samsung Electronics, LG Display, DuPont, BASF, and E Ink Holdings. These firms lead through large revenue bases, strong research spending, advanced manufacturing capacity, and established positions in flexible displays, specialty materials, and printed components. Samsung Electronics generated approximately USD 211 billion in revenue in 2023 and continued investing billions of dollars in OLED and flexible display production.
LG Display, which reported nearly USD 20 billion in revenue in 2018, has increasingly focused its investment on OLED, foldable, automotive, and IT panels. DuPont’s Electronics & Industrial segment recorded more than USD 5.9 billion in sales in 2024, increasing by 11% year-on-year. E Ink Holdings generated around TWD 32.2 billion, or nearly USD 1.0 billion, in 2024, supported by demand for e-paper displays, electronic labels, and digital signage.
Tier-2 participants include Molex, Agfa-Gevaert, Nissha, NovaCentrix, and PARC. These companies operate at a smaller scale but play an important role in conductive inks, flexible circuits, touch sensors, interconnects, and printing technologies. Molex generates estimated annual revenue of around USD 13.6 billion, while Agfa-Gevaert reports revenue of approximately EUR 1.3 billion. Tier-2 companies generally invest about 5–8% of revenue in research and development, supporting new conductive materials, printable substrates, and roll-to-roll production systems.
Top Key Players in the Market
- Samsung Electronics Co. Ltd.
- LG Display Co. Ltd.
- Molex LLC
- Agfa-Gevaert Group
- Palo Alto Research Center Incorporated (PARC)
- DuPont de Nemours Inc.
- Nissha Co. Ltd.
- BASF
- NovaCentrix
- E Ink Holdings Inc.
Recent Developments
- In April 2025, E Ink Holdings published its 2024 annual report, showing consolidated revenue of TWD 32.16 billion, supported by growing demand for color e-paper, electronic shelf labels, e-readers, and digital signage. Several global consumer electronics brands moved color e-paper products into mass production, thereby strengthening demand for printed display films and backplanes.
- In February 2025, DuPont reported that its Electronics & Industrial segment generated USD 5.93 billion in 2024 sales, increasing 11% year-on-year. Organic sales rose 6%, supported by higher demand for semiconductor materials, interconnection solutions, and printing and packaging applications.
Report Scope
| Report Features | Description |
|---|---|
| Market Value (2025) | USD 18.7 Billion |
| Forecast Revenue (2035) | USD 102.7 Billion |
| CAGR (2026-2035) | 18.6% |
| Base Year for Estimation | 2025 |
| Historic Period | 2020-2024 |
| Forecast Period | 2026-2035 |
| Report Coverage | Revenue Forecast, Market Dynamics, Competitive Landscape, Recent Developments |
| Segments Covered | By Material Type (Substrate, Inks, Others); By Technology (Flexography, Ink-jet Printing, Gravure Printing, Screen Printing, Other Technologies); By Application (Sensors, Displays, Batteries, RFID, Lighting, Photovoltaic, Other Devices); By End Use Industry (Aerospace & Defense, Automotive, Construction, Consumer Electronics, Healthcare, Packaging, Retail, Others) |
| Regional Analysis | North America – US, Canada; Europe – Germany, France, The UK, Spain, Italy, Rest of Europe; Asia Pacific – China, Japan, South Korea, India, Australia, Singapore, Rest of APAC; Latin America – Brazil, Mexico, Rest of Latin America; Middle East & Africa – GCC, South Africa, Rest of MEA |
| Competitive Landscape | Samsung Electronics, LG Display, Molex, Agfa-Gevaert, PARC, DuPont, Nissha, BASF, NovaCentrix, E Ink Holdings |
| Customization Scope | Customization for segments and region/country-level will be provided. Moreover, customization can be tailored to the requirements. |
| Purchase Options | We have three licenses to opt for: Single User License, Multi-User License (Up to 5 Users), Corporate Use License (Unlimited Users and Printable PDF) |





































