
Quick Navigation
Report Overview
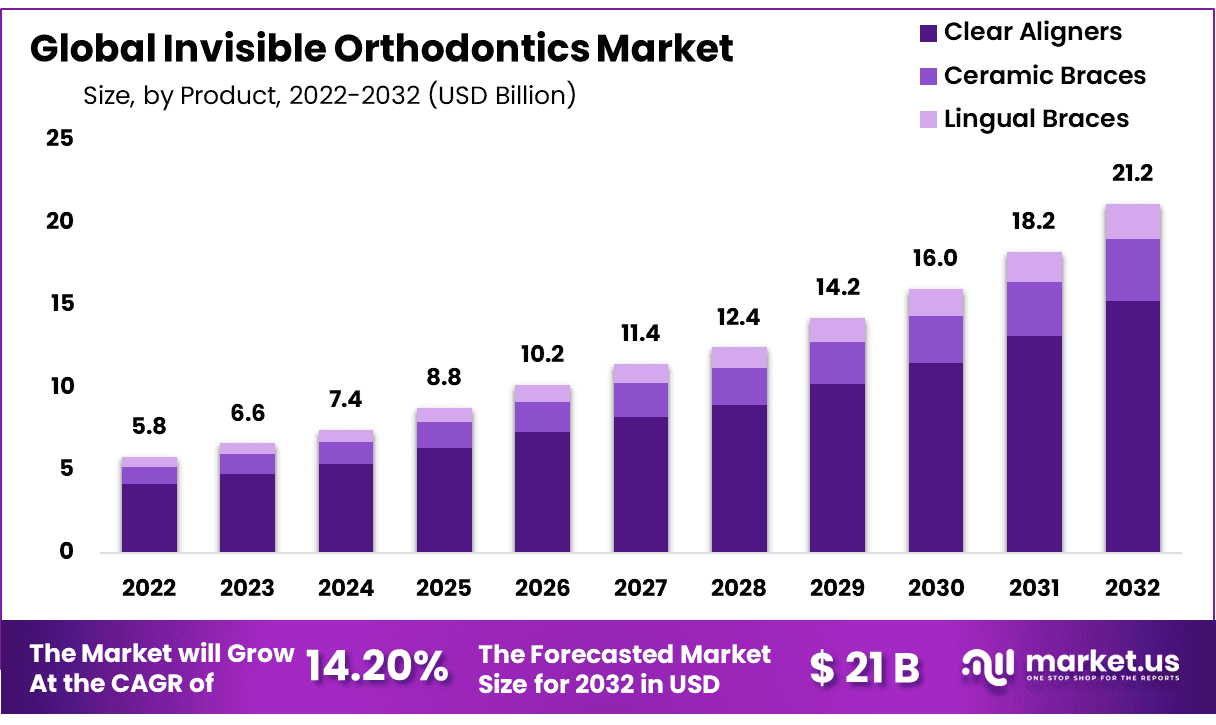
According to a recent report by Market.us, the Global Invisible Orthodontics Market size is expected to be worth around USD 21 Billion by 2032 from USD 5.8 Billion in 2022, growing at a CAGR of 14.20 % during the forecast period from 2023 to 2032.
The treatment, diagnosis, and prevention of crooked jaws and teeth are involved in the study of orthodontics. Invisible braces are as a discrete substitute for conventional metal (or fixed) braces. Due to their discretion in design and excellent outcomes, invisible braces are becoming more and more popular for straightening teeth. Patients of all ages can straighten their teeth professionally with the help of this discrete treatment.
Invisible braces are a type of orthodontic appliance that is designed to be ‘invisible’ (transparent) to the wearer, providing a more advanced method for tooth straightening. Currently, there are three main types of invisible braces available: Lingual braces, Invisalign (most commonly used), and Ceramic braces. Each of these braces offers its own unique set of tooth straightening techniques.
*Actual Numbers Might Vary in the final report
Key Takeaways
- In 2022, the Global Invisible Orthodontics Market was valued at US$ 8 Billion.
- The market is estimated to reach USD 21 Billion in 2032 with a CAGR of 2% between 2023 and 2032.
- The increasing prevalence of orthodontic and rising number of awareness campaigns are propelling the market growth.
- The high cost of Invisible Orthodontics is a restraining factor for the market.
- Clear Aligners accounted for the majority of revenue among the product type segment (72%).
- The adolescent segment dominated in the patient type category (52%).
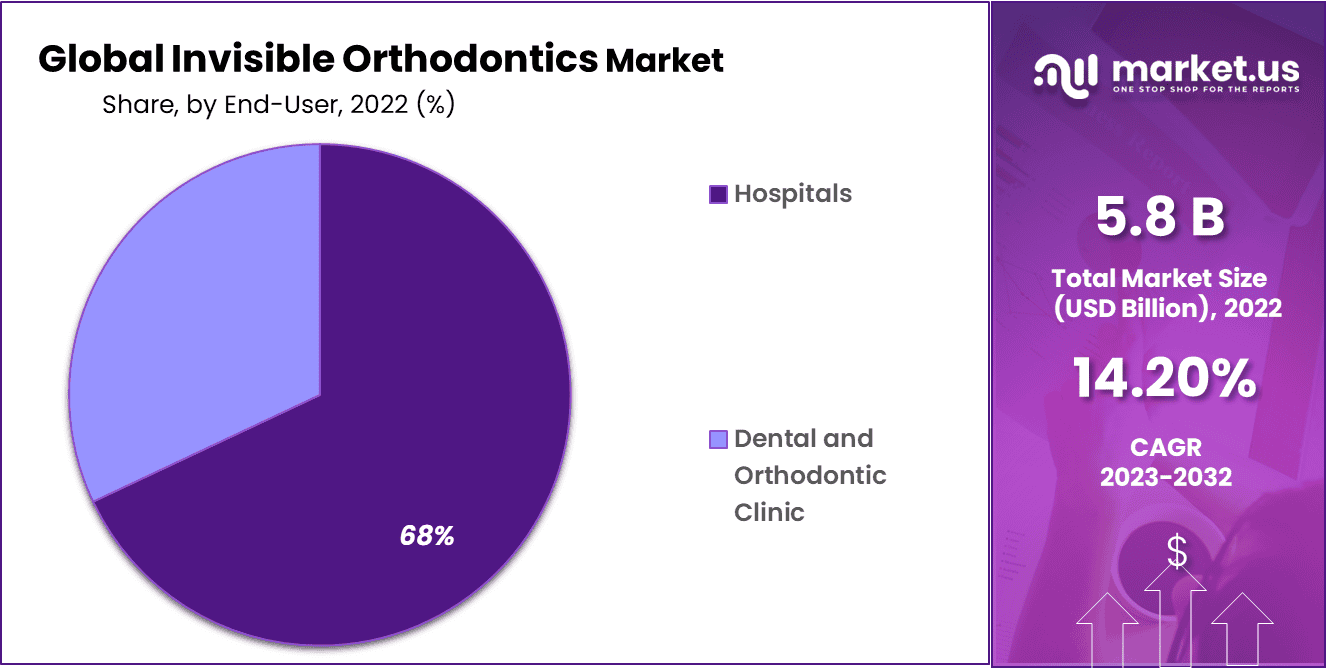
- Dental and orthodontic clinics are the primary end-users with a major share of 68%.
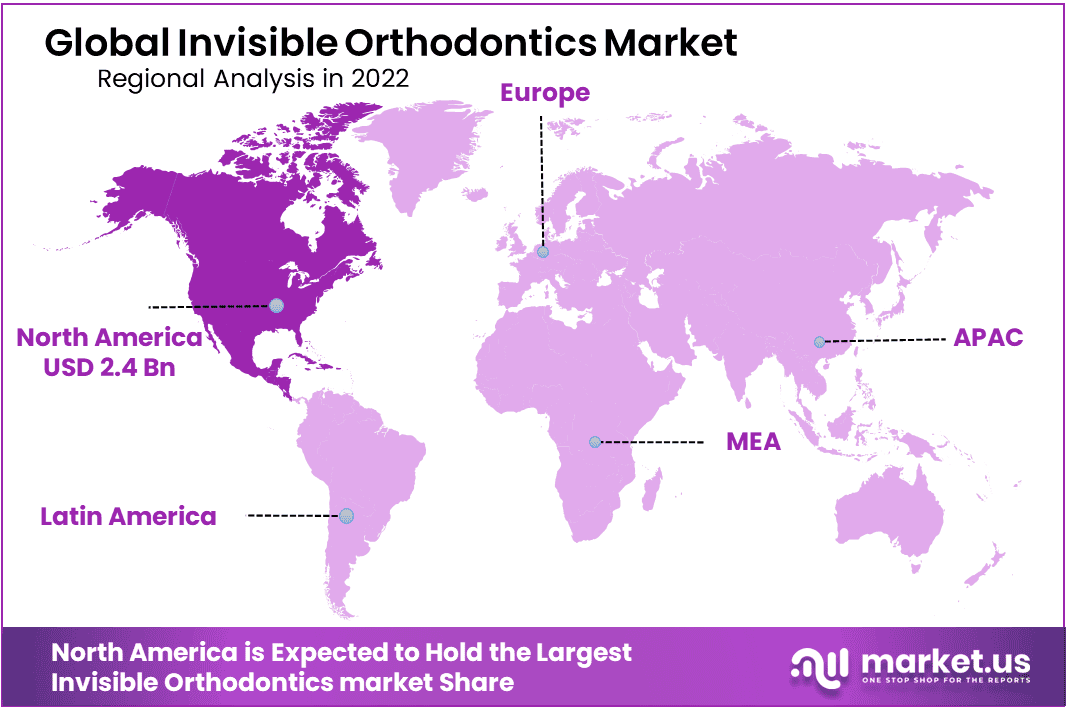
- North America led the market in 2022 (42% revenue share), followed by Asia-Pacific.
- Key players include Align Technology, 3M, Dentsply Sirona, and others.
Product Type Analysis
Clear Aligners Accounted for The Largest Market Share Owing to Increasing Demand.
The invisible orthodontics market is segmented by product type into Clear Aligners, Ceramic Braces, and Lingual Braces. Among these, Clear Aligners held the majority of revenue share. In 2022, clear aligners accounted for the market share of 72%. There are several benefits of clear aligners compared to traditional braces. Clear aligners are easy to take off, virtually invisible, and easy to use.
Additionally, they’re convenient and comfortable for people with misaligned teeth. The segment ‘clear aligners’ is expected to keep growing rapidly in the upcoming years, mainly in developed countries where there is high awareness about the product.
Patient Type Analysis
The adolescent segment is driving the market growth due to awareness and marketing campaigns.
On the basis of patient type, the global invisible orthodontics market has been segmented into children, adolescent, and adult. Adolescent segment dominated the market with a 52% market share, this is due to the increased emphasis on aesthetics among adolescents to enhance the appearance and functionality of their smiles, as well as an increase in the number of marketing campaigns conducted by major players to increase awareness of invisible aligners amongst adolescents and their parents.
For instance, 3M, an oral care products provider, has announced a new campaign to help orthodontists attract new generation Z patients by strengthening the colorful elastics trend with APC Flash Free orthodontics.
End-User Analysis
Based on end-users, the market is further divided into hospitals, dental & orthodontic clinic. The dental and orthodontic clinic segment accounted for the majority of the end-user market in terms of revenue. The growth of the market was largely attributed to the high demand for orthodontics. Furthermore, the training provided by the leading players to increase the awareness of the products within this segment will contribute to the segment’s dominance. For instance, Grin Orthodontics is teaming up with Henry Schein to provide orthodontic patients all over the U.S. with the Grin remote monitoring platform and Grin remote consultation.
Key Market Segments
By Product Type
- Clear Aligners
- Ceramic Braces
- Lingual Braces
By Patient Type
- Children
- Adolescent
- Adult
By End-User
- Hospitals
- Dental and Orthodontic Clinic
Drivers
Increasing prevalence of orthodontic
The market is experiencing a surge in demand due to an increasing number of individuals suffering from dental issues. People are also becoming more aware of cosmetic dentistry and restorative treatments. This is why dentists are using different techniques to help people with their teeth, like tooth alignment, tooth whitening, and edge bonding with incisal composite. This helps to make their smile look more symmetrical and aesthetically pleasing. Other cosmetic dentistry methods, like smile makeovers and veneers, as well as chapping enamel, are also helping to positively impact its market growth.
Implementation Awareness campaign
The global prevalence of dental conditions and the increasing preference for the correction of tooth deformities are projected to contribute to the expansion of the invisible orthodontics market globally. The advancements in dentistry, the implementation of awareness campaigns by both private and public entities, and the provision of dental examinations are expected to further increase the demand for the products available in the market.
For instance, Smile Rally is a national social awareness initiative of the Indian Orthodontic Society (IOS). The purpose of the Smile Rally is to educate the general public on orthodontic treatment and in particular to fight against the menace of dental hygiene caused by direct-to-consumer aligners. During this initiative, awareness campaigns will be carried out in 30 cities in India.
Restraints
High Cost of Invisible Orthodontics Hinder the Market Growth
The cost of invisible orthodontics is high. The main reason why tooth aligners cost more than braces is because they need to be tailored to each person. Braces are usually the same for everyone, but clear aligners are tailored to each person’s individual teeth and bite. Additionally, clear aligners use medical-grade, high-quality plastic that’s designed to be long-lasting, stretchy, and easy to wear.
Unlike metal or ceramic aligners, clear aligners are more expensive. The average cost of clear aligners is US$3000-5000.
Opportunity
Increasing Investment in R&D
The key market players are investing more in research and development (R&D) to launch new services and products, which presents an opportunity for the growth of the market. For instance, in April 2020, Align Technology acquired EXOCAD, and continued to develop its digital platforms throughout the pandemic to meet the increasing demand for online consultation and diagnosis.
Trends
Temporary anchorage devices (TADs) are being increasingly adopted for surgery
Temporary anchoring devices (TADS) are surgical-grade titanium miniscrews typically used in oral surgery procedures. However, they are now being utilized by orthodontic surgeons to control the movement of teeth within the mouth. TADs provide a secure anchorage in the jawbone for molars or other teeth, thereby reducing the risk of unwanted tooth movement.
Regional Analysis
North America Holds Region Accounted Significant Share of the Invisible Orthodontics Market
In 2022, North America accounted for over 42.0% of the global invisible orthodontic market. North America is currently the largest market for orthodontics. The American Dental Association (ADA) found that 85% of people in the US value dental health and view it as an important part of overall health and wellness. The emergence of clear aligners caught the attention of patients who want to improve their smiles but would prefer something more aesthetically pleasing than traditional fixed metal appliances. The increasing awareness of dental hygiene and the ease of treatment options offered by orthodontics in the region are driving the invisible orthodontics market.
Asia Pacific is projected to have the highest compound annual growth rate (CAGR) over the forecast period. This is due to a large number of malocclusion patients, growing awareness of the use of teeth aligners, and increasing public–private investment in unmet medical needs. The growth of the market can also be attributed to the presence of the key players in the Asia Pacific region.
Asia Pacific offers lucrative opportunities for key players in the invisible orthodontic market, which is expected to grow at the fastest pace during the forecast period. This is due to the development of infrastructure of industries, increase in spending on cosmetic dentistry, and established presence of domestic companies.
Key Regions
North America
- The US
- Canada
Europe
- Germany
- France
- The UK
- Spain
- Italy
- Russia
- Netherland
- Rest of Europe
APAC
- China
- Japan
- South Korea
- India
- Australia
- New Zealand
- Singapore
- Thailand
- Vietnam
- Rest of APAC
Latin America
- Brazil
- Mexico
- Rest of Latin America
Middle East & Africa
- South Africa
- Saudi Arabia
- UAE
- Rest of MEA
Key Players Analysis
Strong Focus On Product Innovation and New Product Launches Increasing the Competition
The Invisible Orthodontics Market is moderately fragmented. Market participants are focusing on launching new products and expanding into new geographies to increase their market share. For instance, The TruGEN material is the latest innovation in proprietary branded aligner material of Ormco.
Market Key Players
The following are some of the major players in the industry
- Align Technology
- 3M
- Dentsply Sirona
- G&H Orthodontics G&H Orthodontics
- Candid Care Co.
- SmileDirectClub
- SMILE2IMPRESS SL.
- Dynaflex
- DB Orthodontics
- ALIGNERCO
- Other Key Players
Recent Development
- In September 2022: Align’s next-gen remote monitoring solution, Align Virtual Care AI, brought new AI-powered capabilities that simplified workflows for physicians and their teams. Features such as patient enrollment, setting up, and review are available directly on Invisalign’s Doctor Site, eliminating the need for separate standalone solutions.
- In February 2022: OraPharma introduced the OraFit Custom Clear Aligner system in the United States. OraFit aligners use high performance materials in a 3 layer design for enhanced appearance, enhanced alignment comfort, and long-lasting oral health.
Report Scope
| Report Features | Description |
|---|---|
| Market Value (2022) | USD 5.8 Bn |
| Forecast Revenue (2032) | USD 21 Bn |
| CAGR (2023-2032) | 14.20% |
| Base Year for Estimation | 2022 |
| Historic Period | 2016-2021 |
| Forecast Period | 2023-2032 |
| Report Coverage | Revenue Forecast, Market Dynamics, COVID-19 Impact, Competitive Landscape, Recent Developments |
| Segments Covered | By Product Type (Clear Aligners, Ceramic Braces, Lingual Braces), By Patient Group (Children, Adolescent, Adult), By End-User (Hospitals, Dental and Orthodontic Clinic) |
| Regional Analysis | North America – The US & Canada; Europe – Germany, France, The UK, Spain, Italy, Russia, Netherland, Rest of Europe; APAC– China, Japan, South Korea, India, Australia, New Zealand, Singapore, Thailand, Vietnam & Rest of APAC; Latin America– Brazil, Mexico & Rest of Latin America; Middle East & Africa– South Africa, Saudi Arabia, UAE & Rest of MEA |
| Competitive Landscape | Align Technology, 3M, Dentsply Sirona, G&H Orthodontics G&H Orthodontics, Candid Care Co., SmileDirectClub, SMILE2IMPRESS SL., Dynaflex, DB Orthodontics, ALIGNERCO, Other Key Players |
| Customization Scope | Customization for segments, region/country-level will be provided. Moreover, additional customization can be done based on the requirements. |
| Purchase Options | We have three licenses to opt for: Single User License, Multi-User License (Up to 5 Users), Corporate Use License (Unlimited User and Printable PDF) |
Frequently Asked Questions (FAQ)
Invisible orthodontics refers to a type of orthodontic treatment that uses nearly invisible or clear aligners to straighten teeth, making them less noticeable compared to traditional braces.
The global Invisible Orthodontics Market size was estimated at USD #### billion in 2022 and is expected to reach USD ### Million in 2032.
The global Invisible Orthodontics Market is expected to grow at a compound annual growth rate of ####%. From 2023 To 2032
Some of the key players in the Invisible Orthodontics Markets are Nuvasive, Inc., AlloSource, Zimmer Biomet, DePuySynthes, Inc., Orthofix Holdings, Inc., Baxter, OST Development, Smith & Nephew, Biobank, Other Key Players
Invisible orthodontics uses custom-made clear aligners that gradually shift teeth into their desired positions. Patients wear a series of these aligners, each for a specified period.
Invisible orthodontics is suitable for both teenagers and adults who wish to correct teeth misalignment issues, such as crowded teeth, gaps, or overbites.


