Report Overview
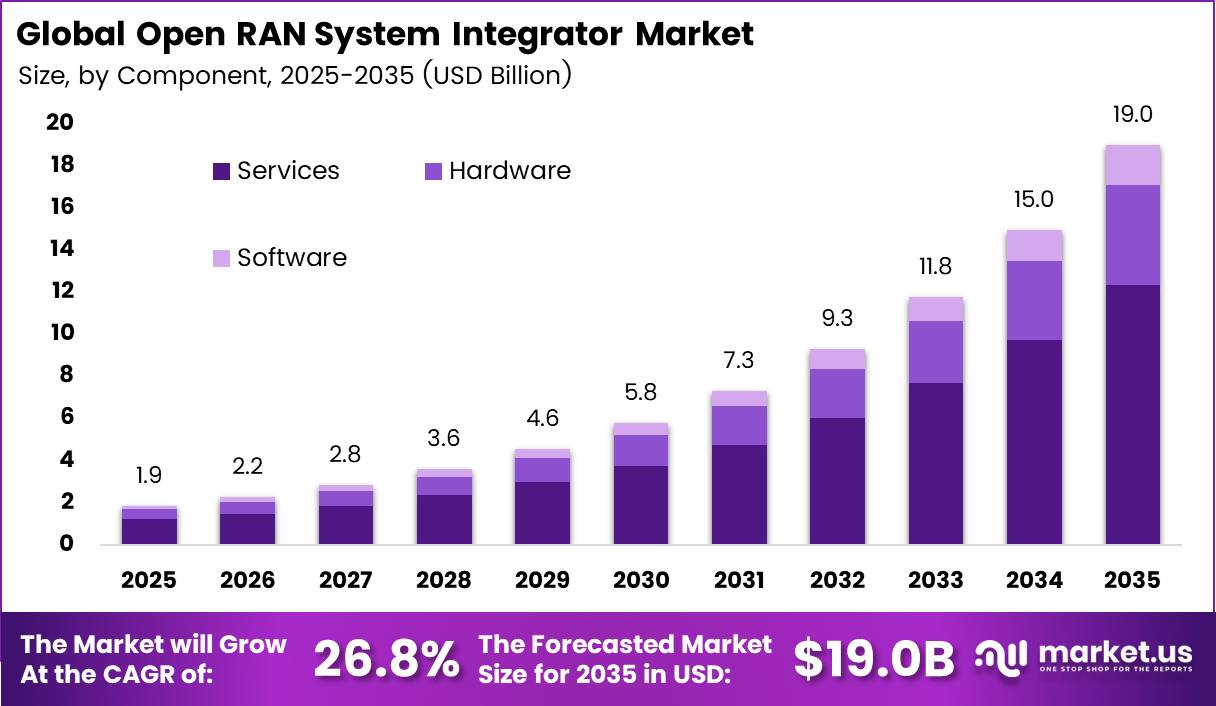
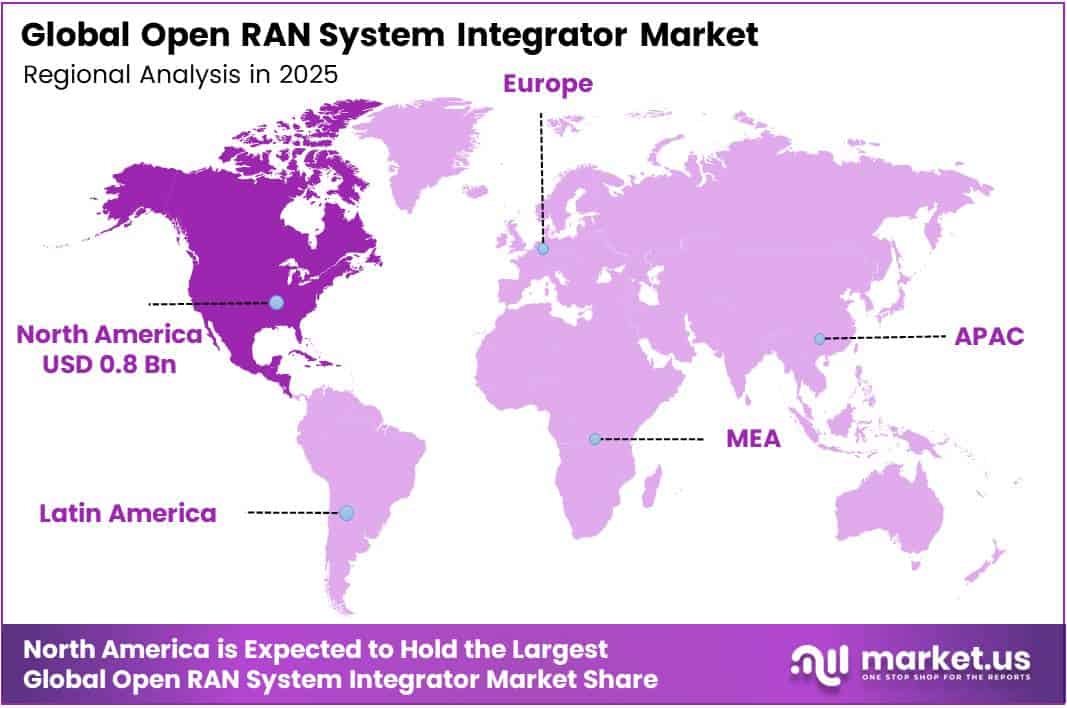
In 2025, the Global Open RAN System Integrator Market was valued at USD 1.9 billion. The market is projected to grow at a CAGR of 26.8% during 2026–2035, reaching approximately USD 19.0 billion by 2035. North America dominated the global market in 2025, accounting for more than 41.2% of the total market share and generating approximately USD 0.8 billion in revenue.
Growth comes from a wide shift to 5G. The GSMA reports 8,817.0 million mobile connections worldwide in 2025, and 5G made up 20% of them. That share rose from 0% in 2019, and the GSMA expects more than 50% of connections to run on 5G by 2029.
Open RAN networks mix radios, software, and cloud parts from many vendors. Operators need integrators to test, combine, and run these parts, so every new 5G site adds integration work. The North America region has an early lead in 5G. The GSMA reports that 5G made up 48% of North American connections in 2025, up from 0% in 2019, while 4G fell from 82% to 45%.
The region had 429.4 million connections in 2025. According to the GSMA, mobile added USD 1.9 trillion to North American GDP in 2025 and supported 2.8 million jobs. It expects that figure to reach USD 3.7 trillion by 2030. This strong economic base helps operators and enterprises pay for multi-vendor network integration.
Key Takeaways
- The Open RAN System Integrator Market was worth USD 1.9 billion in 2025 and should reach USD 19.0 billion by 2035. grow at a CAGR of 26.8% from 2026 to 2035.
- By Component, Services led with a 68.6% share.
- By Network Generation, 5G led with a 67.5% share and is also the fastest-growing sub-segment.
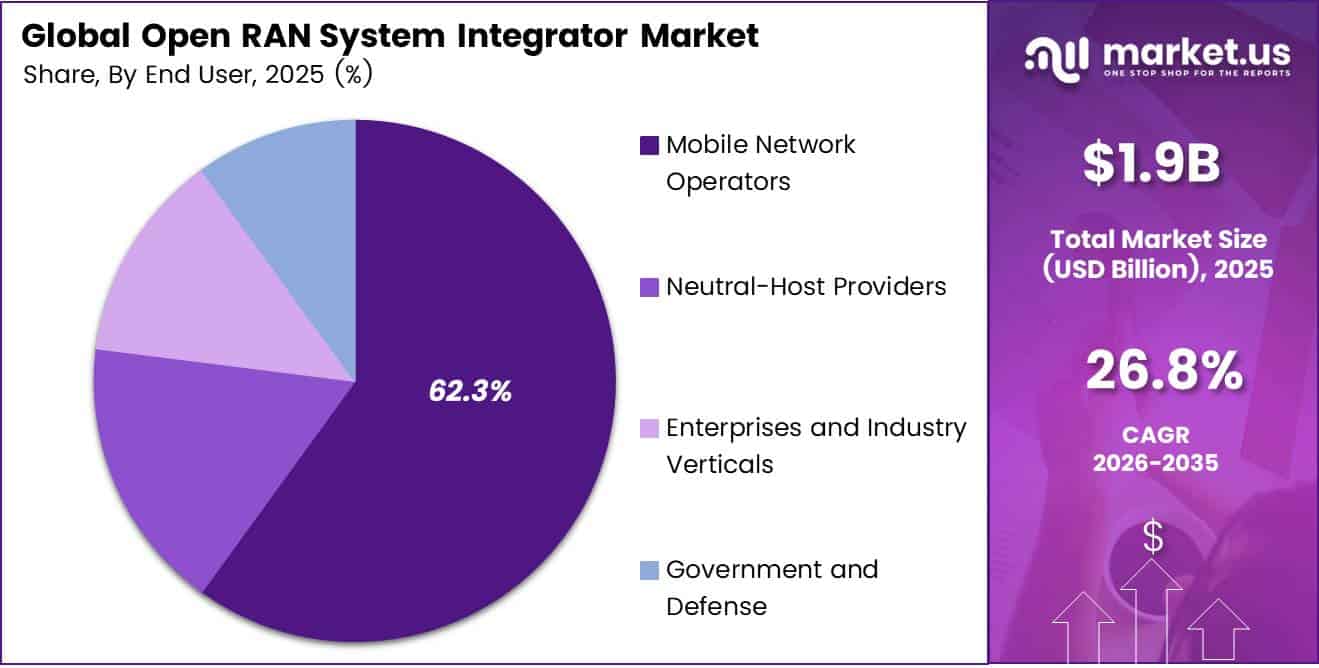
- By End User, Mobile Network Operators led with a 62.3% share.
- North America led the market with a 41.2% share and USD 0.8 billion in revenue.
By Component
Services dominates with 68.6% due to complex multi-vendor network testing needs.
Services leads because Open RAN splits one network into parts from many vendors. Operators then need a partner to test, join, and run those parts. The U.S. NTIA supports this work through its $1.5 billion Public Wireless Supply Chain Innovation Fund, which pays for trials and multi-vendor projects that integrators deliver.
Hardware still holds a solid place. NTIA gave out more than $273 million in one grant batch to bring open radio units to market. Each new radio unit adds fitting and field work, which also lifts services revenue.
Software grows fastest because operators want automation that cuts the cost of running mixed-vendor sites. NTIA’s third funding notice targets software for industry verticals and integration automation, so public money is moving from boxes to code. NTIA also gave Northeastern University $1,989,783 to build an energy-testing platform for Open RAN systems.
By Network Generation
5G dominates with 67.5% due to cloud-native standalone core rollouts worldwide.
5G holds the largest share because most new Open RAN contracts target 5G radios and cloud cores. Ericsson’s June 2026 Mobility Report puts global 5G subscriptions close to 3.3 billion. 5G now carries half of all mobile data traffic.
5G is also the fastest-growing group. Carriers added about 660 million 5G subscriptions in 2025, and Ericsson expects 6.4 billion by the end of 2031. Around 4.1 billion of those, or 65%, should run on 5G standalone. Standalone networks need open interfaces and new cores. Mobile data traffic also rose 23% between Q2 2025 and Q2 2026, so operators have to add capacity fast.
By End User
Mobile Network Operators dominate with 62.3% due to large licensed spectrum and subscriber bases.
Mobile Network Operators lead because they own the spectrum, towers, and subscribers that Open RAN serves. Their markets are huge. India, Nepal and Bhutan reached 430 million 5G subscriptions at the end of 2025, and mainland China reached 1.2 billion.
Enterprises and industry verticals grow fastest as factories, mines and ports build their own networks. GSA counted 1,953 private mobile network customers across 84 countries by the end of 2025. That is up from 1,846 customers in 80 countries in August 2025, which itself was a 7.7% rise on the prior year. 5G already appears at 876 of these customers, or 47%.
Key Market Segments
By Component
- Services
- Hardware
- Software
By Network Generation
- 4G/LTE
- 5G
- Other
By End User
- Mobile Network Operators
- Neutral-Host Providers
- Enterprises and Industry Verticals
- Government and Defense
Geopolitical Impact Analysis
Trade tensions between the US and China raise the cost of Open RAN hardware. The US raised Section 301 tariffs on Chinese semiconductors to 50% in 2025. Radio units, baseband servers, and accelerator cards all use these chips. Integrators now spend more time qualifying non-Chinese suppliers, and this adds cost to each multi-vendor project.
Shipping problems in the Red Sea slow hardware delivery. UNCTAD reported that Suez Canal transits fell by more than 50% after attacks began in late 2023. Ships that reroute around the Cape of Good Hope add about 10 to 14 days to Asia-to-Europe trips. Radio units built in Asia arrive late, and integrators must reschedule site testing and field crews.
Security rules also change which vendors operators can buy from. US and European operators are removing high-risk vendor gear, and the US program to replace that equipment ran a funding gap of about USD 3.08 billion. Each replacement site needs new radios, new software, and full testing. That steady flow of work favors integrators that do not depend on restricted vendors.
Energy and metal prices squeeze project margins. The World Bank tracked copper prices above USD 9,000 per ton through 2025, which raises the cost of cabling, power systems, and cooling. Operators push integrators to cut energy use, so software tools for power savings have become a key selling point.
Regional Analysis
North America dominates the Open RAN System Integrator Market, holding a 41.2% share and generating USD 0.8 billion in revenue. The US drives most of this demand. Large operators in the region have committed to multi-vendor networks. Each one needs partners to test radios, cloud platforms, and software from different suppliers.
The GSMA counts about 320 million mobile internet users in North America, and 60% of them connect through 5G. That heavy 5G use creates constant upgrade and optimization work. Mobile tech and services generate about 5% of regional GDP, so operators have strong reasons to keep improving their networks.
Asia Pacific is the fastest-growing region in the Open RAN System Integrator Market. Japan leads early adoption through fully virtualized networks. India adds scale as operators expand 5G to rural sites. The GSMA counts 1,879.4 million unique mobile subscribers in Asia Pacific (excluding Greater China) in 2025, up from 1,632.6 million in 2019.
Europe holds a strong second position, led by Germany, the UK, France, Spain, and Italy. Large operators have set multi-year Open RAN targets that cover thousands of sites. The GSMA reports 679.1 million connections in Europe in 2025, with 123.5% connection penetration. Strict EU security rules push operators to diversify their vendors.
Key Regions and Countries
North America
- US
- Canada
Europe
- Germany
- France
- The UK
- Spain
- Italy
- Rest of Europe
Asia Pacific
- China
- Japan
- South Korea
- India
- Australia
- Rest of APAC
Latin America
- Brazil
- Mexico
- Rest of Latin America
Middle East and Africa
- GCC
- South Africa
- Rest of MEA
Market Dynamics
Drivers
| Driver | (~) % Impact on CAGR Forecast | Geographic Relevance | Impact Timeline |
|---|---|---|---|
| Tier-1 Operator Multi-Vendor RAN Swap Programs | +2.6% | North America, Europe | Short term (2 years or less) |
| High-Risk Vendor Rip-and-Replace Mandates | +1.6% | North America, Europe | Short term (2 years or less) |
| Cloud-Native vRAN and CaaS Platform Adoption | +1.3% | Global | Medium term (2 to 4 years) |
| Government Supply Chain Diversification Funding | +1.0% | North America, Japan, India | Medium term (2 to 4 years) |
| Greenfield Cloud-Native Operator Rollouts | +0.7% | Asia Pacific, Middle East | Short term (2 years or less) |
Tier-1 Operator Multi-Vendor RAN Swap Programs
The structural root cause is the move by incumbent Tier-1 operators away from single-vendor RAN procurement and toward disaggregated radio, distributed-unit, and centralized-unit stacks from several suppliers. AT&T’s 2023 commitment, disclosed in its investor communications, to carry about 70% of its wireless traffic over open-capable platforms by late 2026 set the reference point for the industry.
Per Vodafone’s annual report disclosures, the operator went beyond 2,500 Open RAN sites in the UK across 2024 and 2025 and set a target of roughly 30% of its European footprint by 2030. Deutsche Telekom guided toward about 3,000 O-RAN sites in Germany.
According to O-RAN ALLIANCE plugfest records, interoperability validation cycles run about 3 to 6 months for each new vendor combination. Operator earnings call commentary puts systems integration and testing at roughly 15% to 25% of total Open RAN program cost, compared with low single digits in integrated RAN contracts.
Commercially, the integrator business model is moving from one-time project fees toward multi-year managed lifecycle contracts and continuous CI/CD testing subscriptions. These contracts lift recurring revenue to an estimated 40% or more of integrator Open RAN revenue. They also lower customer acquisition cost, because each anchor deal turns into a repeatable regional template.
Restraints
| Restraint | (~) % Impact on CAGR Forecast | Geographic Relevance | Impact Timeline |
|---|---|---|---|
| Operator Wireless CapEx Contraction | -2.1% | Global | Short term (2 years or less) |
| Prime-Vendor Single-Stack Open RAN Contracts | -1.2% | North America, Europe | Medium term (2 to 4 years) |
| Elevated Cost of Capital for Network Projects | -0.8% | Europe, Emerging Markets | Short term (2 years or less) |
| Brownfield Integrated RAN Contract Lock-In | -0.6% | Europe, Latin America | Medium term (2 to 4 years) |
| Pilot-to-Commercial Conversion Freezes | -0.4% | Asia Pacific, Africa | Short term (2 years or less) |
Operator Wireless CapEx Contraction
The root cause is the end of the 5G coverage build cycle, combined with flat mobile service revenue. The GSMA Intelligence operator CapEx tracker shows global RAN spending falling at a high single-digit to low double-digit rate across 2023 and 2024. Ericsson and Nokia earnings releases confirmed that Mobile Networks sales declined by about 10% to 20% year on year during that period.
The quantitative bottleneck is CapEx intensity. Operator annual reports show capital intensity falling from about 18% to 20% of revenue toward 14% to 15%. In North America, carriers, including Verizon, guided to flat or lower capital budgets in SEC filings. In this environment, discretionary multi-vendor integration projects are often the first line items to be deferred or cut back.
Strategically, integrators face postponed site waves and statements of work cut by about 20% to 30%. Utilization of field and lab engineering teams falls, and delivery margins can compress by 300 to 500 basis points as fixed lab infrastructure is spread over fewer active programs.
Challenges
| Challenge | (~) % CAGR Friction Drag | Geographic Relevance | Mitigation Horizon |
|---|---|---|---|
| Multi-Vendor Interoperability Testing Burden | -1.5% | Global | Medium term (2 to 4 years) |
| Cloud-RAN Engineering Talent Deficit | -1.1% | Global | Long term (4 years or more) |
| Massive MIMO Energy Efficiency Gap | -0.7% | Europe, Asia Pacific | Medium term (2 to 4 years) |
| Open Fronthaul Security Hardening | -0.5% | North America, Europe | Medium term (2 to 4 years) |
| Accelerator Silicon Supply Constraints | -0.4% | Global | Short term (2 years or less) |
Multi-Vendor Interoperability Testing Burden
The structural weakness is that O-RAN interfaces such as the open fronthaul, E2 and O1 still allow wide room for vendor-specific interpretation. Each new combination of radio and distributed-unit software. O-RAN ALLIANCE specification release cadence shows roughly 2 to 3 major spec trains a year, so tested configurations keep becoming outdated.
The friction compounds quickly. NTIA testing and evaluation program findings show that a 4-vendor stack can create dozens of interface pairings that need regression testing after every software drop. Operator disclosures to the TIP (Telecom Infra Project) community indicate that end-to-end certification raises time-to-commercial-launch by about 6 to 9 months compared with integrated RAN.
To manage this over the long term, integrators need to invest in automated CI/CD test factories and digital-twin labs, and in shared certification through O-RAN ALLIANCE Open Testing and Integration Centres. This could cut per-release testing effort by 30% to 50%, but it requires multi-year upfront lab CapEx.
Opportunities
| Opportunity | (~) % Potential CAGR Upside | Geographic Relevance | Execution Window |
|---|---|---|---|
| RIC xApp and rApp Monetization Marketplaces | +1.9% | North America, Europe, Asia Pacific | Medium term (2 to 4 years) |
| Private 5G Enterprise Open RAN Integration | +1.5% | Global | Medium term (2 to 4 years) |
| AI-RAN GPU Edge Convergence | +1.2% | North America, Japan, South Korea | Long term (4 years or more) |
| Rural and Emerging Market Neutral-Host Builds | +0.9% | India, Africa, Latin America | Long term (4 years or more) |
| Integrator Lab and Testing M&A Roll-Ups | +0.6% | North America, Europe | Short term (2 years or less) |
RIC xApp and rApp Monetization Marketplaces
This is still untapped white space, not a current driver. Most commercial Open RAN rollouts so far deal with radio and DU/CU disaggregation, while the Non-RT and Near-RT RIC layers remain largely in trials. O-RAN ALLIANCE deployment surveys and operator disclosures from Vodafone and Deutsche Telekom suggest fewer than 10% of open sites run third-party xApps or rApps in production.
The new monetization model would turn integrators into marketplace curators and assurance providers. They would certify, onboard, and run AI-driven optimization apps for energy saving, traffic steering, and interference management, charging recurring per-site or revenue-share fees. Energy-saving rApps alone show radio power reductions of 10% to 25%, based on ETSI and GSMA network energy benchmarking.
The unit economics are attractive. Software-led app assurance could lift integrator gross margins from a typical services level of about 20% to 25% toward 45% to 55%, judging by publicly reported software-segment margins in telecom vendor annual reports. Marginal cost per additional managed site could fall by an estimated 30% to 40% once the orchestration layer is in place.
Key Players Analysis
Tier 1 leaders combine wide global reach with strong balance sheets. Cisco Systems leads by size. It reported about USD 56.7 billion in revenue in FY2025 and spent about USD 9.3 billion on R&D. Cisco supplies transport, cloud, and automation layers for Open RAN, and in 2026 it won a 5G standalone core contract with Rakuten.
Mavenir is the leading pure software player. In June 2025, it agreed to a recapitalization that removed more than USD 1.3 billion of debt. In July 2025, it added USD 300 million in new financing. The company left radio hardware and now focuses on 4G and 5G Open RAN software, along with its core and IMS products.
Tier 2 challengers hold strong niche positions. Airspan Networks came out of restructuring and won a radio unit role at Rakuten in January 2026, which filled gaps left by Mavenir and NEC. Parallel Wireless won a contract from Telecall to deploy its Unity AI Open RAN platform across thousands of sites in Colombia. Radisys and Amarisoft supply software stacks that many integrators build on.
JMA Wireless focuses on US-built radios and in-building systems for neutral-host venues. Baicells serves price-sensitive operators in Asia and fixed wireless markets. ASOCS targets private enterprise networks, and Cohere Technologies licenses spectrum efficiency software to operators. Most Tier 2 firms are private and do not publish full revenue or R&D figures.
Top Key Players in the Market
- Mavenir Systems, Inc.
- Parallel Wireless, Inc.
- Airspan Networks Holdings Inc.
- Radisys Corporation
- JMA Wireless, Inc.
- Baicells Technologies Co., Ltd.
- ASOCS Ltd.
- Amarisoft SA
- Cisco Systems, Inc.
- Cohere Technologies, Inc.
Recent Developments
- In June 2025, Mavenir Systems, Inc. finished a debt recapitalization with its lenders that removed more than USD 1.3 billion of debt. It also moved its Open RAN investment toward 4G and 5G software.
- In January 2026, Airspan Networks Holdings Inc. won a radio unit supply role in Rakuten Mobile’s Open RAN network after Mavenir and NEC left the 5G radio market.
- In 2026, Cisco Systems, Inc. won a 5G standalone core contract with Rakuten, expanding its role in cloud-native Open RAN networks.
- In October 2026, Parallel Wireless, Inc. was formally selected by Telecall to deploy its Unity AI Open RAN solution across thousands of 5G sites in Colombia.
Report Scope
| Report Features | Description |
|---|---|
| Market Value (2025) | USD 1.9 Billion |
| Forecast Revenue (2035) | USD 19.0 Billion |
| CAGR (2026-2035) | 26.8% |
| Base Year for Estimation | 2025 |
| Historic Period | 2020-2024 |
| Forecast Period | 2026-2035 |
| Report Coverage | Revenue Forecast, Market Dynamics, Competitive Landscape, Recent Developments |
| Segments Covered | By Component (Services, Hardware, Software); By Network Generation (4G/LTE, 5G, Other); By End User (Mobile Network Operators, Neutral-Host Providers, Enterprises and Industry Verticals, Government and Defense) |
| Regional Analysis | North America – US, Canada; Europe – Germany, France, The UK, Spain, Italy, Rest of Europe; Asia Pacific – China, Japan, South Korea, India, Australia, Singapore, Rest of APAC; Latin America – Brazil, Mexico, Rest of Latin America; Middle East & Africa – GCC, South Africa, Rest of MEA |
| Competitive Landscape | Mavenir Systems, Inc., Parallel Wireless, Inc., Airspan Networks Holdings Inc., Radisys Corporation, JMA Wireless, Inc., Baicells Technologies Co., Ltd., ASOCS Ltd., Amarisoft SA, Cisco Systems, Inc., Cohere Technologies, Inc. |
| Customization Scope | Customization for segments and region/country-level will be provided. Moreover, additional customization can be done based on the requirements. |
| Purchase Options | We have three licenses to opt for: Single User License, Multi-User License (Up to 5 Users), Corporate Use License (Unlimited Users and Printable PDF) |