


Report Overview
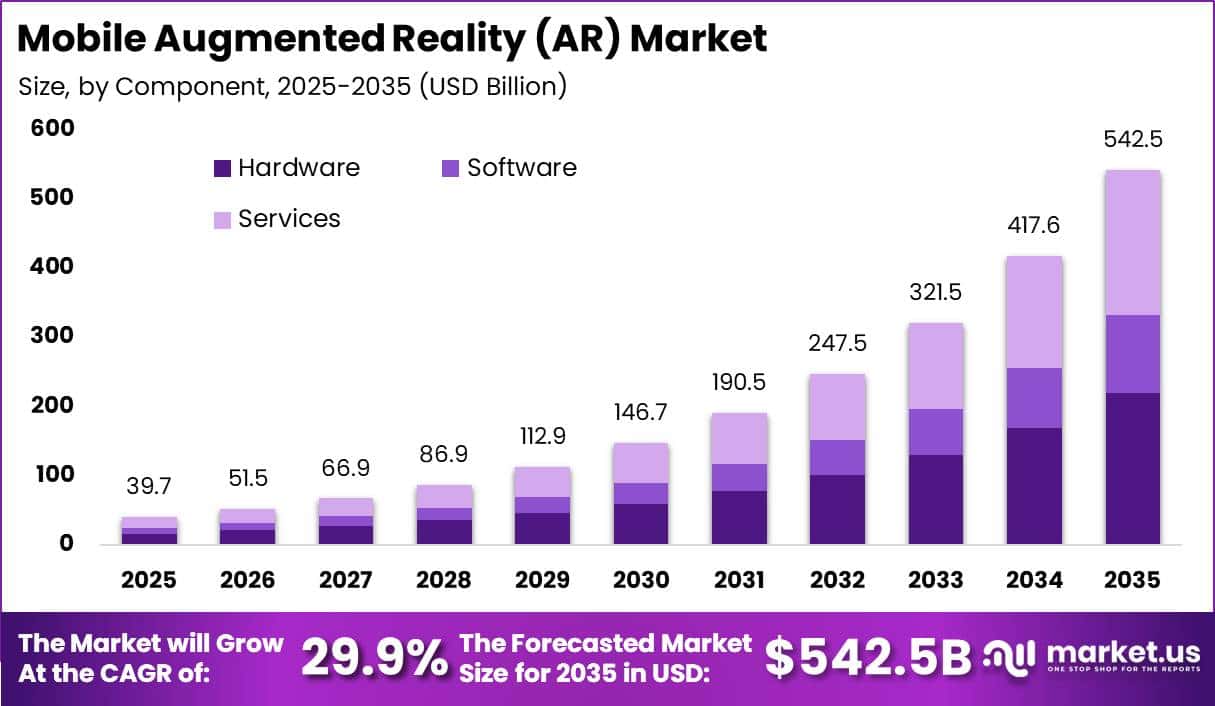
In 2025, the Global Mobile Augmented Reality Market was valued at USD 39.7 billion. The market is projected to grow at a CAGR of 29.9% during 2026–2035, reaching approximately USD 542.5 billion by 2035. North America dominated the global market in 2025, accounting for more than 37.1% of the total market share and generating approximately USD 14.7 billion in revenue.
GSMA also expects unique mobile subscribers to reach nearly 5.8 billion by the mid-2020s, while total mobile connections are projected to exceed 8.8 billion. Ericsson reported that around 660 million 5G subscriptions were added in 2025, with 5G representing approximately 79% of mobile subscriptions in North America. These developments provide a large user base and the high-speed connectivity required for advanced mobile AR applications during 2026–2035.
North America accounted for more than 37.1% of global revenue in 2025, supported by strong smartphone use, advanced digital infrastructure, and rapid 5G adoption. In 2025, the ITU reported approximately 9.2 billion mobile-cellular subscriptions worldwide and 99 mobile broadband subscriptions per 100 inhabitants.
Growing demand for digital content is also strengthening the market. The global gaming industry generated nearly USD 201.6 billion in 2025, while mobile games contributed approximately USD 113.3 billion, accounting for more than half of total gaming revenue. In addition, AR/VR devices and smart-glasses shipments were expected to reach around 14.3 million units in 2025, increasing by nearly 39% year-on-year.
Key Takeaway
- The market was valued at USD 39.7 billion in 2025 and is projected to reach USD 542.5 billion by 2035, growing at a CAGR of 29.9%.
- By component, Hardware led with a 40.5% share in 2025, driven by demand for processors, cameras, sensors, and displays.
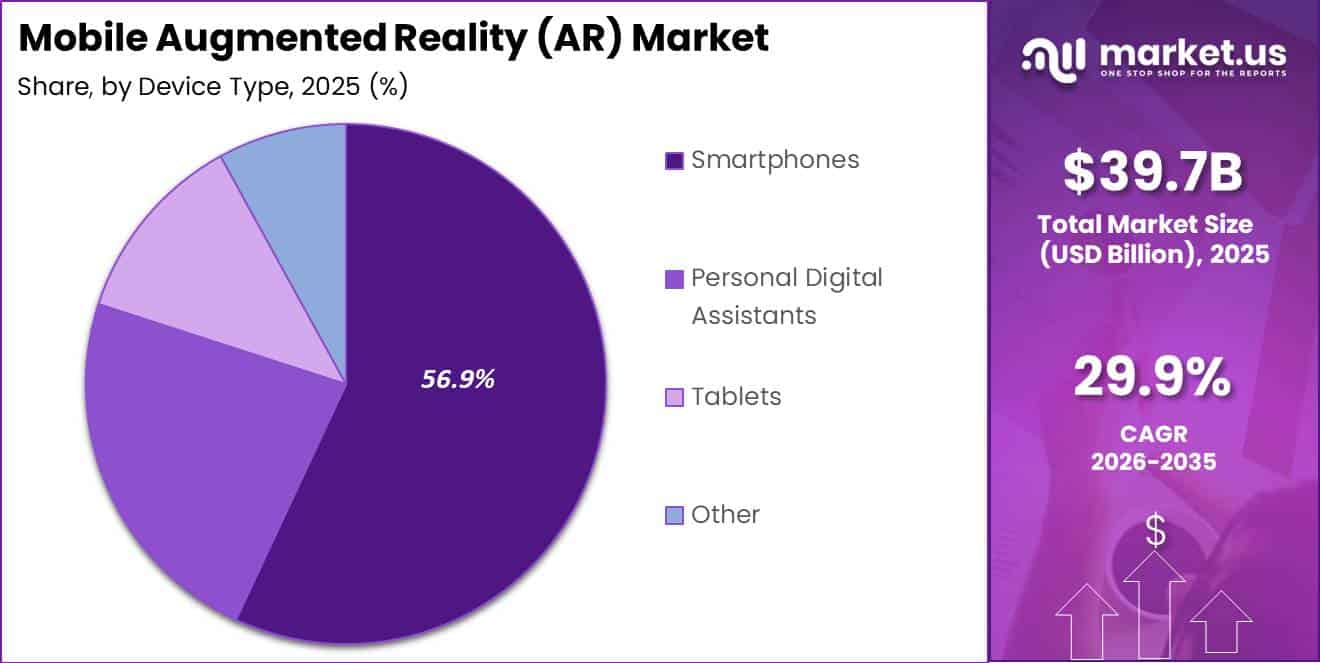
- By device type, Smartphones led with approximately a 56.9% share in 2025 due to widespread ownership and daily use.
- By end-user, the Consumer segment led with approximately a 43.8% share in 2025, driven by gaming, social media, and shopping applications.
- North America led the market in 2025 with more than 37.1% share, generating approximately USD 14.7 billion in revenue.
Market Statistics and Data Insights
- In 2025, approximately 6 billion people, or about 74% of the global population, used the internet. Around 3 billion 5G subscriptions represented nearly one-third of worldwide mobile-broadband subscriptions, while 5G networks covered 55% of the global population. These figures show a large network base for data-intensive mobile AR applications.
- In the United States and Canada, 5G represented approximately 60% of mobile connections in 2025. Mobile technologies and services contributed around USD 1.6 trillion to the North American economy in 2024, equal to 5% of regional GDP, creating favourable infrastructure for mobile AR gaming, commerce, navigation, and enterprise applications.
- PTC reported in February 2025 that Vuforia Engine had supported more than 1.5 million AR developers over more than a decade. Vuforia Engine Version 11 also introduced an Enterprise Plan with unlimited target generation and locally processed AI-assisted object validation.
- Snap reported more than 900 million monthly Snapchat users, while over 350 million Snapchatters interacted with augmented reality every day. This observed usage shows that AR is already part of routine mobile behaviour rather than a limited experimental feature.
- The EU AI Act allows penalties of up to EUR 35 million or 7% of worldwide annual turnover for certain prohibited-practice and data-related infringements. The regulation also restricts sensitive biometric categorisation and tightly controls real-time remote biometric identification, increasing compliance requirements for camera-driven AR and smart-glasses applications.
- In a Fujitsu deployment, AR instructions reduced general assembly time from 120 minutes to 97 minutes, improving productivity by 19%. Installation time for SFP transceivers fell from 53 minutes to 31 minutes, representing a 42% productivity improvement, while training time declined from 3–5 days to approximately 1 hour.
- WHO reported that 430 million people require rehabilitation for disabling hearing loss, while at least 2.2 billion people have near or distance vision impairment. Meta expanded its Call a Volunteer smart-glasses feature to all 18 countries where Meta AI was supported and added detailed environmental responses for blind and low-vision users.
- By July 2026, Snapchat’s subscription business had exceeded 25 million subscribers globally. Snap had previously introduced Lens+, providing hundreds of premium AR experiences and creating a route for selected developers to monetise exclusive Lenses.
- Apple’s M5 Vision Pro renders 10% more pixels and supports refresh rates of up to 120 Hz. Its R1 chip processes data from 12 cameras, 5 sensors, and 6 microphones within approximately 12 milliseconds, while AI features operate up to 50% faster for system functions and up to 2 times faster in third-party applications.
- A 2025 Scientific Reports study found that an AI-driven edge-offloading framework reduced energy consumption for mobile AR applications by an average of 30%, maintained task-success rates above 90%, and kept latency below 80 milliseconds.
By Component
By component, the Hardware segment led the mobile augmented reality market with a 40.5% share in 2025. Its leadership is supported by the essential role of processors, cameras, sensors, displays, and graphics chips in delivering smooth and accurate AR experiences. According to WSTS, the global semiconductor market reached approximately USD 795–796 billion in 2025, growing by more than 26% year-on-year.
The European Semiconductor Industry Association also reported worldwide semiconductor sales of nearly USD 791.7 billion in 2025, reflecting strong electronics demand across major regions. Logic devices generated around USD 302 billion in 2025, making them the largest semiconductor product category and highlighting the rising value of advanced processing technology.
At the device level, global smartphone shipments reached approximately 1.2 billion units in 2025, creating a large installed base of AR-capable devices. Modern smartphones increasingly include multiple cameras, depth sensors, high-refresh displays, and on-device artificial intelligence.
By Device Type
By device type, Smartphones led the mobile augmented reality market with approximately a 56.9% share in 2025. Their leadership is supported by widespread ownership, regular daily use, and easy access to digital content. According to the International Telecommunication Union, around 6 billion people used the internet in 2025, representing nearly three-quarters of the global population.
Mobile broadband also accounted for approximately 89% of all mobile subscriptions, showing that handheld devices remain the main way users access online services. Global mobile-cellular subscriptions also exceeded the total world population by 2025, highlighting the extensive availability of mobile phones.
They allow users to access AR gaming, social media filters, navigation tools, virtual product trials, and retail applications without purchasing separate headsets. For developers, advertisers, and content providers, smartphones offer access to billions of users while reducing hardware and customer acquisition barriers.
By End-User
By end user, the Consumer segment led the mobile augmented reality market with approximately a 43.8% share in 2025. Its strong position is supported by widespread AR use across entertainment, gaming, social media, shopping, and daily mobile applications. Around 6 billion people, representing 74% of the global population, were using the internet in 2025.
In addition, approximately 5.7 billion people used mobile phones, while smartphones accounted for nearly 87% of all handsets in use. This large device base gives billions of consumers immediate access to AR-enabled applications. Consumer engagement across digital platforms also remains high.
Global social media user identities reached approximately 5.2 billion, while adult internet users spent an average of 6 hours and 38 minutes online each day, including more than 2 hours on social platforms. This usage supports demand for AR filters, virtual lenses, interactive videos, games, and digital product trials. Global digital advertising expenditure reached nearly USD 790 billion in 2024, accounting for more than 70% of total advertising investment.
Key Market Segments
By Component
- Hardware
- Software
- Services
By Device Type
- Smartphones
- Personal Digital Assistants
- Tablets
- Other
By End-User
- Consumer
- Enterprise
- Government
Geopolitical Impact Analysis
Geopolitical tensions are increasing costs and delivery times across the mobile augmented reality value chain, which relies heavily on Asia–Europe and Asia–North America trade routes for semiconductors, displays, camera modules, and finished smartphones.
UNCTAD’s 2024 assessment showed that ship transits through the Suez and Panama canals declined by more than 40%. Container tonnage passing through the Suez Canal fell by 82% by mid-February 2024, while approximately 586–621 container vessels were redirected around the Cape of Good Hope.
These longer routes can increase a typical Asia–Europe round trip from 56 days to 63 days, adding nearly 7 days to the shipping cycle. This change may also require approximately 1 additional vessel per service loop, raising freight, inventory, and working-capital costs for mobile AR hardware manufacturers. Higher sailing speeds further increase operating expenses. According to UNCTAD, increasing vessel speed from 14 knots to 16 knots can raise fuel consumption per mile by around 31%.
Energy-market uncertainty linked to the Russia–Ukraine war has created additional cost pressure. The International Energy Agency described the conflict as the first truly global energy crisis and reported that approximately 182.7 million barrels were released from emergency oil reserves in 2022 to help stabilise markets.
Regional Analysis
North America led the mobile augmented reality market in 2025, accounting for approximately 37.1% of global revenue and generating nearly USD 14.7 billion. The region’s strong position is supported by high smartphone usage, advanced mobile networks, mature application ecosystems, and widespread adoption of 5G technology.
Asia Pacific is expected to be the fastest-growing regional market, supported by rapid digitalisation, rising smartphone ownership, expanding consumer spending, and large-scale 5G deployment across China, South Korea, India, and Southeast Asia. The region has a strong mobile-first consumer base, high use of social video platforms, and a large number of Android devices, creating favourable conditions for AR-based gaming, advertising, retail, and e-commerce services.
Smartphone manufacturers, digital platforms, and online marketplaces are also adding AR tools to mobile devices and applications. Although North America maintained a 37.1% share and a value of USD 14.7 billion in 2025, Asia Pacific is expected to reduce the regional gap as mobile AR becomes more widely used in shopping, payments, entertainment, and consumer engagement.
Key Regions and Countries
North America
- US
- Canada
Europe
- Germany
- France
- The UK
- Spain
- Italy
- Rest of Europe
Asia Pacific
- China
- Japan
- South Korea
- India
- Australia
- Rest of APAC
Latin America
- Brazil
- Mexico
- Rest of Latin America
Middle East & Africa
- GCC
- South Africa
- Rest of MEA
Market Dynamics
Drivers
| Driver | (~) % CAGR | Geographic Relevance | Impact Timeline |
|---|---|---|---|
| Mass smartphone & social media AR usage | +4.0% | Global | Short term (2 years or less) |
| 5G and edge-ready mobile networks | +3.0% | North America, Asia Pacific, Europe | Medium term (2 to 4 years) |
| Mobile-first gaming and entertainment spend | +2.5% | Global | Short term (2 years or less) |
| Enterprise adoption in field & retail operations | +2.0% | North America, Europe, Asia Pacific | Medium term (2 to 4 years) |
| OEM integration of cameras, sensors & AI | +1.5% | Global | Long term (4 years or more) |
Mass smartphone & social media AR usage
Mass smartphone and social media usage is the strongest driver of mobile AR, adding roughly +4.0% to the baseline CAGR. Around 6.0 billion people were online in 2025, while mobile broadband accounted for nearly 90% of active subscriptions. Smartphone shipments also exceed 1.2 billion units per year, with many devices supporting multi-camera systems and on-device AI processing for AR filters and visual effects.
Adults spend more than 2.0 hours per day on social platforms, where camera-based AR lenses are widely used in advertising and digital content. AR-enabled advertisements can achieve double-digit higher click-through rates than static formats, improving campaign monetisation. The large installed base of AR-ready smartphones, frequent camera usage, and stronger advertising performance continue to support higher mobile AR engagement, ad impressions, and in-app purchases.
Restraints
| Restraint | (~) % CAGR | Geographic Relevance | Impact Timeline |
|---|---|---|---|
| High-end device affordability gaps | -3.0% | Emerging markets | Short term (2 years or less) |
| Data protection & biometric privacy rules | -2.5% | Europe, North America, selected Asia Pacific | Medium term (2 to 4 years) |
| App store fee structures & platform control | -2.0% | Global | Medium term (2 to 4 years) |
| Advertising budget cyclicality | -1.5% | Global | Short term (2 years or less) |
| Geopolitical trade & logistics disruptions | -1.0% | Europe, Middle East, North America | Short term (2 years or less) |
High-end device affordability gaps
High-end device affordability could reduce the baseline CAGR by around -3.0%, particularly in emerging markets where median monthly income may remain below USD 300. Flagship smartphones priced above USD 800 can equal nearly 3 months of disposable income for many households.
Consumer credit costs also increased by around 150–300 basis points between 2021 and 2024, making instalment purchases more expensive and limiting access to devices with advanced AR processors, cameras, and displays.
Smartphone adoption can also differ by 10–20 percentage points between urban and rural populations because of device and data costs. This gap forces developers to optimise AR applications for mid-range hardware and restrict features such as high-resolution passthrough and persistent spatial mapping. As a result, AR publishers face lower user penetration, higher optimisation costs, and weaker monetisation from premium mobile experiences.
Challenges
| Challenge | (~) % CAGR | Geographic Relevance | Mitigation Horizon |
|---|---|---|---|
| Cross-platform fragmentation | -2.5% | Global | Medium term (2 to 4 years) |
| Advanced AR talent scarcity | -2.0% | North America, Europe, Asia Pacific | Long term (4 years or more) |
| Battery & thermal management limits | -1.8% | Global | Medium term (2 to 4 years) |
| On-device AI compute costs | -1.5% | Global | Long term (4 years or more) |
| Content moderation & safety risks | -1.2% | Global | Short term (2 years or less) |
Cross-platform fragmentation
Cross-platform fragmentation could reduce the potential CAGR by around -2.5%, as mobile AR applications must support at least 2 major operating systems with different development frameworks. Maintaining similar features across multiple platforms can increase project costs by approximately 30–50% compared with single-platform development.
Shortages of several hundred thousand professionals with skills in computer vision, real-time 3D, and graphics technologies also increase development pressure. AR specialists can earn around 20–35% more than general software engineers.
Uneven access to low-latency networks and edge-computing services creates further operating challenges. AR providers often need separate network adaptation systems for different telecom operators, adding around 10–20% to infrastructure costs per active user. These issues reduce code reuse, slow international product launches, and weaken profit margins.
Opportunities
| Opportunity | (~) % CAGR | Geographic Relevance | Execution Window |
|---|---|---|---|
| AR-native advertising & commerce formats | +3.0% | Global | Medium term (2 to 4 years) |
| Industrial & logistics workflow AR | +2.5% | North America, Europe, Asia Pacific | Long term (4 years or more) |
| Developer tooling & low-code AR platforms | +2.0% | Global | Short term (2 years or less) |
| AR integration in financial & public services | +1.8% | Asia Pacific, Latin America, EMEA | Long term (4 years or more) |
| Cross-border data-light AR experiences | +1.5% | Emerging markets | Medium term (2 to 4 years) |
AR-native advertising & commerce formats
AR-based advertising and commerce could add around +3.0% to the baseline CAGR by improving returns for brands, retailers, and digital platforms. Online advertising already accounts for more than 60% of total advertising budgets in advanced economies, while major digital platforms generate annual advertising revenue worth tens of billions of dollars.
AR-powered virtual try-on and product visualisation tools can improve conversion rates by 20–30% and reduce product returns by 10–20%, supporting stronger sales and lower operating costs. Logistics expenses often represent around 15–25% of net sales for large e-commerce companies.
Even a mid-single-digit reduction in returns through AR-based product guidance could improve operating margins by approximately 50–100 basis points. Since these tools are still concentrated in selected product categories and regions, significant expansion potential remains.
Key Players Analysis
Tier-1 companies in the mobile augmented reality market include Apple, Alphabet, Meta, Samsung, and Microsoft. These firms control major smartphone, operating-system, application-store, and AR-platform ecosystems. Apple generated approximately USD 394–400 billion in annual net sales and spent around USD 30 billion on research and development, equal to nearly 7–8% of revenue.
This investment supports technologies such as custom processors, LiDAR sensors, and ARKit tools. During the first half of 2024, Meta’s Reality Labs generated approximately USD 0.7 billion in revenue but recorded operating losses of nearly USD 8.3 billion. Meta also spent around USD 20.5 billion on R&D, representing approximately 27% of operating costs.
Sony’s Game & Network Services segment reported sales of about JPY 4.6 trillion, or nearly EUR 28.6 billion, and operating profit of JPY 414.8 billion in FY 2024. Together, leading companies could account for approximately 55–65% of mobile AR revenue.
Tier-2 participants include Snap, PTC, Magic Leap, Blippar, Wikitude, and specialised AR developers. Snap generated approximately USD 4.6–5.0 billion in annual revenue, while R&D historically represented nearly 30% of operating expenses.
Microsoft’s Intelligent Cloud segment produced more than USD 96 billion in revenue, supported by company-wide R&D spending above USD 27 billion. Samsung strengthens its position by shipping hundreds of millions of smartphones annually. Specialised Tier-2 providers may collectively represent around 10–15% of mobile AR solution revenue.
Top Key Players in the Market
- Apple Inc.
- Google LLC
- Microsoft Corporation
- PTC Inc.
- Samsung Electronics Co., Ltd.
- Meta Platforms, Inc.
- Snap Inc.
- Sony Corporation
- Blippar
- Wikitude GmbH
- Magic Leap, Inc.
Recent Developments
- In 2026, Google expanded the Android XR ecosystem at Google I/O by presenting intelligent eyewear developed with Samsung, Gentle Monster, and Warby Parker. The first audio glasses are scheduled to arrive in fall 2026 and will connect with both Android and iOS smartphones.
- In 2025, Meta launched the Ray-Ban Meta Display glasses with a full-colour in-lens display and the Meta Neural Band. The product became available in the United States on September 30, 2025, at a starting price of USD 799. It provides up to 6 hours of mixed-use battery life and approximately 30 hours with its charging case.
Report Scope
| Report Features | Description |
|---|---|
| Market Value (2025) | USD 39.7 Billion |
| Forecast Revenue (2035) | USD 542.5 Billion |
| CAGR (2026-2035) | 29.9% |
| Base Year for Estimation | 2025 |
| Historic Period | 2020-2024 |
| Forecast Period | 2026-2035 |
| Report Coverage | Revenue Forecast, Market Dynamics, Competitive Landscape, Recent Developments |
| Segments Covered | By Component (Hardware, Software, Services); By Device Type (Smartphones, Personal Digital Assistants, Tablets, Other); By End-User (Consumer, Enterprise, Government) |
| Regional Analysis | North America – US, Canada; Europe – Germany, France, The UK, Spain, Italy, Rest of Europe; Asia Pacific – China, Japan, South Korea, India, Australia, Singapore, Rest of APAC; Latin America – Brazil, Mexico, Rest of Latin America; Middle East & Africa – GCC, South Africa, Rest of MEA |
| Competitive Landscape | Apple Inc., Google LLC, Microsoft Corporation, PTC Inc., Samsung Electronics Co., Ltd., Meta Platforms, Inc., Snap Inc., Sony Corporation, Blippar, Wikitude GmbH, Magic Leap, Inc. |
| Customization Scope | Customization for segments, region/country-level will be provided. Moreover, additional customization can be done based on the requirements. |
| Purchase Options | We have three licenses to opt for: Single User License, Multi-User License (Up to 5 Users), Corporate Use License (Unlimited Users and Printable PDF) |





























