


Report Overview
The Global Logistics Software Market is projected to grow from USD 14.6 billion in 2025 to USD 31.3 billion by 2035, at a CAGR of 8.0%. North America leads with a 39.12% share, equal to about USD 5.7 billion. This growth is closely linked to rising global trade and more complex freight operations. Around 80% of global merchandise trade moves by sea, while containerized trade is expected to reach nearly 178 million TEUs and grow by about 4–5% annually during the mid-2020s.
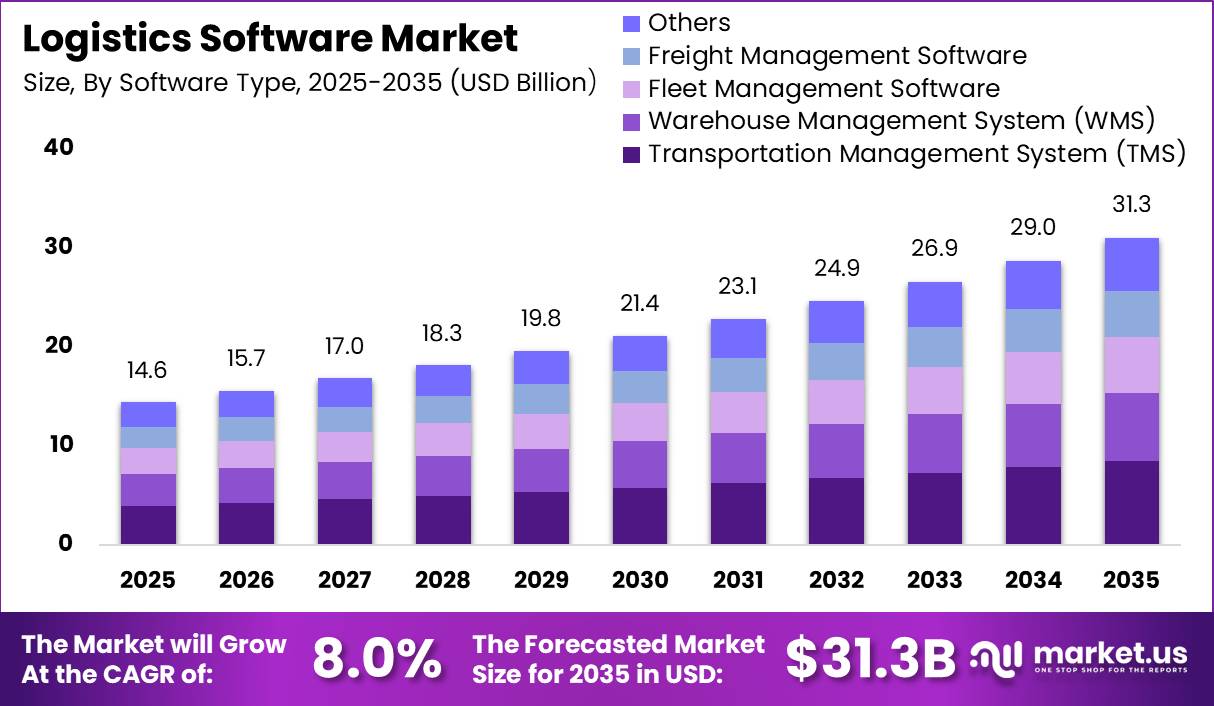
Global trade in goods and services is also expected to exceed USD 35 trillion in 2025, increasing by nearly USD 2.2 trillion, or 7%, compared with 2024. These trends are increasing demand for digital tools used for shipment planning, route optimization, freight cost control, slot booking, and real-time tracking across millions of shipments. The United States represents a major share of global GDP and handles large domestic and international freight flows.
Services trade, including transport and logistics, is expected to grow by nearly 9% year-on-year in 2025, adding hundreds of billions of dollars in activity that requires digital management. Each percentage point increase in trade volume can create millions of additional orders, delivery points, and routing decisions. Since manual systems cannot manage this scale, demand for transport management systems, warehouse software, and real-time visibility platforms will continue to rise, supporting market growth beyond USD 30 billion by 2035.
Key Takeaway
- The Global Logistics Software Market is projected to grow from USD 14.6 billion in 2025 to USD 31.3 billion by 2035, at a CAGR of 8.0%.
- Transportation Management Systems (TMS) dominate by software type with a 27.0% share.
- On-premise deployment leads with a 47.3% share, while hybrid deployment is the fastest-growing model.
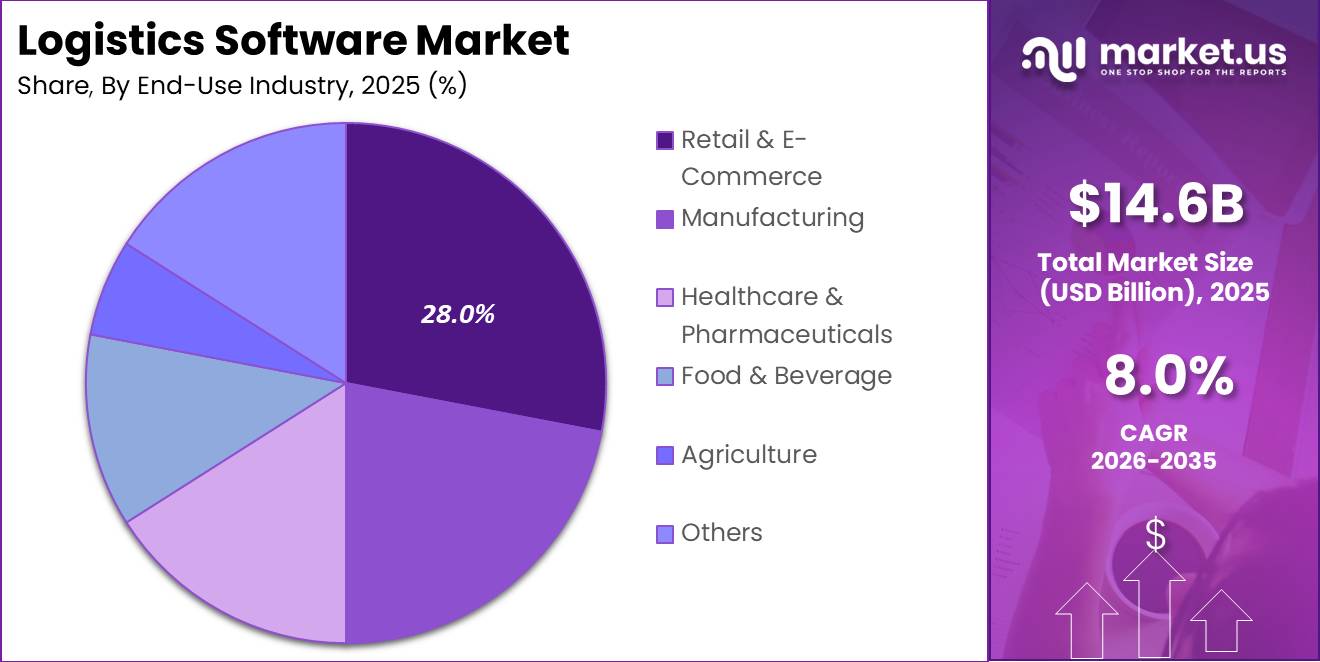
- Retail and e-commerce lead by end-use industry with a 28.0% share, while manufacturing is the fastest-growing segment.
- Professional services hold a 62.0% share of the service segment.
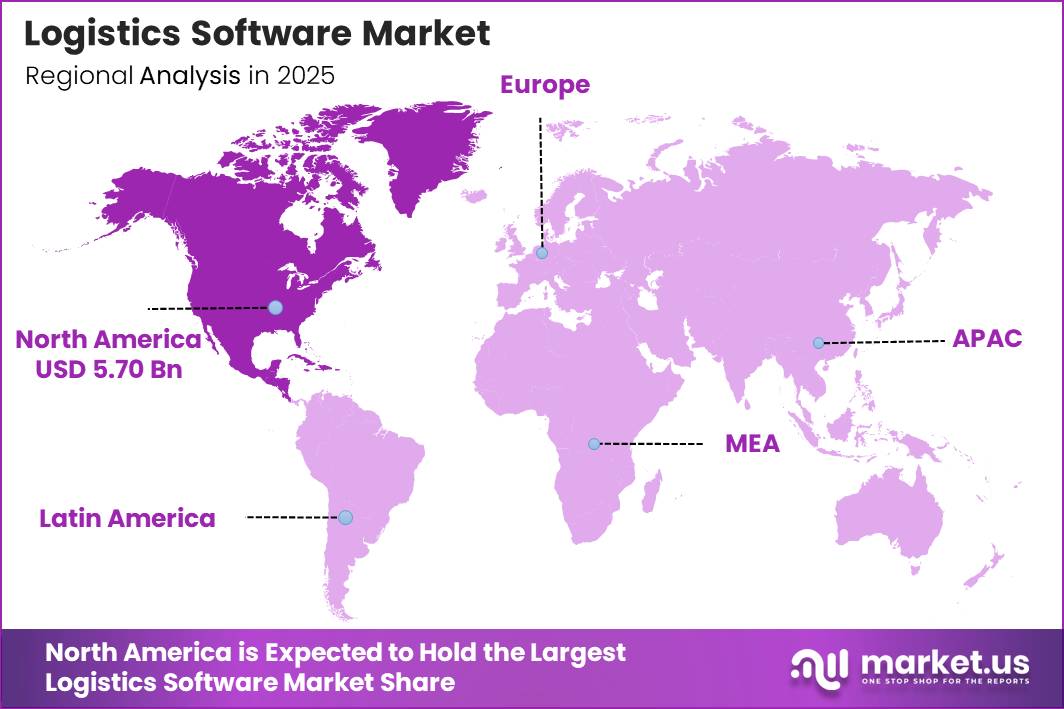
- North America leads the market with a 39.12% share, valued at approximately USD 5.7 billion in 2025.
By Software Type
Transportation Management Systems (TMS) hold a leading 27.0% share of the logistics software market because they manage the movement of goods across complex transport networks. These platforms support route planning, carrier selection, shipment scheduling, load building, cost control, and delivery tracking. Global trade is expected to exceed USD 35 trillion in 2025, with trade in goods adding around USD 1.5–1.8 trillion and services contributing nearly USD 700 billion within a single year.
Each shipment requires decisions related to transport mode, delivery lane, carrier availability, transit time, fuel use, and service quality. These activities are mainly handled through TMS platforms rather than general business or back-office software. A 7% annual increase in global trade can create tens of millions of additional consignments and delivery locations, making manual transport planning difficult and costly.
By Deployment Mode
On-Premise deployment holds a leading 47.3% share of the logistics software market. Large logistics companies, shipping firms, and transport operators continue to run their main transaction systems and databases within their own data centres. This approach provides stronger control over security, regulatory compliance, system reliability, access rights, and sensitive business information.
Government and policy reports show that logistics costs can account for around 7–9% of a country’s GDP. In India, logistics costs were estimated at nearly 7.8–8.9% of GDP, representing more than INR 24 lakh crore in 2023–24. This shows the strategic importance of logistics operations and explains why many companies remain cautious about moving critical systems fully to public cloud platforms.
By End-Use Industry
Retail and E-commerce hold a leading 28.0% share of the logistics software market, supported by high order volumes and the growing complexity of online deliveries. Global e-commerce sales reached around USD 27 trillion in 2022, with B2C retail contributing nearly one-quarter of the total value. Online retail accounted for about 25–30% of total retail sales in China, the United Kingdom, and Korea, compared with around 15% in the United States.
Parcel volumes increased by 5.7% in 2023 and by a further 4.4% in 2024. They also grew by an additional 4% during the first half of 2025. This rise represents billions of deliveries that require digital planning, tracking, billing, and returns management. Each online order involves several logistics activities, including inventory allocation, warehouse picking and packing, carrier selection, route planning, final delivery, and product returns.
By Service
Professional services hold a leading 62.0% share of the logistics software market because many logistics and supply chain companies require expert support beyond purchasing software licences. These services include consulting, system design, implementation, integration, employee training, maintenance, and continuous process improvement.
The World Bank’s Logistics Performance Index 2.0 shows that stronger trade logistics depend on improvements across infrastructure, customs procedures, digital tracking, and logistics services. Software alone cannot deliver these improvements unless companies also redesign workflows, connect data sources, and train employees to use the technology properly.
Key Market Segments
By Software Type
- Transportation Management System (TMS)
- Warehouse Management System (WMS)
- Fleet Management Software
- Freight Management Software
- Others
By Deployment Mode
- On-Premise
- Cloud-Based
- Hybrid (Fastest Growing)
By End-Use Industry
- Retail & E-Commerce
- Manufacturing
- Healthcare & Pharmaceuticals
- Food & Beverage
- Agriculture
- Others
By Service
- Professional Services
- Implementation & Integration
- Training & Education
- Consulting & Advisory
- Managed Services
Geopolitical Impact Analysis
Geopolitical tensions are increasing demand for logistics software by creating major changes in transport costs, routes, and delivery times. The Red Sea crisis has forced many Asia–Europe shipping services to avoid the Suez Canal and travel around the Cape of Good Hope, adding around 8–20 days to transit times. This diversion has raised charter costs by nearly 33% for a 12,500-TEU container ship operating at about USD 50,000 per day. Suez Canal transit fees also increased by 5–15% in 2024, while war-risk and emergency surcharges reached USD 1,500–4,000 per container on selected routes.
Trade tensions are creating additional pressure. Since 2018, effective tariffs on selected manufactured goods, electronics, and other targeted product categories have increased to around 10–25%. These measures affect the cost of servers, networking equipment, mobile devices, and finished goods moving through global supply chains.
For logistics operators, an additional 10–20 days of transit, double-digit route surcharges, and tariffs of up to 25% can significantly increase shipment costs and delivery risks. Companies are therefore using Transportation Management Systems and other logistics platforms to change routes, calculate total landed costs, compare transport modes, and shift volumes across different trade corridors. These tools also support nearshoring and friend-shoring strategies.
Regional Analysis
North America holds a dominant 39.12% share of the global logistics software market, valued at approximately USD 5.70 billion in 2025. The region’s leadership is supported by its well-developed third-party logistics, parcel delivery, e-commerce, and omnichannel retail networks. Companies across the United States and Canada were early users of Transportation Management Systems, Warehouse Management Systems, and real-time shipment visibility platforms.
These solutions are widely used for freight planning, long-haul transportation, last-mile delivery, freight auditing, inventory coordination, and customer delivery management. Strong technology spending by retailers, manufacturers, carriers, and logistics service providers further supports market demand.
Asia-Pacific is expected to be the fastest-growing regional market. Growth is supported by expanding manufacturing activity, rapid industrial development, increasing online retail sales, and rising cross-border trade across China, India, and Southeast Asia. Higher container volumes and the development of new warehouses and regional distribution centres are increasing the need for digital logistics tools.
Key Regions and Countries
North America
- US
- Canada
Europe
- Germany
- France
- The UK
- Spain
- Italy
- Rest of Europe
Asia Pacific
- China
- Japan
- South Korea
- India
- Australia
- Rest of APAC
Latin America
- Brazil
- Mexico
- Rest of Latin America
Middle East & Africa
- GCC
- South Africa
- Rest of MEA
Market Dynamics
Drivers
| Driver | (~) % CAGR | Geographic Relevance | Impact Timeline |
|---|---|---|---|
| E-Commerce Volume Surge & Last-Mile Demand | +2.8% | Global; highest intensity in Asia-Pacific, North America | Short term (≤ 2 years) |
| AI & Machine Learning Embedded in Core Modules | +2.2% | Global; early concentration in North America, Western Europe | Short term (≤ 2 years) |
| SaaS & Cloud Migration Replacing On-Premise TMS/WMS | +1.9% | Global; rapid uptake in Asia-Pacific, Latin America | Short term (≤ 2 years) |
| Cross-Border Trade Complexity & Customs Digitization | +1.3% | Europe, APAC, Middle East & Africa | Medium term (2–4 years) |
| Supply Chain Visibility Mandates from Large Enterprise Shippers | +1.0% | North America, Europe | Short term (≤ 2 years) |
| IoT Sensor Integration & Real-Time Freight Tracking | +0.8% | Global; infrastructure-led in developed markets | Medium term (2–4 years) |
E-Commerce Volume Surge & Last-Mile Demand
The structural acceleration of e-commerce, with the global e-commerce logistics market valued at approximately USD 524 billion in 2025 and projected toward USD 2.5 trillion by 2034 at a ~18.9% CAGR, is the single most powerful demand multiplier for logistics software today. Every incremental parcel shipment requires a software touchpoint: route optimization, dynamic dispatch, proof-of-delivery capture, and returns processing.
The last-mile delivery software sub-segment alone is forecast to expand from USD 13.6 billion in 2026 to USD 33.4 billion by 2033 at a 13.7% CAGR, reflecting the disproportionate software intensity of the final-mile leg where 53% of total logistics cost is incurred.
Between 2024 and 2025, leading platform providers reported annual contract value (ACV) growth of 18–25% as mid-market retailers mandated real-time consumer-facing delivery ETAs, and quick-commerce operators in markets such as India and Southeast Asia drove adoption of sub-30-minute dispatch optimization modules, a use case that did not commercially exist at scale before 2022.
Restraints
| Restraint | (~) % CAGR | Geographic Relevance | Impact Timeline |
|---|---|---|---|
| Cybersecurity & Cross-Border Data Privacy Compliance Costs | -1.8% | Europe (GDPR), North America (CCPA), emerging APAC frameworks | Short term (≤ 2 years) |
| High Upfront Implementation & Integration Costs for Mid-Market Buyers | -1.3% | Global; most acute in Latin America, South & Southeast Asia | Short term (≤ 2 years) |
| Restrictive Cross-Border Data Transfer Regulations | -0.9% | China, EU, India (DPDP Act), Middle East | Medium term (2–4 years) |
| Elevated Interest Rates Suppressing CapEx & Long-Term SaaS Commitments | -0.7% | Global; highest impact in emerging economies | Short term (≤ 2 years) |
| Vendor Lock-In Risk Delaying Procurement Decisions | -0.5% | North America, Europe | Medium term (2–4 years) |
Cybersecurity & Cross-Border Data Privacy Compliance Costs
The logistics software ecosystem is categorically supply-chain-critical infrastructure: it processes shipment manifests, carrier contract rates, customer addresses, financial settlement data, and, in multimodal contexts. The global average cost of a data breach reached USD 4.44 million in 2025, and for U.S.-domiciled supply chain operators specifically, the figure escalated to a record USD 10.22 million per incident, reflecting the liability tail created by CCPA enforcement and class-action jurisprudence.
For logistics software vendors, compliance with GDPR (effective 2018, materially re-enforced via EUR 1.2 billion Meta penalty precedent in 2023), India’s Digital Personal Data Protection Act, and emerging GCC data residency mandates requires maintaining geo-segmented cloud architectures, increasing infrastructure redundancy spend by an estimated 12–18% of annual cloud OPEX per additional jurisdiction.
This structural compliance overhead directly compresses gross margins for SaaS vendors targeting multi-region deployments — a segment representing over 60% of total addressable enterprise logistics software spend — and forces smaller ISVs to defer international market entry, concentrating pricing power in the handful of incumbents with pre-built compliance stacks, thereby slowing the competitive dynamism that would otherwise accelerate category growth.
Challenges
| Challenge | (~) % CAGR | Geographic Relevance | Mitigation Horizon |
|---|---|---|---|
| Legacy System Integration Complexity | -1.6% | Global; most acute in manufacturing-heavy Europe & North America | Medium term (2–4 years) |
| Tech Talent Shortage & Skills Gap | -1.2% | Global; structural in South Asia, Sub-Saharan Africa | Long term (≥ 4 years) |
| Platform Interoperability & Data Standards Fragmentation | -0.9% | Global; highest complexity in multimodal EU trade corridors | Long term (≥ 4 years) |
| AI Model Accuracy & Bias in Demand Forecasting | -0.6% | Global; risk-elevated in high-SKU retail & perishables | Medium term (2–4 years) |
| Geopolitical Disruption & Multi-Routing Complexity | -0.5% | Trans-Pacific, Red Sea corridors, Eastern Europe | Short term (≤ 2 years) |
Legacy System Integration Complexity
An estimated 65–70% of mid-to-large logistics operators in North America and Europe still run Transportation Management Systems (TMS) or Warehouse Management Systems (WMS) built on architectures that predate REST API standards, with some enterprise ERPs, particularly SAP R/3 and Oracle E-Business Suite deployments, running core logistics modules on code bases exceeding 20 years in age.
The fundamental structural problem is not the age of these systems per se, but their monolithic coupling: a single data schema change in a legacy WMS can cascade into 60–120 days of regression testing, making even a minor integration with a new cloud TMS prohibitively disruptive to live operations without a full parallel-running environment.
Middleware and API gateway adoption has accelerated with leading iPaaS vendors reporting 30–40% year-on-year growth in logistics-vertical connector libraries between 2023 and 2025, but the underlying problem of data model heterogeneity cannot be resolved by connectivity alone and requires organizational re-engineering that typically spans 18–36 months and consumes 15–25% of total IT budgets for affected enterprises.
Opportunities
| Opportunity | (~) % CAGR | Geographic Relevance | Execution Window |
|---|---|---|---|
| SMB & Emerging-Market Logistics Software Penetration | +2.4% | India, Southeast Asia, Sub-Saharan Africa, Latin America | Medium term (2–4 years) |
| Autonomous Vehicle & Drone Fleet Management Software Layer | +1.7% | North America, Europe, East Asia (pilot-to-commercial) | Long term (≥ 4 years) |
| Embedded Logistics Fintech (Dynamic Freight Finance & Insurance) | +1.3% | Global; highest upside in trade-finance-underserved APAC & Africa | Medium term (2–4 years) |
| Sustainability & Carbon Tracking Modules (ESG Compliance Layer) | +1.0% | Europe (CSRD-driven), North America, APAC large corporates | Short term (≤ 2 years) |
| Control Tower & Supply Chain Orchestration Platform Consolidation | +0.8% | North America, Western Europe | Medium term (2–4 years) |
SMB & Emerging-Market Logistics Software Penetration
This is explicitly an untapped white space rather than an active driver: while enterprise-tier logistics software penetration in North America and Western Europe exceeds 70% of addressable accounts, SMBs defined broadly as freight operators, regional 3PLs, and distributors with annual revenues below USD 50 million represent fewer than 22% of deployed logistics software seats globally as of 2025, despite constituting over 80% of total logistics operator count by entity.
India’s freight and logistics market alone is valued at approximately USD 349 billion in 2025, projected to cross USD 545 billion by 2030, yet the majority of regional transporters and last-mile distributors in Tier-2 and Tier-3 geographies still manage operations via spreadsheets, WhatsApp dispatch groups, and paper consignment notes representing a structurally unmonetized TAM for lightweight, mobile-first SaaS TMS products priced at USD 30–150 per vehicle per month.
Key Players Analysis
Tier-1 vendors in the logistics software market include SAP, Oracle, Manhattan Associates, WiseTech Global, and Descartes Systems Group. These companies offer broad cloud platforms with transportation, warehouse, supply chain, and fulfilment capabilities. SAP recorded 8% total revenue growth in 2025, while cloud revenue increased by 23% and cloud ERP revenue rose by 28%. Its total cloud backlog reached EUR 77 billion.
Oracle generated USD 44.0 billion from cloud services and licence support in fiscal 2025, up 12%. Manhattan Associates reported USD 1.081 billion in 2025 revenue, including USD 408.1 million from cloud subscriptions and USD 503.0 million from services, with GAAP operating income of USD 279.8 million. Its estimated market share is around 3–5%. WiseTech Global and Descartes generated approximately USD 650–900 million in FY2025 revenue, supported by double-digit growth.
Tier-2 vendors include Blue Yonder, Infor, Körber, E2open, Trimble, Kinaxis, project44, MercuryGate, TMC, and Flexport. Blue Yonder reported nearly USD 1.42 billion in FY2025 revenue, with SaaS revenue growth of 10.4% and net revenue retention of 103.8%. Trimble’s transportation and logistics segment generated USD 527 million in 2025, including USD 508 million in annual recurring revenue, with more than 90% of revenue recurring. Descartes reported USD 651.0 million in FY2025 revenue, up 14%.
Overall, Tier-1 vendors are estimated to control 55–65% of the market, while Tier-2 companies account for the remaining 35–45%.
Top Key Players in the Market
- SAP SE
- Oracle Corporation
- Blue Yonder Group Inc. (Panasonic)
- Manhattan Associates Inc.
- E2open Parent Holdings Inc.
- WiseTech Global Ltd.
- Descartes Systems Group Inc.
- Infor (Koch Industries)
- Körber AG (HighJump)
- C.H. Robinson (TMC Division)
- MercuryGate International Inc.
- project44 Inc.
- Trimble Inc. (Transportation Division)
- Kinaxis Inc.
- Flexport Inc.
Recent Developments
- In March 2026, Descartes Systems Group expanded its AI-based logistics capabilities through the acquisition of OrderMine, a provider of order management and demand forecasting solutions. The deal followed the company’s FY2025 revenue of approximately US$651 million and continued double-digit growth.
- In 2026, Trimble’s transportation and logistics segment generated approximately US$527 million in annual revenue. Annual recurring revenue reached nearly US$508 million, while more than 90% of segment revenue came from recurring subscriptions. =
Report Scope
| Report Features | Description |
|---|---|
| Market Value (2025) | USD 14.6 Billion |
| Forecast Revenue (2035) | USD 31.3 Billion |
| CAGR (2026-2035) | 8.0% |
| Base Year for Estimation | 2025 |
| Historic Period | 2020-2024 |
| Forecast Period | 2026-2035 |
| Report Coverage | Revenue Forecast, Market Dynamics, Competitive Landscape, Recent Developments |
| Segments Covered | By Software Type (Transportation Management System (TMS), Warehouse Management System (WMS), Fleet Management Software, Freight Management Software, Others), By Deployment Mode (On-Premise, Cloud-Based, Hybrid), By End-Use Industry (Retail & E-Commerce, Manufacturing, Healthcare & Pharmaceuticals, Food & Beverage, Agriculture, Others), By Service (Professional Services, Managed Services) |
| Regional Analysis | North America – US, Canada; Europe – Germany, France, The UK, Spain, Italy, Rest of Europe; Asia Pacific – China, Japan, South Korea, India, Australia, Singapore, Rest of APAC; Latin America – Brazil, Mexico, Rest of Latin America; Middle East & Africa – GCC, South Africa, Rest of MEA |
| Competitive Landscape | SAP SE, Oracle Corporation, Blue Yonder Group Inc. (Panasonic), Manhattan Associates Inc., E2open Parent Holdings Inc., WiseTech Global Ltd., Descartes Systems Group Inc., Infor (Koch Industries), Körber AG (HighJump), C.H. Robinson (TMC Division), MercuryGate International Inc., project44 Inc., Trimble Inc. (Transportation Division), Kinaxis Inc., Flexport Inc. |
| Customization Scope | Customization for segments and region/country-level will be provided. Moreover, additional customization can be done based on the requirements. |
| Purchase Options | We have three licenses to opt for: Single User License, Multi-User License (Up to 5 Users), Corporate Use License (Unlimited Users and Printable PDF) |





























