


Report Overview
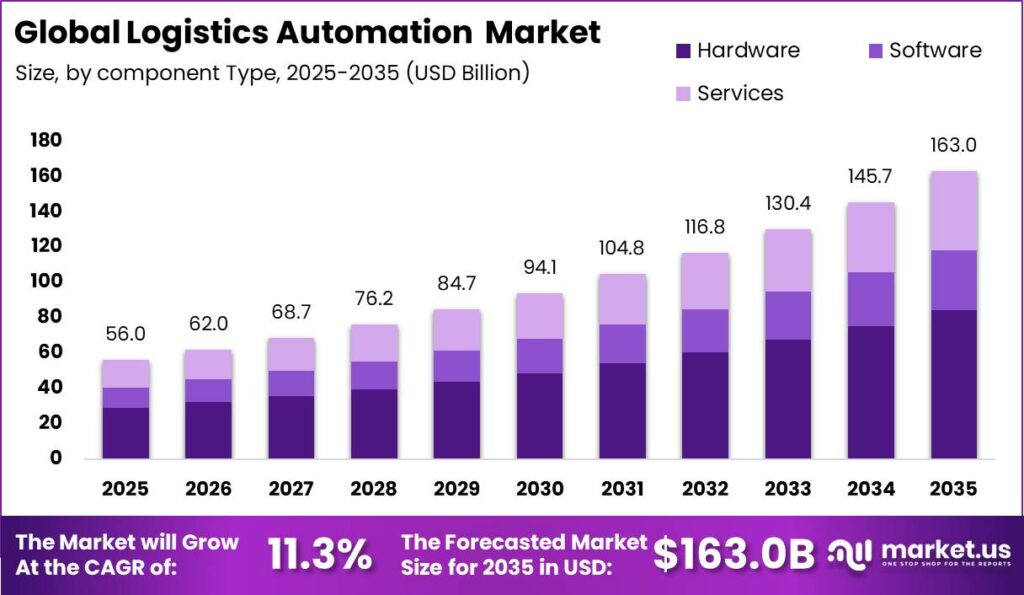
Global Logistics Automation Market size is expected to be worth around USD 163.00 Billion by 2035 from USD 56.00 Billion in 2025, growing at a CAGR of 11.3% during the forecast period 2026 to 2035. This growth reflects a structural shift from manual handling toward automated, software-driven fulfillment across global supply chains.
The logistics automation market covers hardware, software, and services that move, store, and track goods without heavy manual labor. Systems span warehouse robots, conveyors, storage and retrieval units, and control software. Buyers deploy these tools to raise throughput and cut error rates. This structure lets operators scale volume without adding proportional headcount, protecting margins as order counts climb.
Key Takeaways
- Global Logistics Automation Market size reached USD 56.00 Billion in 2025 and will hit USD 163.00 Billion by 2035 at a CAGR of 11.3%.
- Hardware led the By Component segment with a 51.80% share in 2025.
- Warehouse Automation held 42.60% of the By Automation Type segment.
- Large Enterprises accounted for 64.20% of the By Organization Size segment.
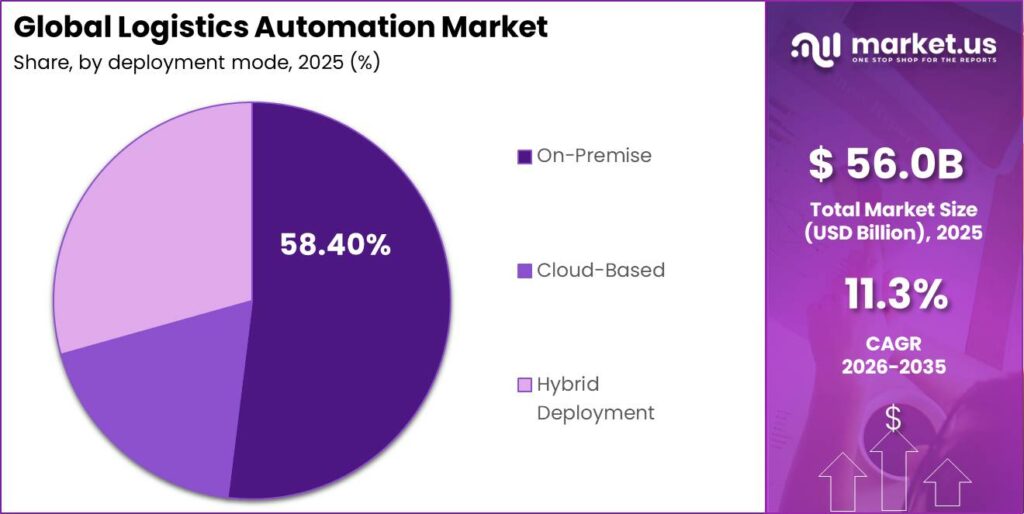
- On-Premise deployment captured 58.40% of the By Deployment Mode segment.
- Warehousing and Distribution led applications with a 36.70% share.
- Retail and E-Commerce dominated end users with a 29.80% share.
- Barcode and RFID-Based Automation led the By Technology segment at 34.90%.
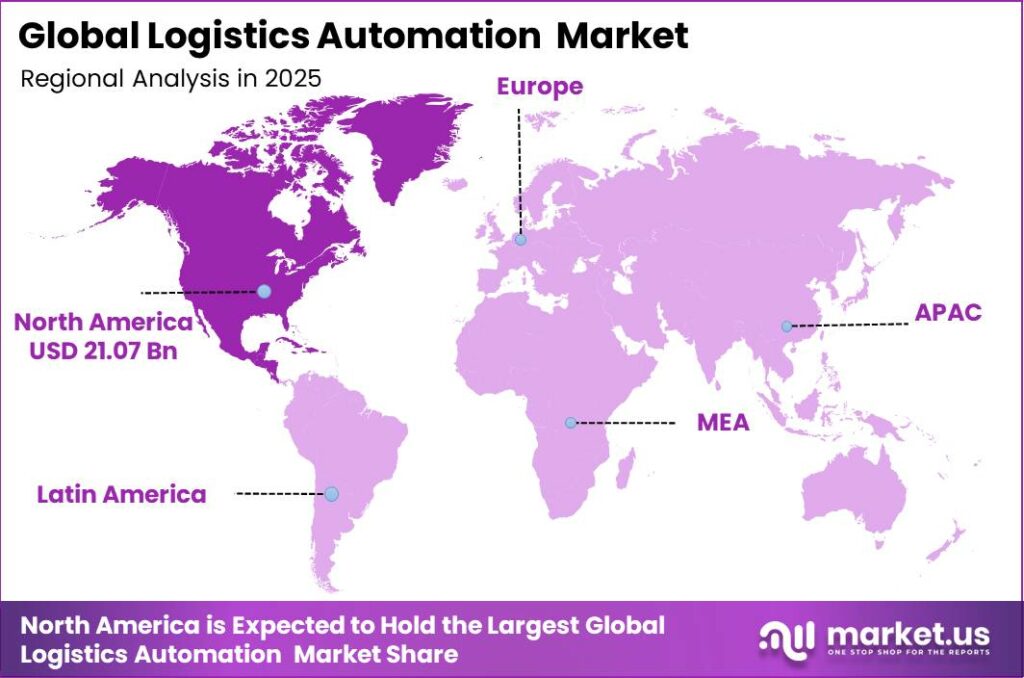
- North America dominated regionally with a 37.60% share, valued at USD 21.07 Billion.
Government policy and public investment now shape automation demand directly. Several national programs fund warehousing and logistics corridors to strengthen supply chain resilience. This means vendors that align product roadmaps with public infrastructure spending gain a clearer, funded pipeline. Suppliers who ignore these programs risk losing early positioning in fast-forming national fulfillment networks.
Manufacturers back this demand with large capacity commitments. Daifuku committed a ¥52 billion investment program in May 2025 to expand production, research, and global automation growth. This scale of spending signals confidence in sustained order flow. As a result, buyers can expect shorter lead times and broader system availability, which lowers deployment risk for first-time adopters.
According to IFR, global sales of professional service robots for transportation and logistics rose 44% between 2021 and 2022. This jump reflects operators replacing scarce manual labor with machines. Companies that delay robotic adoption will face higher unit costs than automated rivals. Data from OECD shows 89% of employers reported labor shortage concerns in 2024, which pushes warehouse operators toward automated handling to protect output.
Component Analysis
Hardware dominates with 51.80% due to physical robots conveyors storage racks.
In 2025, Hardware held a dominant market position in the By Component segment of Logistics Automation Market, with a 51.80% share. According to IFR, factories installed 542,000 industrial robots worldwide in 2024, more than double the count a decade earlier. This installed base drives steady hardware spend. Vendors selling robots and racks capture the largest revenue pool, so hardware leadership remains the core profit engine.
Software coordinates every automated machine and ranks as the fastest growing sub-segment. IFR data shows the global operational stock of industrial robots reached 4,664,000 units in 2024, a 9% annual rise. Each new robot needs orchestration software. This creates recurring license demand, so software vendors can build durable subscription revenue that outpaces one-time hardware sales.
Services support installation, integration, and maintenance across complex sites. IFR reports professional service robot sales reached almost 200,000 units in 2024, up 9% year on year. Each deployment needs commissioning and upkeep. This means service providers earn steady annuity income long after the initial sale, giving them stable cash flow that hardware-only firms cannot match.
Automation Type Analysis
Warehouse Automation dominates with 42.60% due to high-volume order fulfillment scale.
In 2025, Warehouse Automation held a dominant market position in the By Automation Type segment of Logistics Automation Market, with a 42.60% share. As reported by Pitney Bowes, India’s parcel volume grew 18% in 2022, signaling surging fulfillment demand. Warehouses must automate to keep pace. This concentrates spending in warehouse systems, making them the primary target market for solution vendors.
Autonomous Mobile Robots move goods flexibly across changing floor layouts and rank as the fastest growing type. IFR found professional service robot sales rose 30% worldwide in a recent year, reflecting rapid mobile robot uptake. This flexibility suits variable e-commerce volumes. As a result, AMR vendors can win buyers who need scalable capacity without fixed conveyor infrastructure.
Automated Storage and Retrieval Systems maximize vertical space in dense facilities. Conveyor and Sortation Systems move parcels at high speed along fixed routes. Automated Guided Vehicles handle repeatable transport tasks on set paths. Robotic Picking and Palletizing Systems complete order assembly, and together these four types hold the remaining share collectively, giving integrators a broad multi-system portfolio to sell.
Organization Size Analysis
Large Enterprises dominate with 64.20% due to bigger automation capital budgets.
In 2025, Large Enterprises held a dominant market position in the By Organization Size segment of Logistics Automation Market, with a 64.20% share. World Bank trade indicators show global merchandise trade volume expanded through 2024, concentrating flows in large distributors. These firms fund big projects. Their capital depth makes them the anchor buyers that automation vendors prioritize for early revenue.
Small and Medium Enterprises adopt automation through flexible, lower-cost models and rank as the fastest growing group. IFR data shows service robot installations reached almost 200,000 units in 2024, with entry-level systems widening buyer access. This shift opens a large new cohort. Vendors offering subscription pricing can capture SME demand that was previously priced out of the market.
Deployment Mode Analysis
On-Premise dominates with 58.40% due to direct data control needs.
In 2025, On-Premise held a dominant market position in the By Deployment Mode segment of Logistics Automation Market, with a 58.40% share. ITU data shows global fixed broadband subscriptions kept rising through 2024, yet many operators still keep control systems local. This reflects security priorities. On-premise leadership means integrators must support local hosting to win large regulated accounts.
Cloud-Based deployment scales fast and lowers upfront cost, ranking as the fastest growing mode. ITU reports global internet users passed 5.5 billion in 2024, expanding reliable connectivity for warehouses. This connectivity supports remote orchestration. As a result, cloud vendors can reach SME buyers who lack in-house IT teams, widening their addressable base.
Hybrid Deployment blends local control with cloud analytics for operators who need both. This model suits firms migrating gradually from legacy systems. Hybrid holds the remaining share, and its bridging role lets vendors retain accounts during multi-year transitions instead of losing them to pure cloud rivals.
Application Analysis
Warehousing and Distribution dominates with 36.70% due to core storage handling volume.
In 2025, Warehousing and Distribution held a dominant market position in the By Application segment of Logistics Automation Market, with a 36.70% share. According to Pitney Bowes, global parcel volume was forecast toward 220 billion parcels by 2026. This surge floods distribution centers. Warehousing applications therefore command the deepest automation spend across all use cases.
E-Commerce Fulfillment handles fast, single-unit orders and ranks as the fastest growing application. Pitney Bowes reported a 14.8% CAGR outlook for global parcel volume. This pace strains manual picking. As a result, fulfillment automation vendors gain the strongest demand tailwind, letting them price systems for rapid payback.
Transportation Management coordinates fleet and route flows, while Inventory and Order Management tracks stock accuracy. Freight and Parcel Sorting speeds outbound throughput, and Cold Chain Logistics protects temperature-sensitive goods. These four applications hold the remaining share collectively, giving vendors adjacent markets to expand into once warehouse deals close.
End User Analysis
Retail and E-Commerce dominates with 29.80% due to high order fulfillment frequency.
In 2025, Retail and E-Commerce held a dominant market position in the By End User segment of Logistics Automation Market, with a 29.80% share. As reported by Pitney Bowes, India led global parcel growth at 18% in 2022. Retailers must automate to fulfill this volume. This makes retail the largest single buyer group for warehouse robotics.
Third-Party Logistics providers run fulfillment for many clients at once and rank as the fastest growing end user. IFR data shows industrial robot operational stock hit 4,664,000 units in 2024. 3PLs deploy heavily to serve varied contracts. This concentrates repeat demand, so vendors that win a 3PL account gain multi-site expansion potential.
Manufacturing feeds production lines with parts, while Healthcare and Pharmaceuticals demand precise, traceable handling. Food and Beverage needs high-speed sortation, and Automotive relies on heavy-part transport. These four end users hold the remaining share collectively, giving vendors diverse verticals that smooth demand across economic cycles.
Technology Analysis
Barcode and RFID-Based Automation dominates with 34.90% due to proven low-cost tracking.
In 2025, Barcode and RFID-Based Automation held a dominant market position in the By Technology segment of Logistics Automation Market, with a 34.90% share. World Bank indicators show rising global trade flows through 2024, which demand accurate item tracking. Barcode and RFID meet this need cheaply. Their low cost keeps them the default tracking layer across most facilities.
AI and Machine Learning-Based Automation optimizes routing and picking and ranks as the fastest growing technology. IFR reports professional service robot sales rose 30% worldwide recently, many carrying AI control. This intelligence lifts throughput. As a result, AI vendors can charge premium prices for measurable productivity gains.
Internet of Things links sensors for real-time visibility, while Computer Vision enables accurate robotic picking. Digital Twin and Predictive Analytics simulate operations to cut downtime. These technologies hold the remaining share collectively, giving vendors a layered upgrade path that expands wallet share within existing accounts.
Key Market Segments
By Component
- Hardware
- Software
- Services
By Automation Type
- Warehouse Automation
- Autonomous Mobile Robots (AMRs)
- Automated Storage & Retrieval Systems (AS/RS)
- Conveyor & Sortation Systems
- Automated Guided Vehicles (AGVs)
- Robotic Picking & Palletizing Systems
By Organization Size
- Large Enterprises
- Small & Medium Enterprises (SMEs)
By Deployment Mode
- On-Premise
- Cloud-Based
- Hybrid Deployment
By Application
- Warehousing & Distribution
- E-Commerce Fulfillment
- Transportation Management
- Inventory & Order Management
- Freight & Parcel Sorting
- Cold Chain Logistics
By End User
- Retail & E-Commerce
- Third-Party Logistics (3PL) Providers
- Manufacturing
- Healthcare & Pharmaceuticals
- Food & Beverage
- Automotive
By Technology
- Barcode & RFID-Based Automation
- AI & Machine Learning-Based Automation
- Internet of Things (IoT)
- Computer Vision
- Digital Twin & Predictive Analytics
Regional Analysis
North America Dominates the Logistics Automation Market with a Market Share of 37.60%, Valued at USD 21.07 Billion
North America led the Logistics Automation Market in 2025 with a 37.60% share worth USD 21.07 Billion. High labor costs and dense e-commerce networks push operators toward automation. In July 2025, Swisslog partnered with Sumitomo Drive Technologies USA to deploy an AutoStore system with 14 robots, 22,872 storage bins, and 11 autonomous forklifts. This scale shows how mature buyers adopt fully integrated systems.
Asia Pacific ranks as the fastest growing region as parcel volumes and greenfield warehousing expand rapidly. In April 2025, Daifuku began operations at a new intralogistics manufacturing facility in Hyderabad, expanding regional production capacity. This local build-out lowers lead times. As a result, Asia Pacific buyers gain faster access to systems, accelerating first-time automation adoption across the region.
Key Regions and Countries
North America
- US
- Canada
Europe
- Germany
- France
- The UK
- Spain
- Italy
- Rest of Europe
Asia Pacific
- China
- Japan
- South Korea
- India
- Australia
- Rest of APAC
Latin America
- Brazil
- Mexico
- Rest of Latin America
Middle East and Africa
- GCC
- South Africa
- Rest of MEA
Market Dynamics
Market Opportunity Analysis - Underserved deployment modes segments and regions open entry points for new players
Cloud-Based deployment stays underexploited despite ranking as the fastest growing mode against On-Premise dominance at 58.40%. Many operators still fear moving control systems off-site. This hesitation leaves room for vendors that prove secure hosting. Consequently, cloud-native providers can win SME accounts before on-premise incumbents adapt, capturing durable subscription revenue in an open field.
Small and Medium Enterprises remain the clearest white space, since Large Enterprises hold 64.20% of the By Organization Size segment. Most SMEs lack the capital for one-time system purchases. This creates a large untapped pool for flexible pricing. Therefore vendors offering subscription access can convert these firms into first-time buyers well ahead of slower rivals.
Asia Pacific offers greenfield upside as the fastest growing region against North America’s 37.60% lead. New facilities there carry no legacy retrofit barriers. This lets operators install modern systems from day one. As a result, vendors that localize production and service gain first-mover advantage across fast-building regional fulfillment networks.
Technology and Innovation Landscape - AI computer vision and digital twins redefine warehouse competitiveness
AI and Machine Learning-Based Automation ranks as the fastest growing technology against Barcode and RFID leadership at 34.90%. These systems optimize routing and picking in real time. This intelligence lifts throughput without added labor. Consequently, vendors embedding AI can command premium pricing tied to measurable productivity gains for buyers.
Computer Vision enables robotic picking of mixed-SKU orders that manual scanners cannot match. This accuracy reduces mispicks and returns. Buyers cut costly fulfillment errors as a result. Therefore vision-enabled robotics vendors hold a clear advantage in high-variety e-commerce accounts where order accuracy directly protects customer retention.
Digital Twin and Predictive Analytics simulate warehouse operations before physical changes occur. This modeling exposes bottlenecks early and cuts downtime. Operators avoid costly trial-and-error redesigns. As a result, vendors offering digital twin tools help buyers protect uptime, turning simulation software into a durable, margin-rich upsell across installed accounts.
Drivers
The root cause is a permanent shift in consumer fulfillment expectations that has made manual warehouse operations non-viable for same-day and next-day delivery. Global B2C e-commerce parcel volumes crossed 200 billion shipments annually in 2024, up from about 131 billion in 2020. The U.S. market alone processed an estimated 37 billion parcels in 2024. This volume forces retailers and 3PLs to automate or lose the delivery-tier race.
The quantitative mechanism is a throughput-per-labor crisis. A manual center handling 50,000 to 80,000 orders daily needs about 500 to 800 associates at pick rates of 80 to 120 units per hour. Goods-to-person robotics run at 400 to 600 units per hour per station and cut headcount to 80 to 150 workers, saving 70 to 85% per unit picked. This math makes automation the default choice for scaling operators.
| Driver | (~) % Impact on CAGR Forecast | Geographic Relevance | Impact Timeline |
|---|---|---|---|
| E-Commerce Volume Surge & Same-Day Delivery Expectations Compelling Warehouse Automation Investment | +3.8% | United States, China, Europe, India, Southeast Asia, Middle East | Short term (≤ 2 years) |
| Structural Warehouse Labor Shortages & Rising Wage Costs Accelerating AMR & AS/RS Adoption | +2.9% | United States, Germany, Japan, South Korea, United Kingdom, Australia | Short term (≤ 2 years) |
| Supply Chain Resilience Investment Driving Nearshoring & Automated Distribution Center Build-Out | +1.7% | United States, Mexico, Poland, India, Vietnam, Germany | Short term (≤ 2 years) |
| AI-Powered Warehouse Management System (WMS) Integration Elevating Automation ROI Visibility | +1.4% | United States, Europe, China, Japan, South Korea | Medium term (2–4 years) |
| Cold Chain & Pharmaceutical Logistics Expansion Mandating Automated Temperature-Controlled Handling | +0.9% | United States, European Union, India, China, GCC, Japan | Medium term (2–4 years) |
Restraints
The root cause is a capital mismatch between enterprise-grade automation costs and mid-market financial capacity. A full AS/RS or goods-to-person install for a center handling 20,000 to 50,000 orders daily costs USD 8 to 35 million. This demands board approval and an IRR of 18 to 25% at firms running EBITDA margins of 4 to 9%. This gap freezes many mid-market decisions.
The bottleneck worsened as financing costs climbed from about 3 to 4% in 2021 to 7.5 to 9.5% through 2024 and 2025. This added USD 400,000 to 1.8 million to a USD 10 million project and stretched payback by 8 to 14 months. Consequently, 30 to 45% of scoped projects in the USD 5 to 20 million range were deferred, creating a frozen pipeline that rate cuts could unlock.
| Restraint | (~) % Impact on CAGR Forecast | Geographic Relevance | Impact Timeline |
|---|---|---|---|
| High Upfront CapEx & Long Payback Periods Freezing Investment Decisions Among Mid-Market Operators | -2.4% | Global, most acute in Europe, India, Latin America, and Southeast Asia mid-market 3PLs | Short term (≤ 2 years) |
| Elevated Interest Rates Constraining Equipment Financing & Lease Structures for Capital-Intensive Systems | -1.6% | United States, Europe, India, Brazil, Australia | Short term (≤ 2 years) |
| Union & Labor Regulation Opposition to Automation Deployment in Organized Logistics Facilities | -0.9% | United States, Germany, France, United Kingdom, South Korea | Medium term (2–4 years) |
| Export Control & Technology Transfer Restrictions on Advanced Robotics Components Between US & China | -0.6% | United States, China; indirect impact on global supply chains | Short term (≤ 2 years) |
| Legacy Warehouse Facility Constraints Preventing Retrofit of Automated Systems | -0.4% | United States, Europe — aging distribution center real estate stock | Medium term (2–4 years) |
Challenges
The structural vulnerability is the heterogeneous technology stack that a full automated center requires. A state-of-the-art facility integrates components from 6 to 12 distinct vendors, each with proprietary protocols and interfaces. A Warehouse Execution System must orchestrate 10,000 to 50,000 daily robotic tasks in real time. This complexity raises the risk of costly go-live failures.
The friction shows in project outcomes. Audit findings from 2022 to 2025 indicate 55 to 70% of mid-to-large projects saw go-live delays of 3 to 9 months, with integration defects causing 40 to 60% of delays. A six-month delay on a USD 15 million system defers USD 1.8 to 3.2 million in savings. This creates a revenue stream for integrators who master interoperability standards and middleware.
| Challenge | (~) % CAGR Friction Drag | Geographic Relevance | Mitigation Horizon |
|---|---|---|---|
| Robotics & Automation Systems Integration Complexity | -1.3% | Global, most acute in multi-vendor brownfield retrofit projects | Long term (≥ 4 years) |
| Skilled Robotics Technician & AI Engineer Talent Gap | -1.0% | United States, Germany, India, Japan, Southeast Asia | Long term (≥ 4 years) |
| Cybersecurity Vulnerability in Connected Warehouse Systems | -0.7% | Global, acute in critical infrastructure & pharmaceutical logistics | Medium term (2–4 years) |
| Semiconductor & Sensor Component Lead-Time Volatility | -0.5% | Global; impacts LIDAR, vision systems, and servo drive procurement | Medium term (2–4 years) |
| Interoperability Standards Fragmentation Across AMR Ecosystems | -0.4% | Global; complicates multi-vendor deployments in US, Europe, Japan | Medium term (2–4 years) |
Opportunities
This opportunity is untapped because the market’s dominant model is a one-time capital sale built for Tier-1 buyers absorbing USD 5 to 35 million in CapEx. This excludes mid-market operators with revenues of USD 30 to 300 million and automation budgets of USD 500,000 to 3 million. Automation-as-a-Service converts system cost into monthly operational spend, opening this large underpenetrated cohort.
Under a subscription structure, an AMR operator charges USD 0.08 to 0.18 per pick or USD 12,000 to 35,000 per robot yearly. This lets a mid-market operator access robotic throughput for USD 80,000 to 180,000 monthly instead of a USD 3 to 8 million upfront outlay. Providers earn gross margins of 55 to 70% at scale. Therefore first movers hold a 2026 to 2029 window before institutional capital commoditizes the model.
| Opportunity | (~) % Potential CAGR Upside | Geographic Relevance | Execution Window |
|---|---|---|---|
| Automation-as-a-Service (AaaS) & Robotics Subscription Models Unlocking Mid-Market & SME Demand | +2.3% | United States, Europe, India, Southeast Asia, Latin America | Medium term (2–4 years) |
| AI-Driven Autonomous Last-Mile Delivery & Micro-Fulfillment Center Automation | +1.6% | United States, China, Japan, South Korea, Europe, India (urban) | Long term (≥ 4 years) |
| India Logistics Automation Greenfield Expansion as a High-Growth First-Time Deployment Market | +1.1% | India — Tier-1 & Tier-2 city fulfillment networks; PM Gati Shakti-linked warehousing | Medium term (2–4 years) |
| Agricultural & Food Processing Cold Chain Automation in Emerging Economies | +0.7% | India, Southeast Asia, Sub-Saharan Africa, Latin America | Long term (≥ 4 years) |
| Defense & Government Secure Logistics Automation for Military Supply Chain Modernization | +0.4% | United States, Europe (NATO members), India, Australia | Long term (≥ 4 years) |
Key Company Insights
Daifuku Co., Ltd. holds a structural advantage through deep manufacturing scale and global service reach. As per our research, around 10,000 autonomous robotics patents were filed globally between 2019 and 2023. This innovation pace rewards firms with strong research pipelines. In April 2026, Daifuku acquired shares in Germany-based EISENMANN GmbH, strengthening its engineering base and widening its material handling capability across regions.
Honeywell International Inc. competes through software-led control and AI-driven visibility rather than hardware alone. As per our research, 70% of organizations have never implemented autonomous mobile robots. This gap signals a vast first-time buyer pool. Honeywell targets these buyers with orchestration platforms that lower adoption risk, positioning the firm to convert hesitant operators into long-term software subscription customers.
Key Players
- Honeywell International Inc.
- Siemens AG
- Dematic
- Swisslog Holding AG
- Knapp AG
- Murata Machinery, Ltd.
- SSI Schäfer Group
- TGW Logistics Group
- Vanderlande Industries B.V.
- Toyota Industries Corporation
- Jungheinrich AG
- Beumer Group
- Kion Group AG
- Geekplus Technology Co., Ltd.
Recent Developments
- January 2025: Honeywell launched Honeywell Velocity Control Tower, an AI-enabled platform providing real-time warehouse visibility, predictive analytics, and operational decision support for distribution and logistics facilities.
- March 2025: Geekplus launched three new warehouse robotics solutions at LogiMAT 2025, including PopPick v2, an upgraded RoboShuttle system, and the SkyCube pallet-to-person automation platform for high-throughput fulfillment.
- June 2025: Geekplus partnered with Logistex to deploy 165 Shelf-to-Person robots at Yusen Logistics’ 1.2 million square foot distribution center in the UK, supporting B2B and B2C warehouse automation.
- March 2026: Daifuku opened the Tokyo Lab, a new research and development hub focused on advanced automation technologies, robotics, and digital innovation for intralogistics.
Geopolitical Impact Analysis
According to the WTO, world merchandise trade volume growth stayed near 2.7% into 2024 as tariff friction reshaped sourcing. US tariffs on Chinese robotics components reached up to 25%, raising input costs for AMRs and sensors. This pressure lifts system prices for buyers. Consequently, vendors diversify sourcing toward Southeast Asia and Mexico to protect margins and delivery timelines.
As reported by UNCTAD, global shipping costs stayed volatile as Red Sea rerouting added roughly 10 to 14 days to some Asia-to-Europe transits in 2024. Data from the IEA shows energy price swings raised industrial operating costs through 2024. These delays strain component lead times for LIDAR and servo drives. Therefore integrators hold larger buffer stocks, which raises working capital needs across the supply chain.
Report Scope
| Report Features | Description |
|---|---|
| Market Value (2025) | USD 56.00 Billion |
| Forecast Revenue (2035) | USD 163.00 Billion |
| CAGR (2026-2035) | 11.3% |
| Base Year for Estimation | 2025 |
| Historic Period | 2020-2024 |
| Forecast Period | 2026-2035 |
| Report Coverage | Revenue Forecast, Market Dynamics, Market Opportunity Analysis, Technology and Innovation Landscape, Competitive Landscape, Recent Developments |
| Segments Covered | By Component (Hardware, Software, Services), By Automation Type (Warehouse Automation, Autonomous Mobile Robots (AMRs), Automated Storage & Retrieval Systems (AS/RS), Conveyor & Sortation Systems, Automated Guided Vehicles (AGVs), Robotic Picking & Palletizing Systems), By Organization Size (Large Enterprises, Small & Medium Enterprises (SMEs)), By Deployment Mode (On-Premise, Cloud-Based, Hybrid Deployment), By Application (Warehousing & Distribution, E-Commerce Fulfillment, Transportation Management, Inventory & Order Management, Freight & Parcel Sorting, Cold Chain Logistics), By End User (Retail & E-Commerce, Third-Party Logistics (3PL) Providers, Manufacturing, Healthcare & Pharmaceuticals, Food & Beverage, Automotive), By Technology (Barcode & RFID-Based Automation, AI & Machine Learning-Based Automation, Internet of Things (IoT), Computer Vision, Digital Twin & Predictive Analytics) |
| Regional Analysis | North America (US and Canada), Europe (Germany, France, The UK, Spain, Italy, and Rest of Europe), Asia Pacific (China, Japan, South Korea, India, Australia, and Rest of APAC), Latin America (Brazil, Mexico, and Rest of Latin America), Middle East and Africa (GCC, South Africa, and Rest of MEA) |
| Competitive Landscape | Daifuku Co., Ltd., Honeywell International Inc., Siemens AG, Dematic, Swisslog Holding AG, Knapp AG, Murata Machinery, Ltd., SSI Schäfer Group, TGW Logistics Group, Vanderlande Industries B.V., Toyota Industries Corporation, Jungheinrich AG, Beumer Group, Kion Group AG, Geekplus Technology Co., Ltd. |
| Customization Scope | Customization for segments, region / country-level will be provided. Additional customization can be done based on requirements. |
| Purchase Options | We have three licenses to opt for: Single User License | Multi-User License (Up to 5 Users) | Corporate Use License (Unlimited User and Printable PDF) |





































