


Report Overview
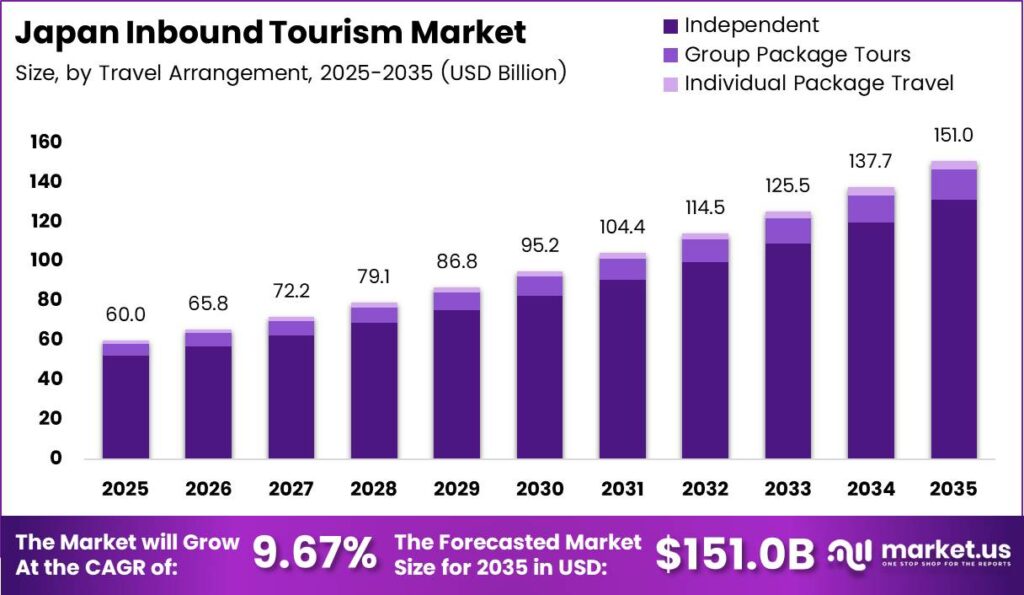
Japan Inbound Tourism Market size is expected to be worth around USD 151.0 Billion by 2035 from USD 60.0 Billion in 2025, growing at a CAGR of 9.67% during the forecast period 2026 to 2035. According to preliminary Japan National Tourism Organization figures, Japan recorded 42,683,600 international visitor arrivals in 2025, up 15.8% from 2024. This pace of arrival growth confirms active demand and provides a measurable baseline for revenue forecasting through the decade.
The Japan Inbound Tourism Market encompasses all spending by international visitors within Japan, structured across expenditure categories including accommodation, shopping, food and beverages, transportation, and entertainment. This market captures traveler flows segmented by source country, travel purpose, booking channel, visit frequency, and destination region within Japan. The structure reflects both gateway-concentrated volume and a geographically distributed spend base.
Key Takeaways
- The Japan Inbound Tourism Market is valued at USD 60.0 Billion in 2025 and is forecast to reach USD 151.0 Billion by 2035 at a CAGR of 9.67%.
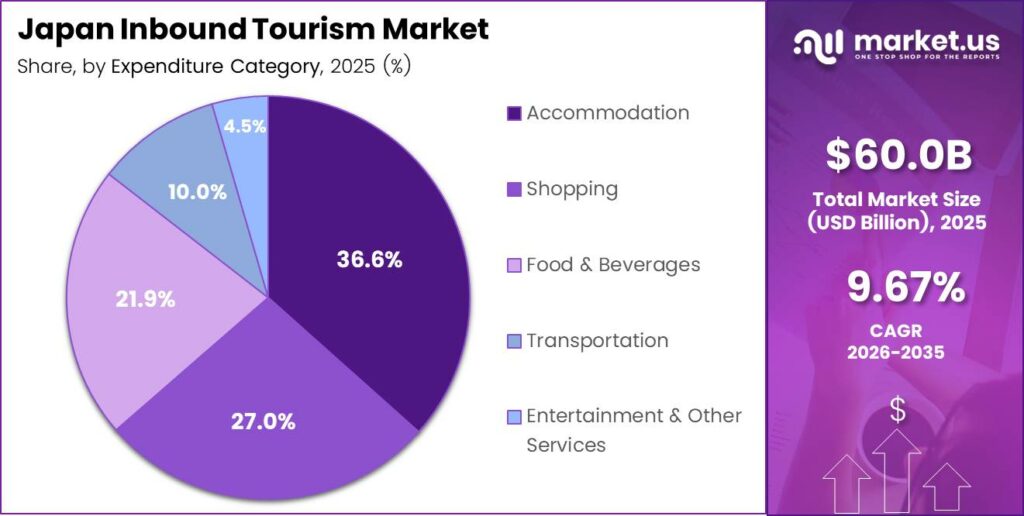
- By Expenditure Category, Accommodation dominates with a 36.6% share in 2025.
- By Visitor Source Country, China holds the dominant position with a 21.2% share.
- By Travel Arrangement, Independent Travel leads with an 86.5% share.
- Kanto leads the Japan inbound tourism market
- Asia Pacific source markets, including South Korea at 10.4%, Taiwan at 12.8%, and Hong Kong at 5.9%, collectively represent the largest visitor origin bloc.
- China is the dominant visitor source country with a 21.2% share.
- North America leads regional market contribution, with the United States accounting for 11.9% of visitor source share.
In August 2025, Nippon Travel Agency and Inbound Tech signed a business-alliance agreement to deploy AI multilingual translation, AI chatbots, CRM technology, and a multilingual contact center operating 24 hours a day, 365 days a year. This deployment targets the multilingual service gap at independent operators and secondary destinations, which the market’s challenge analysis identifies as a friction point carrying a 0.15 percentage point drag on forecast growth.
According to the Japan Tourism Agency’s second preliminary estimate published on September 30, 2026, international visitors’ travel expenditure in Japan reached JPY 2.5125 trillion during April to June 2026, up 0.3% year on year. As reported by the Japan Tourism Agency, average travel expenditure per international visitor, excluding cruise excursion visitors, reached approximately JPY 245,000 during the same period, up 3.4% year on year. Higher per-visitor spend, even against modest volume growth, signals that yield management and premium product conversion are becoming the primary revenue levers for operators in this market.
Expenditure Category Analysis
Accommodation dominates with 36.6% due to high lodging cost share per trip.
In 2025, Accommodation held a dominant market position in the By Expenditure Category segment of the Japan Inbound Tourism Market, with a 36.6% share. Lodging absorbs the largest single portion of visitor budgets because Japan’s hospitality options range from budget hostels to high-end ryokan, giving operators strong pricing leverage. This concentration signals that accommodation providers carry the most direct exposure to both demand growth and per-visitor yield expansion.
Shopping captured a 27.0% share of inbound tourism expenditure in 2025. International visitors allocate a significant portion of their budgets to retail purchases, driven by favorable exchange rates and Japan’s reputation for quality consumer goods. Retailers and duty-free operators in gateway cities benefit disproportionately from this segment, as shopping decisions concentrate around Kanto and Kansai destination clusters.
Food and Beverages accounted for 21.9% of expenditure in 2025. Japan’s cuisine reputation functions as a primary travel motivator for a measurable portion of inbound visitors, supporting strong spend per meal across casual and premium dining. In November 2025, JTB and JR Central launched the Mount Fuji and Shizuoka Wasabi Experience with Hokusai Special Train and Shinkansen tour, directly monetizing culinary and experience-led demand within this spending category. Operators that bundle dining into packaged itineraries capture a greater share of this category’s revenue per visitor.
Transportation represented 10.0% of expenditure and Entertainment and Other Services accounted for the remaining 4.5%, together holding the balance of category share. In July 2025, Walk Japan launched two tours: the five-day, four-night Onsen Gastronomy: Kiso in Nagano and the six-day, five-night Self-Guided Izu Wayfarer, both of which bundle transportation and experience spend into a single purchase. These lower-share categories offer operators structured upsell opportunities when packaged with accommodation or food spend.
Visitor Source Analysis
China dominates with 21.2% due to scale of outbound travel recovery post-pandemic.
In 2025, China held a dominant market position in the By Visitor Source Country segment of the Japan Inbound Tourism Market, with a 21.2% share. As reported by the Japan National Tourism Organization, Japan received 9,096,300 visitor arrivals from China in 2025, up 30.3% year on year. This recovery rate is the fastest among major source markets and signals that Chinese inbound revenue will increasingly define the ceiling for high-spend accommodation and shopping categories.
Taiwan accounted for a 12.8% share of visitor source composition in 2025. JNTO figures show Japan received 6,763,400 arrivals from Taiwan, up 11.9% year on year. Taiwan’s consistent growth and high repeat-visitor tendency make it a stable, predictable revenue contributor rather than a volatile recovery-driven market, which gives operators a reliable baseline for annual planning.
The United States held an 11.9% share of visitor source composition in 2025. Data from JNTO shows Japan received 3,306,800 arrivals from the United States, up 21.4% year on year. American visitors tend to carry higher per-trip budgets and longer average stays, which means this segment contributes a revenue weight above its arrival-count share and justifies dedicated English-language product investment.
South Korea held a 10.4% share in 2025. JNTO figures indicate Japan received 9,459,600 arrivals from South Korea, up 7.3% year on year, making it the largest source market by absolute arrival count. Hong Kong accounted for a 5.9% share, with 2,517,300 arrivals, down 6.2% year on year, while all remaining source countries and territories collectively held the residual share.
Travel Arrangement Analysis
Independent Travel dominates with 86.5% due to digital booking infrastructure and traveler autonomy preference.
In 2025, Independent and Individually Arranged Travel held a dominant market position in the By Travel Arrangement segment of the Japan Inbound Tourism Market, with an 86.5% share. The overwhelming preference for self-arranged itineraries reflects the maturity of online booking platforms and the depth of English and multilingual travel content available for Japan. This concentration shifts commercial leverage toward OTAs, direct booking channels, and digital-first accommodation operators rather than traditional package assemblers.
Group Package Tours captured a 10.1% share of the travel arrangement segment in 2025. This segment retains relevance primarily among first-time visitors and older traveler demographics who value structured itineraries, language support, and guaranteed logistics. Individual Package Travel and other arrangements held the remaining share collectively, representing a structurally small but commercially distinct customer base that operators serve through curated bundled products.
Key Market Segments
By Expenditure Category
- Accommodation
- Shopping
- Food & Beverages
- Transportation
- Entertainment & Other Services
By Visitor Source Country / Territory
- China
- Taiwan
- United States
- South Korea
- Hong Kong
- Other Countries / Territories
By Primary Travel Purpose
- Tourism / Leisure
- Business
- Visiting Friends & Relatives
- Other Purposes
By Travel Arrangement
- Independent / Individually Arranged Travel
- Group Package Tours
- Individual Package Travel
By Booking Channel
- Direct Bookings
- Online Travel Agencies
- Traditional Travel Agencies / Tour Operators
- Other Intermediaries
By Visit Frequency
- First-Time Visitors
- Repeat Visitors
By Destination Region Within Japan
- Hokkaido
- Tohoku
- Kanto
- Chubu
- Kansai
- Chugoku
- Shikoku
- Kyushu & Okinawa
Regional Analysis
Asia Pacific source markets drive the largest share of Japan’s inbound visitor volume, anchored by China’s 21.2% visitor source share and Taiwan’s 12.8% share. The concentration of short-haul travel from neighboring markets creates a structurally defensible demand base for Japan’s gateway cities and regional destinations. Operators positioned in Kanto and Kansai benefit most directly from this short-haul volume concentration. In July 2025, H.I.S. launched a Japanese traditional performing-arts and kabuki tour for international visitors, priced at JPY 60,000 per adult and limited to 15 participants per departure, targeting premium cultural spend within this high-volume regional segment.
North America represents the fastest-growing long-haul source region, with the United States contributing an 11.9% visitor source share and recording arrivals up 21.4% year on year in 2025. American visitors’ higher per-trip spend and longer average stays position this region as the leading driver of per-visitor yield growth rather than volume growth. Operators that invest in English-language product development and long-haul flight connectivity capture disproportionate revenue from this segment.
South Korea and Hong Kong together represent two contrasting signals within the wider Asia Pacific source base. South Korea’s 10.4% visitor source share and upward arrival trend confirm sustained short-haul demand, while Hong Kong’s 5.9% share and year-on-year arrival decline of 6.2% signal a structural softening in that feeder market. These divergent trajectories require destination operators to apply source-market-specific acquisition strategies rather than treating the Asia Pacific bloc as a uniform growth channel.
Market Dynamics
Market Opportunity Analysis - Underexploited destination regions and secondary source markets offer measurable entry points for operators and investors
The Destination Region Within Japan segment reveals a structural concentration risk. Kanto and Kansai absorb the majority of inbound visitor volume, while regions such as Hokkaido, Tohoku, Chugoku, and Shikoku remain underrepresented relative to Japan’s total destination capacity. Operators that develop regionally distributed itineraries reduce dependence on congested gateway corridors and capture visitors seeking differentiated experiences outside the primary city circuit.
Hong Kong’s arrival decline of 6.2% year on year in 2025 signals a feeder market softening that creates a gap other source markets have not yet filled in secondary destination regions. This gap is an acquisition opportunity for operators that redirect marketing investment toward the United States, which recorded 21.4% arrival growth and carries a higher per-trip spend profile. Secondary destinations accessible via Shinkansen from Tokyo or Osaka are well positioned to capture American visitor itinerary extension demand.
The Individual Package Travel sub-segment within Travel Arrangement holds a structurally small but commercially distinct position alongside the dominant 86.5% independent travel share. This sub-segment serves visitors who seek the autonomy of independent travel combined with pre-arranged logistics on select components such as rail passes, accommodation blocks, or cultural experience bookings. Operators that design modular package components rather than full-package tours capture this hybrid demand without competing directly against OTAs on price.
The By Visit Frequency segment, which distinguishes First-Time Visitors from Repeat Visitors, identifies a divergent revenue opportunity that segment-level aggregates obscure. Repeat visitors account for a measurable share of total inbound volume, particularly from Taiwan, South Korea, and Hong Kong, and they demonstrate higher willingness to spend on off-peak regional travel and premium niche experiences. Operators that build loyalty products and region-diversification itineraries specifically for confirmed repeat visitors improve yield per returning customer without relying on new-market acquisition costs.
Technology and Innovation Landscape - AI deployment and digital product development redefine service delivery and competitive positioning across Japan's inbound tourism market
In August 2025, Nippon Travel Agency and Inbound Tech signed a business-alliance agreement to deploy AI multilingual translation, AI chatbots, CRM technology, and a multilingual contact center operating 24 hours a day, 365 days a year. This deployment addresses the multilingual service fragmentation challenge identified as a -0.15 percentage point drag on the forecast baseline. Operators that integrate similar AI-assisted communication infrastructure reduce per-interaction labor cost while extending service availability across non-Japanese-speaking visitor segments.
JTB’s Travel Members digital membership reached 22.7 million in FY2025, an increase of 1 million members year on year. This membership scale creates a proprietary first-party data asset that enables personalized product recommendation, demand forecasting, and targeted upsell campaigns at a cost per engagement that independent operators cannot replicate through third-party channels. Operators with large direct membership bases carry a structural cost advantage in customer retention versus OTA-dependent distribution models.
Walk Japan’s February 2026 launch of the East Hokkaido Trek, covering approximately 90 kilometers of the 410-kilometer Hokkaido East Trail, reflects a product design approach that packages natural infrastructure as a curated guided experience. This approach monetizes Japan’s existing physical landscape without requiring capital-intensive facility construction. Operators that apply systematic route documentation and multilingual guide training to underdeveloped trail networks convert existing public assets into proprietary premium products at lower capital cost than resort or hospitality infrastructure.
JTB’s August 2025 agreement to acquire Northstar Travel Group, with its portfolio of 14 tourism-industry media brands, signals a strategic move to control distribution-adjacent content channels rather than rely solely on booking-platform presence. Ownership of trade media provides intelligence on competitor pricing, consumer sentiment, and emerging demand patterns before they surface in booking data. This content-integrated distribution model positions JTB to influence buyer decision-making earlier in the travel planning cycle than operators without proprietary editorial reach.
Drivers
A comparatively weak yen improves foreign visitors’ purchasing power across accommodation, dining, and experiences. IATA identifies currency-supported affordability as a contributor to Japan’s inbound expansion, alongside international travel growth of 47.1% in 2024 and 15.8% in 2025. This supports a shift from discount-led visitor acquisition toward room upgrades, longer experience itineraries, and bundled ancillary sales. The estimated contribution is +0.65 percentage points within the 9.67% baseline CAGR.
Chinese outbound travel recovery and short-haul Asian travel momentum together contribute an estimated +0.70 percentage points to the forecast baseline, concentrated in Tokyo, Osaka, Nagoya, and major gateway corridors. Existing eVISA access for eligible overseas-resident markets adds a further +0.20 percentage points by reducing pre-departure friction for incremental first-time visitors. Established repeat-visitor demand from Taiwan, Hong Kong, and South Korea provides a medium-term floor of +0.15 percentage points, anchoring volume stability as recovery-phase growth normalizes.
| Driver | (~) % Impact on CAGR Forecast | Geographic Relevance | Impact Timeline |
|---|---|---|---|
| Exchange-rate-supported destination affordability | +0.65% | Nationwide; dollar-linked source markets | Short term (≤ 2 years) |
| Chinese outbound travel recovery | +0.40% | China; Tokyo, Osaka, Nagoya | Short term (≤ 2 years) |
| Short-haul Asian travel momentum | +0.30% | South Korea, Southeast Asia; major gateways | Short term (≤ 2 years) |
| Existing tourism eVISA access | +0.20% | Eligible overseas residence markets | Short term (≤ 2 years) |
| Established repeat-visitor demand | +0.15% | Taiwan, Hong Kong, South Korea; nationwide | Medium term (2–4 years) |
Restraints
The Private Lodging Business Act limits accommodation under its notification-based residential-lodging framework to 180 nights annually, creating a legal sales ceiling even when additional bookings exist. Against a 365-night calendar, this ceiling permits approximately 49.3% maximum calendar utilization and removes 185 nights from potential annual inventory before any additional local restriction applies. This restriction forces operators to concentrate sales into higher-yield dates or pursue a different licensing route entirely. The estimated national forecast deduction is 0.35 percentage points.
Mandatory pre-departure visa approval for non-eVISA traveler segments adds a friction cost of -0.20 percentage points to the forecast baseline, reducing spontaneous conversion from travel intent to booked arrivals. Municipal residential-lodging operating prohibitions in ordinance-restricted districts add a further -0.15 percentage points, while seasonal mountain-access closures and property eligibility exclusions contribute -0.08 and -0.07 percentage points respectively. Statutory night limits, municipal prohibitions, and eligibility exclusions combine for a total restraint allowance of 0.85 percentage points within the supplied baseline.
| Restraint | (~) % Impact on CAGR Forecast | Geographic Relevance | Impact Timeline |
|---|---|---|---|
| Private-lodging statutory operating ceiling | -0.35% | Nationwide; registered residential lodging | Medium term (2–4 years) |
| Mandatory pre-departure visa approval | -0.20% | Visa-required, non-eVISA traveler segments | Short term (≤ 2 years) |
| Municipal residential-lodging operating prohibitions | -0.15% | Ordinance-restricted residential districts | Medium term (2–4 years) |
| Seasonal mountain-access closures | -0.08% | Mount Fuji; climbing-dependent itineraries | Short term (≤ 2 years) |
| Residential-lodging property eligibility exclusions | -0.07% | Nonqualifying residential conversion properties | Medium term (2–4 years) |
Challenges
Japan’s 2026 Tourism White Paper identifies workforce development, productivity improvement, and operational resilience investment as central industry priorities. Among accommodation establishments surveyed, 72.2% reported labor shortages, with 79.3% of affected respondents noting heavier employee workloads at peak periods and 50.4% reporting additional recruitment time or expense. A further 21.5% had abandoned desired business expansion. These figures reflect survey respondents across 522 establishments, not a full census of all accommodation providers.
The workforce productivity gap carries an estimated friction drag of 0.45 percentage points against unconstrained growth potential. Peak corridor visitor congestion in Tokyo, Kyoto, and Osaka adds -0.20 percentage points, while multilingual service delivery fragmentation at independent operators contributes -0.15 percentage points. Extreme weather itinerary disruption and fragmented supplier booking integration add -0.12 and -0.08 percentage points respectively, bringing the full challenge allowance to 1.00 percentage point embedded in the supplied 9.67% baseline.
| Challenge | (~) % CAGR Friction Drag | Geographic Relevance | Mitigation Horizon |
|---|---|---|---|
| Hospitality Workforce Productivity Gap | -0.45% | Nationwide; hotels, ryokan, restaurants | Medium term (2–4 years) |
| Peak Corridor Visitor Congestion | -0.20% | Tokyo, Kyoto, Osaka; landmark districts | Medium term (2–4 years) |
| Multilingual Service Delivery Fragmentation | -0.15% | Independent operators; secondary destinations | Medium term (2–4 years) |
| Extreme Weather Itinerary Disruption | -0.12% | Coastal, mountain, and outdoor destinations | Long term (≥ 4 years) |
| Fragmented Supplier Booking Integration | -0.08% | Small accommodation and experience providers | Medium term (2–4 years) |
Opportunities
Japan Tourism Agency’s final accommodation statistics show average room occupancy of 38.2% for ryokan in 2025, compared with 75.3% for business hotels and 74.1% for city hotels. This occupancy gap is a screening opportunity for selective asset repositioning rather than proof that every inn carries recoverable demand. Raising a selected property’s occupancy from 38.2% to 43.2% would increase occupied room-nights by approximately 13.1% at unchanged inventory, reducing fixed cost per occupied room-night by approximately 11.6%. The estimated market-level upside from this repositioning is +0.40 percentage points.
Clinically governed wellness packages in onsen regions offer a conditional +0.25 percentage point uplift, while accessible multigenerational premium itineraries and international corporate retreat packages contribute +0.20 and +0.15 percentage points respectively. Licensed cultural intellectual-property experiences in creative and animation districts provide a long-term upside of +0.10 percentage points. All opportunity estimates combined provide a conditional 1.10 percentage point uplift, taking the supplied baseline from 9.67% to 10.77% under successful execution.
| Opportunity | (~) % Potential CAGR Upside | Geographic Relevance | Execution Window |
|---|---|---|---|
| Underutilized ryokan asset repositioning | +0.40% | Onsen towns; secondary leisure destinations | Medium term (2–4 years) |
| Clinically governed wellness packages | +0.25% | Onsen regions; established medical-service hubs | Medium term (2–4 years) |
| Accessible multigenerational premium itineraries | +0.20% | Nationwide; barrier-free destination clusters | Medium term (2–4 years) |
| International corporate retreat packages | +0.15% | Resort destinations; regional conference locations | Medium term (2–4 years) |
| Licensed cultural intellectual-property experiences | +0.10% | Creative districts; film and animation locations | Long term (≥ 4 years) |
Key Company Insights
JTB Corp. reported consolidated group sales of JPY 1.1333 trillion for FY2025, up 6% year on year, with ordinary income of JPY 17.3 billion, up 4%. The group employed 20,029 people as of March 31, 2026, and its Travel Members membership reached 22.7 million. In March 2026, JTB Global Marketing and Travel announced enhanced service standards for BOUTIQUE JTB, effective April 1, 2026, following the establishment of a dedicated BOUTIQUE JTB Sales Department in February 2026.
H.I.S. Co., Ltd. operates as a direct competitor to traditional package tour operators by targeting experiential, niche-segment international visitors. Its July 2025 kabuki tour launch, priced at JPY 60,000 per adult and limited to 15 participants per departure, reflects a deliberate move toward small-group, high-yield product formats. This positioning limits absolute volume but protects margin in a market where workforce constraints suppress the profitability of high-throughput, lower-yield tour models.
Key Players
- JTB Corp.
- H.I.S. Co., Ltd.
- Kinki Nippon Tourist Blue Planet Co., Ltd.
- Tobu Top Tours Co., Ltd.
- Nippon Travel Agency Co., Ltd.
- Hankyu Travel International Co., Ltd.
- JALPAK Co., Ltd.
- Inside Travel Group Ltd. / InsideJapan Tours
- Walk Japan
- Japan Experience
- Arigato Travel
Recent Developments
- August 2025 – JTB agreed to acquire Northstar Travel Group and operate it as an independent wholly owned subsidiary, equivalent to 100% ownership; Northstar’s portfolio included 14 tourism-industry media brands, while existing management and editorial neutrality were retained.
- February 2026 – Walk Japan launched the nine-day, eight-night East Hokkaido Trek, covering approximately 90 kilometers of the 410-kilometer Hokkaido East Trail, with groups limited to 12 participants and prices starting at JPY 868,000 per person.
- December 2025 – Marietton Développement signed an agreement to acquire 100% of Japan Experience, whose operations included approximately 150 guides; the agreement was signed on December 23, 2025.
- October 2025 – Walk Japan introduced the Saga and Nagasaki: Cultural Crossroads tour, a ten-day, nine-night guided itinerary from Fukuoka to Kumamoto for up to 12 participants, priced from JPY 670,000 per person.
- October 2025 – Nippon Travel Agency, JR West, and the Kitakyushu Sushi Council launched the Authentic Sushi Experience at Sushi “Kingdom” Kitakyushu across 11 restaurants, with packages priced at JPY 13,000 and JPY 25,000.
Report Scope
| Report Features | Description |
|---|---|
| Market Value (2025) | USD 60.0 Billion |
| Forecast Revenue (2035) | USD 151.0 Billion |
| CAGR (2026-2035) | 9.67% |
| Base Year for Estimation | 2025 |
| Historic Period | 2020-2024 |
| Forecast Period | 2026-2035 |
| Report Coverage | Revenue Forecast, Market Dynamics, Market Opportunity Analysis, Technology and Innovation Landscape, Competitive Landscape, Recent Developments |
| Segments Covered | By Expenditure Category (Accommodation, Shopping, Food & Beverages, Transportation, Entertainment & Other Services), By Visitor Source Country / Territory (China, Taiwan, United States, South Korea, Hong Kong, Other Countries / Territories), By Primary Travel Purpose (Tourism / Leisure, Business, Visiting Friends & Relatives, Other Purposes), By Travel Arrangement (Independent / Individually Arranged Travel, Group Package Tours, Individual Package Travel), By Booking Channel (Direct Bookings, Online Travel Agencies, Traditional Travel Agencies / Tour Operators, Other Intermediaries), By Visit Frequency (First-Time Visitors, Repeat Visitors), By Destination Region Within Japan (Hokkaido, Tohoku, Kanto, Chubu, Kansai, Chugoku, Shikoku, Kyushu & Okinawa) |
| Regional Analysis | North America (US and Canada), Europe (Germany, France, The UK, Spain, Italy, and Rest of Europe), Asia Pacific (China, Japan, South Korea, India, Australia, and Rest of APAC), Latin America (Brazil, Mexico, and Rest of Latin America), Middle East and Africa (GCC, South Africa, and Rest of MEA) |
| Competitive Landscape | JTB Corp., H.I.S. Co., Ltd., Kinki Nippon Tourist Blue Planet Co., Ltd., Tobu Top Tours Co., Ltd., Nippon Travel Agency Co., Ltd., Hankyu Travel International Co., Ltd., JALPAK Co., Ltd., Inside Travel Group Ltd. / InsideJapan Tours, Walk Japan, Japan Experience, Arigato Travel |
| Customization Scope | Customization for segments, region/country-level will be provided. Additional customization can be done based on requirements. |
| Purchase Options | We have three licenses to opt for: Single User License, Multi-User License (Up to 5 Users), Corporate Use License (Unlimited User and Printable PDF) |





































