


Key Findings
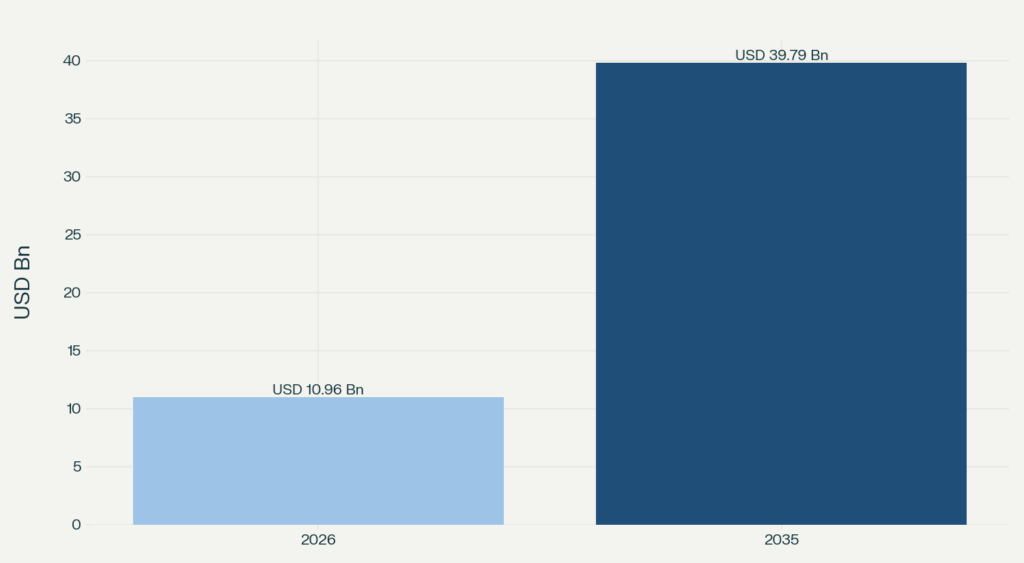
- The Japan In-App Advertising market is worth USD 10.96 Billion in 2026 and is expected to reach USD 39.79 Billion by 2035, a CAGR of 15.4%.
- Video Ads lead the Advertising Type segment with a 35.2% share in 2026.
- iOS leads the Platform segment with a 62.0% share in 2026 (estimate).
- Messaging & Social leads the Application segment with a 30.5% share in 2026 (estimate).
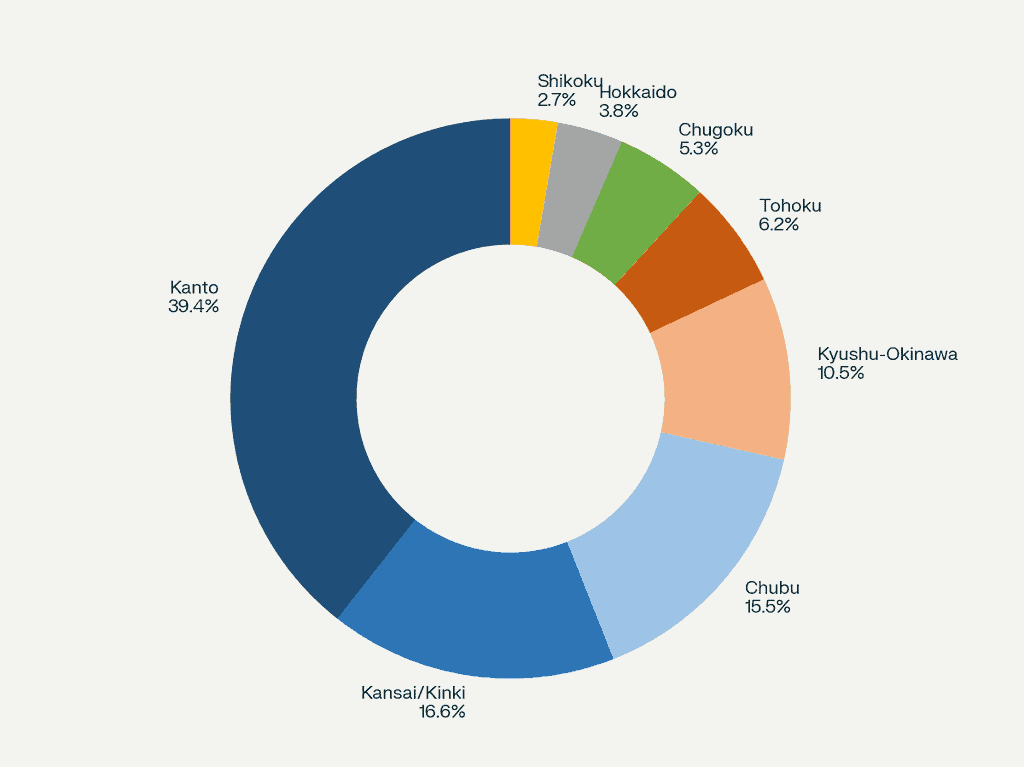
- Kanto Region leads the regional market with a 39.4% share in 2026.
- Online Shopping is the fastest-growing application (estimated CAGR of 18.5%). Kyushu-Okinawa is the fastest-growing region (estimated CAGR of 16.8%).
Market Overview
The Japan In-App Advertising Market is estimated at USD 10.96 Billion in 2026. It is projected to reach USD 39.79 Billion by 2035, a CAGR (compound annual growth rate) of 15.4% over the forecast period.
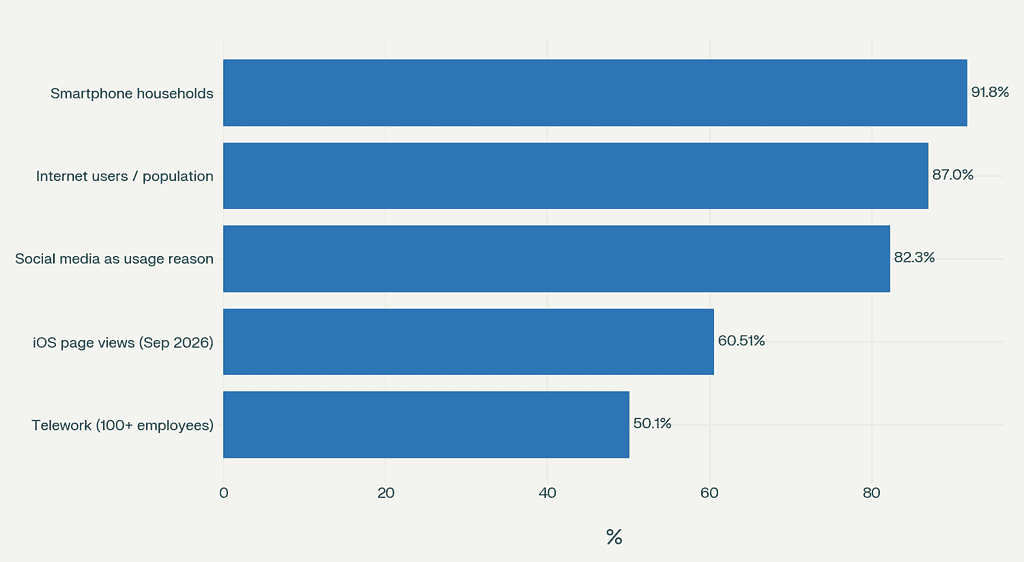
Japan’s Ministry of Internal Affairs and Communications (MIC) found that 91.8% of households owned a smartphone at the end of August 2025. DataReportal counted 193 million active cellular connections in late 2025, equal to 157% of the population. This means nearly every adult in Japan can be reached on mobile. Advertisers are buying access to an audience that is already connected.
Dentsu reports that Japan’s total advertising spend reached a record ¥8,062.3 billion in 2025, up 5.1% from the year before. Internet advertising made up 50.2% of the total, crossing the halfway mark for the first time. Japan Digital Advertising spending is now larger than all traditional media (TV, newspapers, magazines and radio) combined. Advertisers are moving their whole media mix toward mobile, not just shifting small amounts.
Market Definition
This market covers paid ads shown inside mobile apps. Formats include video, banner, interstitial (full-screen ads shown at natural breaks) and rich media (interactive ads). The ads run in games, social and messaging, entertainment, shopping, and payments and ticketing apps. The market excludes ads on mobile websites, desktop programmatic buys (automated ad buying) and digital out-of-home screens.
Key Market Statistics
| Metric | Value |
|---|---|
| Market size, 2026 | USD 10.96 Bn (¥1,737.5 Bn at 158.53 JPY/USD) |
| Market size, 2035 | USD 39.79 Bn (¥6,307.9 Bn at a constant rate) |
| CAGR, 2026-2035 | 15.4% (USD and constant-currency yen) |
| Leading ad type, 2026 | Video Ads, 35.2% |
| Leading platform, 2026 | iOS, 62.0% (estimate) |
| Leading application, 2026 | Messaging & Social, 30.5% (estimate) |
| Leading region, 2026 | Kanto, 39.4% |
| Fastest-growing application | Online Shopping, 18.5% CAGR (estimate) |
Advertising Type Analysis
Video Ads led the Advertising Type segment with a 35.2% share in 2026.
Video leads because Japanese advertisers pay more for formats that hold attention. A joint analysis by CARTA HOLDINGS, Dentsu, Dentsu Digital and Septeni found video advertising reached ¥1,027.5 billion in 2025, up 21.8%. That was the fastest growth of any internet ad category. Advertisers like video because they can measure view-through results, meaning sales or actions from people who watched but did not click.
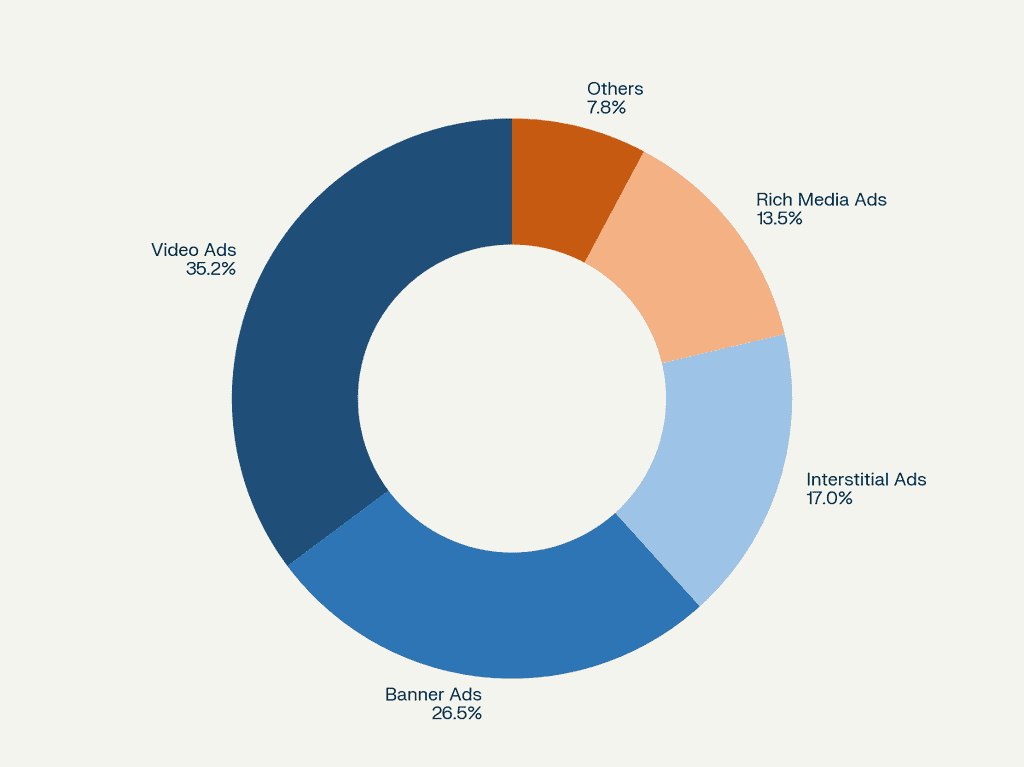
In-stream video (played inside video content) was ¥524.6 billion, or 51.1% of video spend. Out-stream video (shown in feeds and articles) was ¥502.9 billion, or 48.9%. Banner Ads remain useful for retargeting (showing ads to past visitors) and for low-cost reach. Interstitial Ads work well in games at natural break points. Rich Media Ads suit consumer brands that want interactive stories without the cost of making a video. Video Ads are also the fastest-growing format (estimated CAGR of 17.0%), driven by rewarded ads in games, where users choose to watch in exchange for an in-game reward.
Platform Analysis
iOS captured an estimated 62.0% of the Platform segment in 2026.
Japan is one of the few large markets where Apple leads. StatCounter shows iOS with 62.0% of mobile page views in September 2026. Advertisers in finance, travel and premium retail value iOS users for their higher spending. LINE had 99.0 million monthly active users in late 2025, so a single messaging app reaches most of the country on both platforms.
The iOS lead comes with a measurement cost. Across the industry, 35% of users shown Apple’s ATT prompt agreed to tracking in Q2 2025, barely up from 34% in Q2 2023. About two-thirds of iOS users therefore stay untrackable across apps. This is pushing iOS budgets toward contextual, first-party and SKAdNetwork-based measurement, and away from user-level targeting.
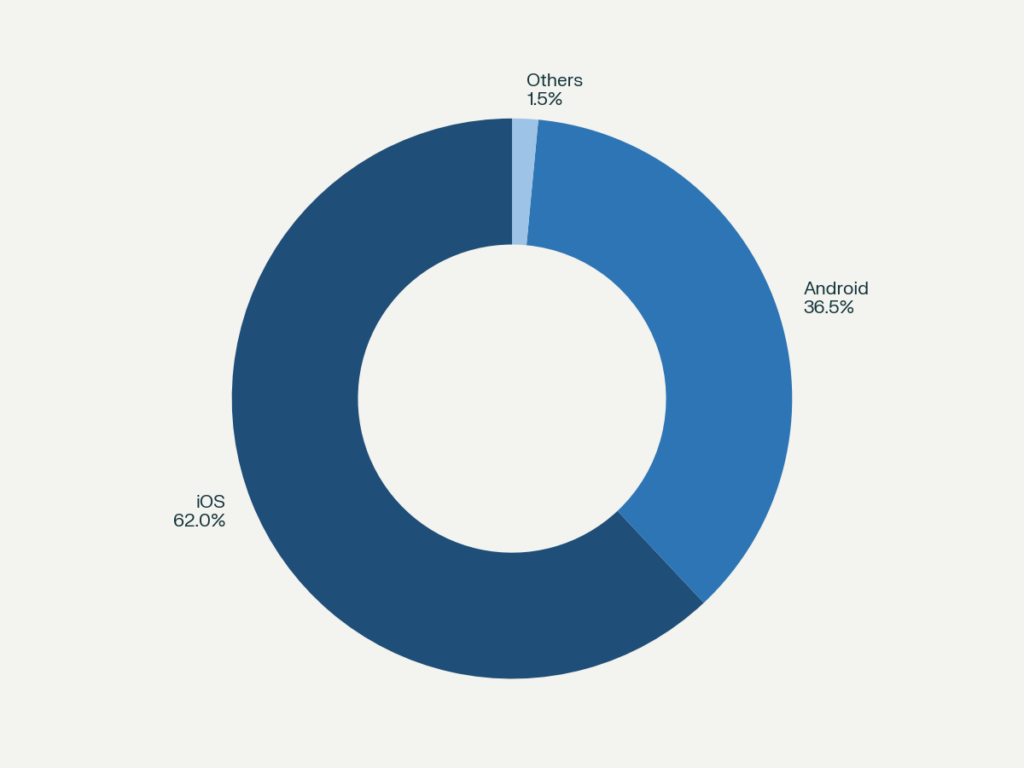
Android holds an estimated 36.5% share and is growing faster (estimated CAGR of 16.4%). Growth comes from low-cost and SIM-only plans (mobile plans bought without a phone), which bring more first-time buyers onto Android phones. YouTube’s ad reach was 78.5 million users in late 2025. Instagram reached 63.2 million, after adding 6.2 million users (+10.9%) in a year. These cross-platform apps help Android inventory command better prices.
“iOS holds 62.0% of in-app spend in 2026 against 36.5% for Android, a 25.5-point gap. By 2035, our model narrows this gap to 20.0 points (59.4% vs 39.4%). Android-first ad networks gain share, but iOS stays the larger budget pool.”
Research Team, Market.us
Application Analysis
With an estimated 30.5% share in 2026, Messaging & Social is the largest Application category.
Social advertising in Japan grew 18.7% to ¥1,306.7 billion in 2025. It now makes up 39.5% of all internet ad media spend. Of that, SNS (social networking) took ¥550.8 billion and video-sharing platforms ¥512.6 billion. Most of this spend runs inside the LINE, X, Instagram and TikTok apps.
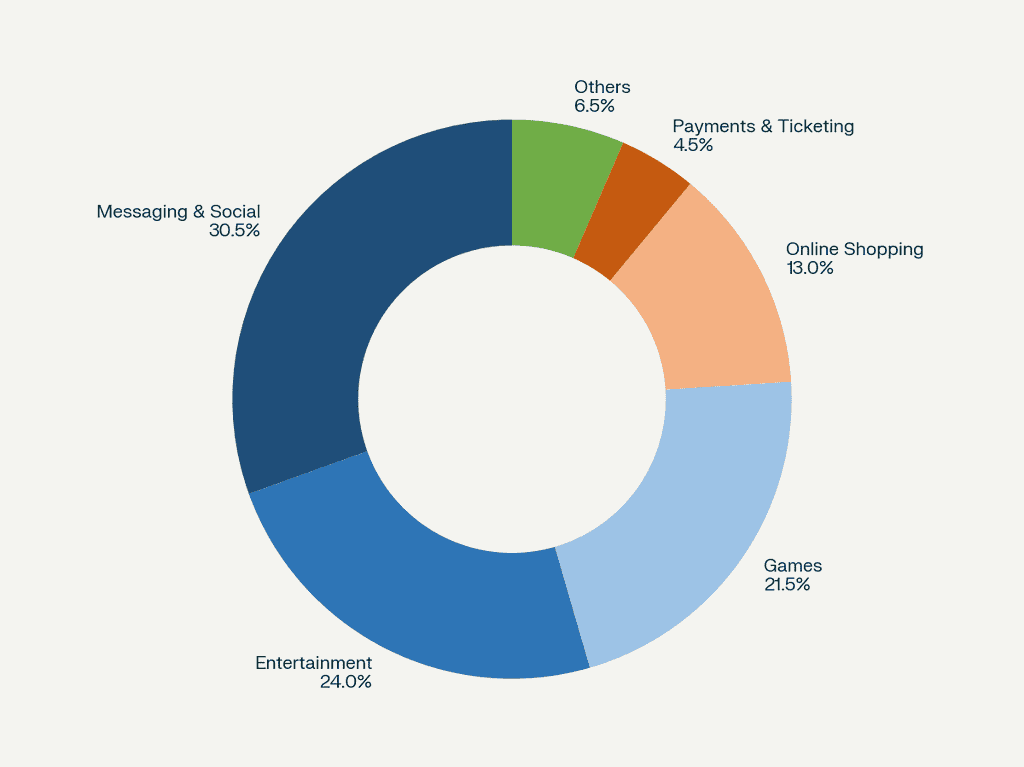
Entertainment, which includes video-sharing and streaming apps, holds an estimated 24.0%. Games hold an estimated 21.5% share (USD 2.36 Bn in 2026). Japan is one of the world’s most valuable mobile game markets, with about USD 11 billion in in-app purchase revenue in 2025. The market is maturing: Sensor Tower reports 2026 revenue of ¥1.56 trillion, down 5.1%, and downloads down 5.4% to 585 million . As purchase income slows, publishers rely more on rewarded video and interstitial ads. Gaming apps still charge high CPMs because players stay engaged for long sessions.
Gaming apps still charge high CPMs (cost per thousand impressions) because players stay engaged for long sessions. Online Shopping is the fastest-growing category, at an estimated CAGR of 18.5%, as marketplaces sell ad space alongside products. Payments & Ticketing apps (estimated 4.5%) let brands advertise at the moment people are ready to buy.
“Online Shopping rises from 13.0% of the market in 2026 to 16.5% in 2035, a gain of 3.5 points. Messaging & Social slips from 30.5% to 27.6%. Spend is moving toward apps where people buy, not just where they talk.”
Research Team, Market.us
Key Market Segments
By Advertising Type
- Video Ads
- Banner Ads
- Interstitial Ads
- Rich Media Ads
- Others
By Platform
- iOS
- Android
- Others
By Application
- Messaging & Social
- Entertainment
- Games
- Online Shopping
- Payments & Ticketing
- Others
Segment Share Table (all values estimates except Video Ads and Kanto shares)
| Segment | 2026 Share |
|---|---|
| Video Ads | 35.2% | USD 3.87 Bn (2026) | USD 15.85 Bn (2035) | CAGR 17.0% |
| Banner Ads | 26.5% | USD 2.90 Bn (2026) | USD 8.97 Bn (2035) | CAGR 13.3% |
| Interstitial Ads | 17.0% | USD 1.86 Bn (2026) | USD 6.55 Bn (2035) | CAGR 15.0% |
| Rich Media Ads | 13.5% | USD 1.48 Bn (2026) | USD 5.85 Bn (2035) | CAGR 16.5% |
| Others (type) | 7.8% | USD 0.85 Bn (2026) | USD 2.57 Bn (2035) | CAGR 13.0% |
| iOS | 62.0% | USD 6.80 Bn (2026) | USD 23.64 Bn (2035) | CAGR 14.9% |
| Android | 36.5% | USD 4.00 Bn (2026) | USD 15.69 Bn (2035) | CAGR 16.4% |
| Others (platform) | 1.5% | USD 0.16 Bn (2026) | USD 0.46 Bn (2035) | CAGR 12.0% |
| Messaging & Social | 30.5% | USD 3.35 Bn (2026) | USD 11.00 Bn (2035) | CAGR 14.2% |
| Entertainment | 24.0% | USD 2.63 Bn (2026) | USD 10.40 Bn (2035) | CAGR 16.5% |
| Games | 21.5% | USD 2.36 Bn (2026) | USD 7.66 Bn (2035) | CAGR 14.0% |
| Online Shopping | 13.0% | USD 1.42 Bn (2026) | USD 6.56 Bn (2035) | CAGR 18.5% |
| Payments & Ticketing | 4.5% | USD 0.49 Bn (2026) | USD 2.19 Bn (2035) | CAGR 18.0% |
| Others (application) | 6.5% | USD 0.71 Bn (2026) | USD 1.98 Bn (2035) | CAGR 12.0% |
Each segment adds up to USD 10.96 Bn in 2026 and USD 39.79 Bn in 2035.
Regional Analysis
| Region | Details |
|---|---|
| Kanto | 39.4% | USD 4.31 Bn (2026) | USD 15.06 Bn (2035) | CAGR 14.9% |
| Kansai/Kinki | 16.6% | USD 1.82 Bn (2026) | USD 7.03 Bn (2035) | CAGR 16.2% |
| Chubu | 15.5% | USD 1.70 Bn (2026) | USD 6.26 Bn (2035) | CAGR 15.6% |
| Kyushu-Okinawa | 10.5% | USD 1.15 Bn (2026) | USD 4.66 Bn (2035) | CAGR 16.8% |
| Tohoku | 6.2% | USD 0.68 Bn (2026) | USD 2.32 Bn (2035) | CAGR 14.6% |
| Chugoku | 5.3% | USD 0.58 Bn (2026) | USD 2.01 Bn (2035) | CAGR 14.8% |
| Hokkaido | 3.8% | USD 0.42 Bn (2026) | USD 1.49 Bn (2035) | CAGR 15.2% |
| Shikoku | 2.7% | USD 0.30 Bn (2026) | USD 0.96 Bn (2035) | CAGR 14.0% |
| Total | 100.0% | USD 10.96 Bn (2026) | USD 39.79 Bn (2035) | CAGR 15.4% |
Shares outside Kanto are estimates. They split the remaining 60.6% by each region’s share of Japan’s population.
Kanto Region
Kanto led with a 39.4% share in 2026 (USD 4.31 Bn). The region has about 43.3 million people. The Kanto Bureau of METI says the area it covers produces about 46% of Japan’s GDP. Tokyo alone produced 20.2% of national GDP in 2022. The largest agencies, platform headquarters and corporate advertisers are based in Tokyo, so Kanto sets the benchmark prices and formats for national campaigns. Its share is roughly 4 points above its population share, which reflects higher spend per user, not just more users.kanto.meti+2
Kansai/Kinki Region
Kansai holds an estimated 16.6% share (USD 1.82 Bn in 2026) and grows at a 16.2% CAGR. It has about 22.5 million people. Osaka produced 7.2% of national GDP in 2022 and Hyogo 3.9%. Osaka and Kyoto are among the five prefectures that took 69.7% of all foreign overnight stays in 2025. This gives travel, retail and ticketing apps a steady base of advertisers. More small and mid-sized businesses now buy performance ads directly, without an agency.wikipedia+2
Chubu Region
Chubu holds an estimated 15.5% share (USD 1.70 Bn in 2026) and grows at a 15.6% CAGR. It has about 21.4 million people. Aichi produced 7.2% of national GDP in 2022, the same as Osaka. This reflects the car and manufacturing cluster around Nagoya. Brands selling car accessories, financial services and tools buy intent-based ads, and direct-response formats suit the region’s older consumers.wikipedia+1
Kyushu-Okinawa Region
This is the fastest-growing region, at an estimated 16.8% CAGR (USD 1.15 Bn in 2026 to USD 4.66 Bn in 2035). It has about 14.3 million people. Japan had a record 42.7 million foreign visitors in 2025, up 15.8%. Okinawa is one of the five most-visited prefectures for overnight stays. Taiwanese visitors to Okinawa now stay longer, at 4.7 days on average, up from 3.3. Fukuoka has become a hub for short trips from South Korea. Travel, hotel and retail advertisers are increasingly buying programmatic in-app ads to reach these visitors.wikipedia+3
Hokkaido Region
Hokkaido holds an estimated 3.8% share (USD 0.42 Bn in 2026) and grows at a 15.2% CAGR. In February 2025 it ranked third nationally with 1.74 million foreign guest nights, up more than 55% year on year. Tourism and food brands spend most in the winter (ski) and summer seasons, when local and national advertisers compete and ad prices rise. Travel booking and payments apps are the main places this spend runs.
Tohoku, Chugoku and Shikoku
These three regions together hold an estimated 14.2% share (USD 1.56 Bn in 2026), with CAGRs of 14.0–14.8%. Their populations are smaller and older, so total spend stays limited, but ad prices below the national average make them cheap test markets. In Tohoku, buyers are mainly agriculture, home-improvement and local retail brands. Chugoku’s spend centres on Hiroshima retail chains, regional banks and local government campaigns. Shikoku relies on regional banks, healthcare and agriculture-related retail.
“At USD 10.96 Billion across 107 million internet users, Japan’s in-app market works out to about USD 102 (roughly ¥16,240) per user in 2026. Kanto’s 39.4% share is about 4 points above its share of population. Regions outside Kanto offer cheaper reach for the same user.”
Research Team, Market.us
Macroeconomic Impact
Rising digital spending and company digitization support mobile ad growth. MIC reports that 50.1% of Japanese companies with 100 or more permanent employees had introduced telework by the end of August 2025. Remote work adds daily screen time and gives in-app ads more hours to reach working-age users.
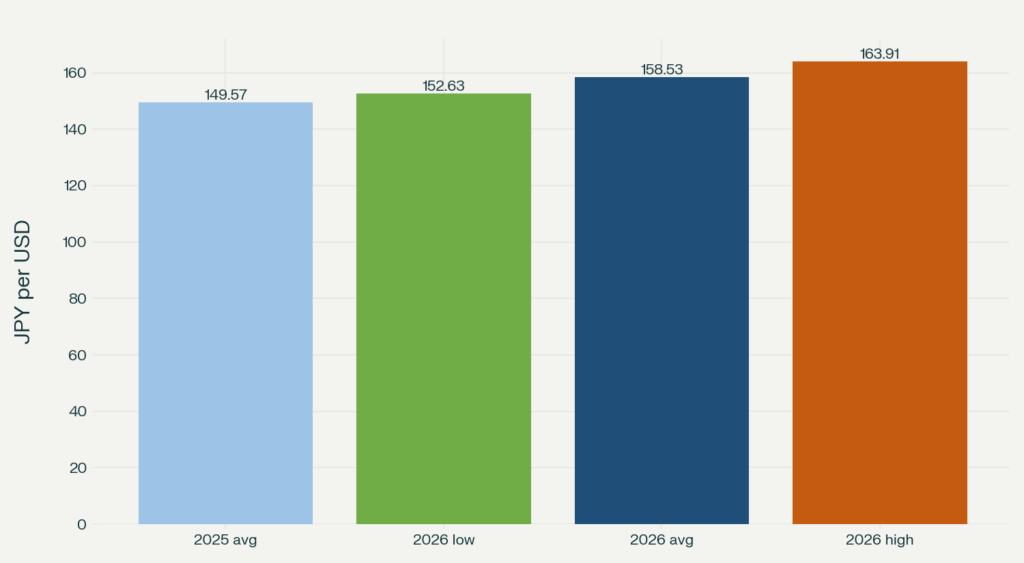
Dentsu data shows promotional media spend (outdoor, transit, flyers and events) was ¥1,718.4 billion in 2025, up 2.0%. Offline activity is still growing, but much more slowly than digital. The yen has not been stable. USD/JPY averaged 149.57 in 2025, and the 2026 average so far is 158.53, with a range of 152.63 to 163.91. A weak yen makes global ad platforms priced in dollars more expensive for Japanese buyers, and it lowers the USD value of yen-based spend.
Market Dynamics
Driver: Mobile-First Economy and Faster Networks Expanding Inventory
In MIC’s 2025 Communications Usage Trend Survey, social media was the most common reason for using the internet, at 82.3%. Japan had 107 million internet users at the end of 2025, or 87.0% of the population. Internet ad spend rose 10.8% to ¥4,045.9 billion in 2025, according to Dentsu. Users, usage habits and budgets are all in place for in-app ad growth.
The median mobile download speed reached 60.37 Mbps in late 2025, up 27.3% in a year (Ookla, via DataReportal). Japan Programmatic Advertising buyers benefit because faster networks support rewarded video, playable ads and AR (augmented reality) formats, which earn higher CPMs. Better speeds reduce the loading delays that once held back rich media ads.
Restraint: Privacy Rules and Ad Fraud Limiting Measurement
Apple’s App Tracking Transparency (ATT) asks users for permission before apps can track them across other apps. Together with Japan’s Act on the Protection of Personal Information (APPI), it limits the data advertisers use for targeting and for attribution (linking a sale back to an ad). Dentsu shows traditional media spend fell 1.6% to ¥2,298.0 billion in 2025. Budgets are moving to digital just as measurement is getting harder.
Ad fraud, such as SDK spoofing (faking app installs) and click injection (stealing credit for installs), inflates reported results. Ad fatigue shows up as lower click-through rates on banners. Both push advertisers toward opt-in formats like rewarded video. This shrinks the supply of available ad space and raises prices for mid-sized advertisers.
Opportunity: Retail Media and Privacy-First Targeting
Ad spend on e-commerce marketplace platforms in Japan reached ¥244.4 billion in 2025, up 12.5% (Dentsu). Marketplace, delivery and loyalty apps hold first-party purchase data, meaning data they collect directly from their own customers. This avoids most of the consent and attribution problems facing third-party ad networks. Retailers that open their apps to brand advertisers turn transaction data into high-margin media revenue.
Contextual targeting matches ads to the content a user is viewing without tracking the individual. Clean rooms are secure data spaces that let two companies compare data without sharing raw user records. Foreign brands entering Japan need local creative, cultural adaptation and media buying, which opens a gap for specialist service providers.
Porter’s Five Forces
- Competitive rivalry (high): Google, Meta and Apple compete with Dentsu, CyberAgent and LY Corporation for the same budgets and app inventory. Agency results show how intense this is: Dentsu’s Japan business grew 6.2% organically in FY2025, while Hakuhodo DY’s revenue fell 9.7%.
- Threat of new entrants (moderate): Japan’s median fixed download speed of 214.90 Mbps lowers technical barriers for cloud-based ad-tech firms. Business barriers stay high because advertiser relationships run through agencies and take years to build.
- Supplier power (high): LINE reaches 99.0 million monthly users and YouTube 78.5 million. Advertisers can’t easily replace this ad space when they need to reach more than 50 million users.
- Buyer power (rising): Performance-based ads make up 88.7% of internet ad media spend, which lets buyers pay only for results. Large advertisers still buy mainly through agency holding groups.
- Threat of substitutes (moderate): Connected TV, search and web placements limit how far in-app prices can rise. TV-linked video ads grew 23.3% to ¥80.5 billion in 2025 and compete for the same video budgets.
AI and Gen AI Impact
AI-driven programmatic buying is replacing broad demographic targeting. Real-time bidding systems use context, in-session behaviour and predicted customer value to price each impression in milliseconds. Because only about 35% of iOS users allow tracking, AI models that predict results without user-level data are now a core buying tool rather than an add-on. Agencies with their own clean-room data can lower cost per acquisition compared with peers that still build audiences by hand.
Generative AI cuts the cost and time needed to produce Japanese-language ads. This lowers a key entry barrier for foreign brands. Dynamic creative optimization (automatically building ad variants) can serve thousands of versions without a matching rise in production cost. This fits the market’s cost structure: internet ad production costs grew only 4.0% in 2025, against 11.8% for media costs. Firms that keep manual creative workflows will face a growing cost disadvantage.
Market Trends
Trend 1: Short video and rewarded formats replacing static ads. TikTok’s ad tools reached 39.2 million adults in Japan in late 2025, up 13.1 million (+49.9%) in a year. Short vertical video is now a mainstream buy. Video ads linked to TV media reached ¥80.5 billion in 2025, up 23.3% (Dentsu). Video budgets now span TV, streaming and in-app screens.
Trend 2: Performance-based buying. Performance-based ads, which are paid by results such as clicks or installs, reached ¥2,935.2 billion in 2025. That is 88.7% of internet ad media spend. Contracts tied to installs, purchases or lifetime value are replacing CPM-only deals.
Trend 3: AI-generated creative at scale. Agencies and ad networks are adopting generative tools to produce and test many ad versions at once. Production costs (¥492.2 billion, up 4.0%) are growing far more slowly than media costs (¥3,309.3 billion, up 11.8%). This shows that scale in creative production is getting cheaper while premium ad space gets more expensive.
Market Competition Overview
The top of Japan’s in-app market is moderately consolidated. A few large players control most premium social, messaging and gaming ad space. Many specialist networks compete for the rest. Platform reach varies widely: X reached 71.2 million users in Japan in late 2025, while Facebook reached 16.5 million. Advertisers must therefore buy across several platforms. Mobile Advertising and Digital Advertising buyers rely on domestic agencies for publisher relationships and Japanese creative.
Commerce platforms are building ad products on their own transaction data. Rivals without this data compete on DSP (demand-side platform, the software advertisers use to buy ads) technology and reach, both of which are becoming commodities. Share gains will go to players that combine measurable results with consent-based targeting.
Competitive Benchmarking
| Company | Details |
|---|---|
| Dentsu Group Inc. | Agency and media buying | FY2026 Japan organic growth guidance of 2–3% |
| CyberAgent, Inc. | Ad agency, ad tech, ABEMA streaming | FY Sep 2025 net sales ¥874.0 Bn (+9.1%) |
| LY Corporation | LINE and Yahoo! JAPAN platforms | FY2025 revenue about ¥2.0 T (+6.2%) |
| Hakuhodo DY Holdings Inc. | Agency and media buying | FY2025 revenue ¥861.0 Bn (-9.7%) |
| Google LLC | YouTube, AdMob, Google Play | Not disclosed for Japan |
| GMO Internet, Inc. | Ad networks plus internet infrastructure | Formerly GMO AD Partners |
Pricing Analysis
Japan’s internet ad media costs reached ¥3,309.3 billion in 2025, up 11.8% (Dentsu). Internet ad production costs reached ¥492.2 billion, up 4.0%. Media prices are rising almost three times as fast as production costs. The main price driver is scarce premium ad space, not creative or technology costs.
Market leaders set price floors through auctions that smaller rivals cannot undercut without losing margin. Mid-tier networks compete on managed services and performance guarantees instead of low CPMs. Rewarded video is priced above banners because its high completion rates justify the cost. On iOS, low ATT opt-in rates make it harder to target individual users, so contextual and premium-publisher inventory sells at a higher price. No consistent public figures for CPMs by format exist for Japan, so this report does not model pricing by format.
Company Profiles
Dentsu Group Inc. combines agency buying scale, measurement tools and deep links with Japan’s largest advertisers. Dentsu also publishes Japan’s most cited annual ad spend data, which strengthens its authority with clients. For FY2026, the group guides Japan organic growth of 2–3%. Its main risk is disintermediation: large advertisers may buy directly through DSPs and skip agency fees.
CyberAgent, Inc. owns a major ad business and the ABEMA free streaming service. It posted FY2025 (year to September 2025) net sales of ¥874.0 billion, up 9.1%, and operating income of ¥71.7 billion. It forecasts ¥880 billion in sales for the year to September 2026. Owning both ad tech and streaming inventory lets it offer advertisers performance buys and brand-safe video in one package.
LY Corporation runs LINE and Yahoo! JAPAN, giving it the widest single-app reach in Japan. Its account (official LINE account) and display advertising products sit inside a daily-use messaging app. This makes LY a core buy for any national campaign.
Hakuhodo DY Holdings Inc. reported FY2025 (year to March 2026) revenue of ¥861.0 billion, down 9.7%, while improving its margins. As Japan’s second-largest agency group, it competes with Dentsu for big brand budgets and digital media buying.
Google LLC sells in-app ad space through YouTube, AdMob and Google Play. YouTube’s ad reach in Japan was 78.5 million users in late 2025, the second-largest of any platform after LINE. Google’s auction systems set reference prices across Japan’s app ecosystem, and AdMob is the default way many game and utility apps make money from ads. Google does not disclose its Japan ad revenue.
GMO Internet, Inc. (formerly GMO AD Partners Inc.) combines ad network and media businesses with internet infrastructure, including domains, hosting and internet access. The January 2025 restructuring brought GMO Internet Group’s infrastructure business into the company. This lets it pair ad sales with infrastructure services, which suits small and mid-sized advertisers who want a single vendor.
Key Players
- Dentsu Group Inc.
- CyberAgent, Inc.
- LY Corporation
- Google LLC
- Hakuhodo DY Holdings Inc.
- Adways Inc.
- CyberZ Inc. (CyberAgent group)
- i-mobile Co., Ltd.
- D2C Inc.
- GMO Internet, Inc. (formerly GMO AD Partners)
- ironSource (part of Unity)
- Unity Technologies
- Apple
- Criteo
- AppLovin
- Liftoff (formerly Vungle)
- Meta Platforms (Facebook)
- Amazon
- InMobi
- Chartboost
- Others
Supply Chain and Value Chain Analysis
The value chain runs from the advertiser to the DSP, then the ad exchange, then the SSP (supply-side platform, the software publishers use to sell ads), then the app publisher and finally the user. Most value is created at the DSP and exchange layers, where algorithms turn attention into priced impressions. Gaming publishers keep a higher revenue share than utility apps because their audiences are more engaged and their rewarded inventory is scarce.
The biggest bottleneck is measurement after ATT. With only about 35% of iOS users opting in to tracking, links between ad views and in-app purchases are often broken, which reduces trust in reported ROAS (return on ad spend). Clean-room partnerships and mobile measurement partners (MMPs) are the emerging fix. Mid-sized advertisers without ad operations teams are slow to adopt them, which leaves an opening for managed-service providers.
Regulatory Landscape
APPI governs how app publishers and ad-tech firms collect, store and use personal data. The amendments that took effect on April 1, 2022 made four main changes :
- They added “personal-related information,” which covers cookies and device IDs that don’t identify a person alone but can when combined with other data. This directly affects tracking-based ad targeting
- They made breach reporting mandatory. Firms must send a preliminary report to the PPC within about 3–5 days and a final report within 30 days. Any breach affecting more than 1,000 people triggers this.
- They added “pseudonymously processed information,” which firms can use internally for analytics but generally can’t pass to third parties .
- They tightened the rules on sending data abroad and strengthened the PPC’s enforcement powers .
Apple’s ATT is a company policy, not a law, but it works like a regulation for all iOS in-app ads. Opt-in rates have stayed near 35% since 2023, so advertisers should treat limited tracking as permanent. Together, APPI and ATT have made contextual and first-party targeting the compliant default.
Investment and White Space Analysis
Spending on events, exhibitions and screen displays reached ¥474.8 billion in 2025, up 11.2% (Dentsu). This suggests brands are growing total marketing budgets, not just reallocating them. The clearest gap for new investment is retail media technology, since marketplaces need measurement tools that general DSPs do not provide.
Regions outside Kanto offer cheaper ad space with less competition. New entrants with strong game or messaging publisher ties can win share in Kansai, Chubu and Kyushu. Foreign brands that need Japanese creative, cultural adaptation and APPI-compliant consent form a high-value buyer group that few providers serve end to end.
Research Methodology
The market size was built from the top down, starting with Dentsu’s 2026 forecast of ¥3,584.0 billion for internet ad media spend. In-app spend was estimated at about 48.5% of that total after removing search, mobile web and desktop. Segment and regional shares use official weights: Dentsu’s category data, StatCounter’s OS shares, DataReportal’s platform reach and population by region. Every modelled value is labelled as an estimate.
| Component (2026) | Values |
|---|---|
| Messaging & Social (estimate) | ¥531.1 Bn | USD 3.35 Bn |
| Entertainment (estimate) | ¥416.9 Bn | USD 2.63 Bn |
| Games (estimate) | ¥374.1 Bn | USD 2.36 Bn |
| Online Shopping (estimate) | ¥225.1 Bn | USD 1.42 Bn |
| Payments & Ticketing (estimate) | ¥77.7 Bn | USD 0.49 Bn |
| Others (estimate) | ¥112.6 Bn | USD 0.71 Bn |
| In-app total | ¥1,737.5 Bn | USD 10.96 Bn |
| Share of Dentsu 2026 internet ad media forecast | 48.5% |
CAGR explained: The 15.4% USD CAGR assumes a constant 158.53 JPY/USD, so the constant-currency yen CAGR is also 15.4%. If the yen strengthens to 140 by 2035, the yen CAGR needed falls to 13.8%. If it weakens to 170, the yen CAGR needed rises to 16.3%. At a constant rate, the 2035 value of ¥6,307.9 billion would equal 78.2% of Japan’s 2025 total ad spend, so the forecast is at the upper end of plausible.
Primary and expert validation: This edition is based on desk research. It was checked against official and company sources published between January 2025 and September 2026: Dentsu, MIC, DataReportal (Kepios), StatCounter and the disclosures of 6 profiled companies (Dentsu Group, CyberAgent, LY Corporation, Hakuhodo DY Holdings, Google and GMO Internet). It cites 7 market developments. No primary interviews or surveys were carried out for this edition.
How this report was produced: Analysts drafted this report using AI tools for research support, fact-checking and drafting. A human analyst reviewed it before publication. All modelled figures are labelled as estimates.
Recent Developments
- January 2025: GMO AD Partners Inc. took over GMO Internet Group’s infrastructure business and changed its name to GMO Internet, Inc.
- November 2025: CyberAgent reported ¥461.2 billion in net sales for its Internet Advertisement Business for the year to September 2025, up 6.1%.
- February 2026: Dentsu Group reported 6.2% organic growth for its Japan business in FY2025, with record net revenue of ¥495.6 billion. Double-digit growth in internet media drove the result.
- March 2026: CARTA HOLDINGS, Dentsu, Dentsu Digital and Septeni forecast that internet ad media spend in Japan will grow 8.3% to ¥3,584.0 billion in 2026. They expect video ads to grow 14.7% to ¥1,178.3 billion.
- May 2026: LY Corporation reported FY2025 consolidated revenue of about ¥2.0 trillion, up 6.2%.
- May 2026: MIC published the 2025 Communications Usage Trend Survey, which showed household TV ownership has fallen below smartphone ownership.
- 2026 (H1 FY2026 results): Dentsu reported organic growth of 5.4% in its Japan business, a 13th consecutive quarter of growth. It also said CARTA HOLDINGS had become an equity-method affiliate.
Report Scope
| Report Features | Description |
|---|---|
| Market Value (2026) | USD 10.96 Billion |
| Forecast Revenue (2035) | USD 39.79 Billion |
| CAGR (2026 to 2035) | 15.4% |
| Base Year for Estimation | 2025 |
| Historic Period | 2020 to 2024 |
| Forecast Period | 2026 to 2035 |
| Report Coverage | Revenue Forecast, Market Dynamics, Competitive Landscape, Recent Developments |
| Segments Covered | By Advertising Type (Video Ads, Banner Ads, Interstitial Ads, Rich Media Ads, Others), By Platform (iOS, Android, Others), By Application (Messaging & Social, Entertainment, Games, Online Shopping, Payments & Ticketing, Others) |
| Regions Covered | Kanto, Kansai/Kinki, Chubu, Kyushu-Okinawa, Tohoku, Chugoku, Hokkaido, Shikoku |
| Competitive Landscape | Dentsu Group Inc., CyberAgent, Inc., LY Corporation, Google LLC, Hakuhodo DY Holdings Inc., Adways Inc., CyberZ Inc., i-mobile Co., Ltd., D2C Inc., GMO Internet, Inc., ironSource (Unity), Unity Technologies, Apple, Criteo, AppLovin, Liftoff (formerly Vungle), Meta Platforms, Amazon, InMobi, Chartboost |
| Customization Scope | Customization for segments and prefecture level will be provided. Additional customization can be done based on requirements. |
| Purchase Options | Single User License, Multi-User License (Up to 5 Users), Corporate Use License (Unlimited Users and Printable PDF) |
Sources and References
- Dentsu Inc., “2025 Advertising Expenditures in Japan”, March 5, 2026
- CARTA HOLDINGS, Dentsu, Dentsu Digital and Septeni, “Detailed Analysis of Expenditures on Internet Advertising Media”, March 5, 2026
- Ministry of Internal Affairs and Communications, “Results of the 2025 Communications Usage Trend Survey”, May 29, 2026
- DataReportal (Kepios), “Digital 2026: Japan”
- StatCounter, Mobile Operating System Market Share Japan, September 2026
- Federal Reserve Board, G.5A Foreign Exchange Rates (2025 averages)
- ECB-based USD/JPY reference rates, 2026
- Dentsu Group FY2025 results (February 13, 2026) and H1 FY2026 results
- CyberAgent FY2025 consolidated results, November 14, 2025
- LY Corporation FY2025 results presentation, May 2026
- Hakuhodo DY Holdings FY2025 results
- GMO Internet Group, holding company transition notice, January 1, 2025





























