


Report Overview
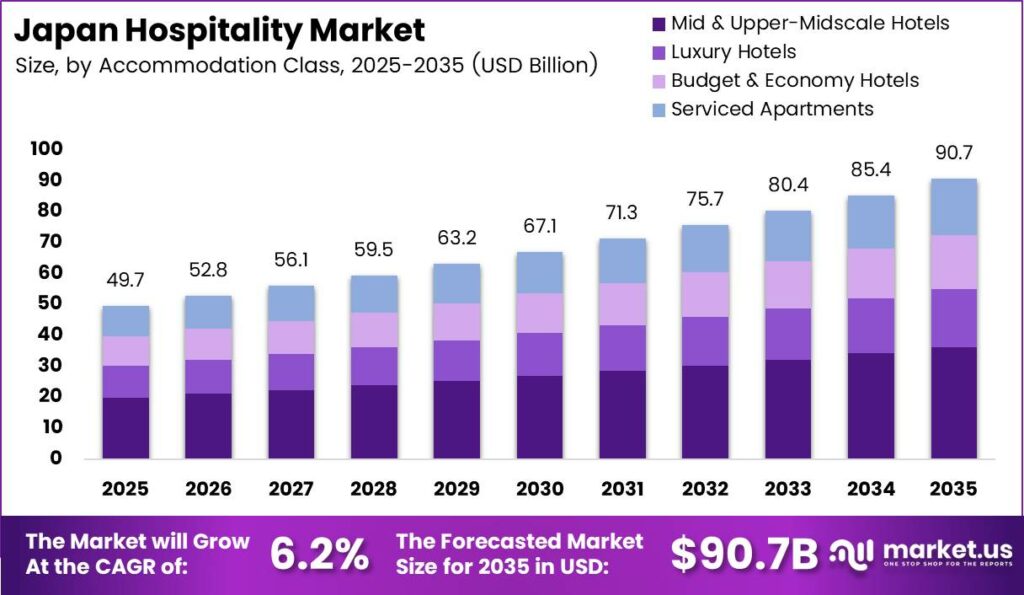
The Japan Hospitality Market could reach approximately USD 90.7 billion by 2035, rising from USD 49.7 billion in 2025. The forecast assumes a 6.2% CAGR during 2026 to 2035. The market covers paid accommodation and associated property-level services across hotels, ryokan, and residential-style lodging. Investor returns depend on converting overnight stays into profitable revenue, rather than adding guestrooms without matching operating capacity.
According to the Japan Tourism Agency, accommodation establishments recorded approximately 661.11 million guest-nights in 2025. That operating base supports investment in distribution, renovation, and service productivity, but guest-nights do not directly measure hospitality revenue. Operators must distinguish additional occupied nights from higher prices and ancillary spending. Investors should therefore test room yield, labor requirements, and distribution expenses separately when evaluating projected revenue expansion.
Key Takeaways
- Japan Hospitality Market size is estimated at USD 49.7 billion in 2025.
- The market is projected to reach approximately USD 90.7 billion by 2035, based on a 6.2% CAGR during 2026 to 2035.
- Independent Hotels dominate the Hotel Affiliation segment with a 72.78% share in 2025.
- Mid & Upper-Midscale Hotels dominate the Accommodation Class segment with a 40.87% share in 2025.
- Online Travel Agencies dominate the Booking Channel segment with a 44.7% share in 2025.
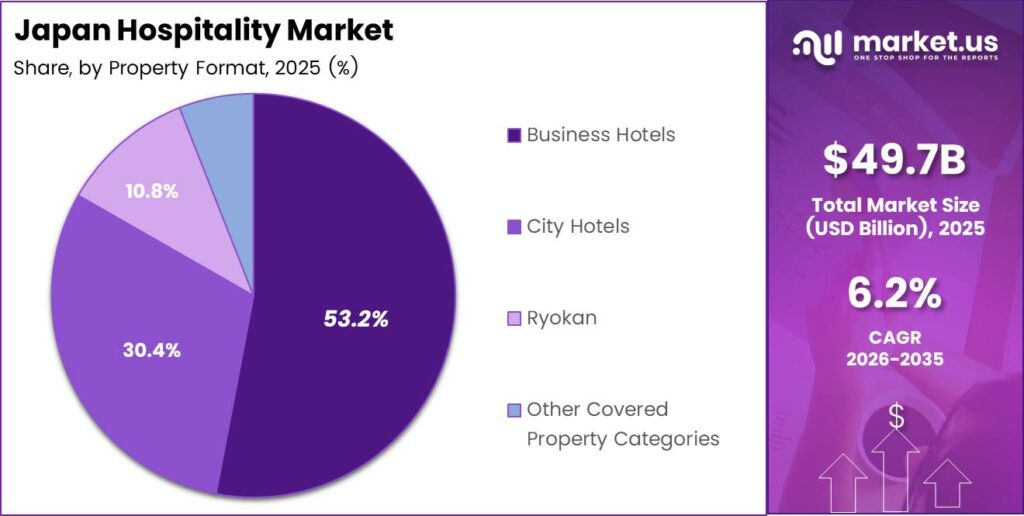
- Business Hotels dominate the Property Format segment with a 53.2% share in 2025.
- Kanto leads the Japan Hospitality Market with a 25.93% share in 2025, equivalent to approximately USD 12.89 billion.
- Kyushu & Okinawa is the fastest-growing region, with a projected 5.7% CAGR during 2026 to 2031.
- Serviced Apartments are the fastest-growing accommodation class, with a projected 6.95% CAGR.
- Direct Digital is the fastest-growing booking channel, with a projected 8.8% CAGR.
As reported by Seibu Holdings, its domestic hotel operations increased revenue per available room by 10.6% during the fiscal year ended March 2026. This portfolio result illustrates how pricing and occupancy can improve revenue without equivalent construction spending. Buyers should still examine property-level performance because portfolio averages conceal weaker locations. Investment cases should separate repeatable operating improvements from temporary events, customer shifts, and renovation-related changes.
Hilton’s June 2026 development announcement identified Conrad Nagoya as an anticipated opening with 170 guestrooms. The announcement illustrates a development strategy that combines accommodation with a mixed-use location rather than relying on a standalone lodging proposition. Investors evaluating comparable projects should examine transport access and the surrounding commercial catchment. Completion status, opening costs, and stabilization assumptions require separate checks before announced capacity enters operating forecasts.
Kanto leads the regional revenue model, reflecting a strategic emphasis on metropolitan accommodation and connected leisure destinations. Developers should evaluate the region through individual station areas, commercial districts, and destination catchments rather than treating every property as equally attractive. The strongest investment cases pair dependable room demand with manageable acquisition and staffing costs. Regional leadership alone does not justify paying a premium that future operating cash flow cannot support.
Policy and licensing belong in the investment model before site acquisition, not after design completion. The report distinguishes conventional hotel operations from the separate private-lodging framework discussed under Restraints. Buyers evaluating conversions should establish the intended operating route before estimating saleable inventory and fixed-cost recovery. This approach prevents a residential conversion from inheriting hotel-style revenue assumptions without the permissions and operating structure needed to deliver them.
Japan Hospitality Market Segmentation Analysis
Hotel Affiliation Analysis
Independent Hotels dominate the Hotel Affiliation segment with an estimated 72.78% share in 2025.
Independent Hotels account for an estimated 72.78% share in 2025. Hotel New Grand’s hotel-business revenue increased 5.3%, while operating profit rose 15.6% in the first quarter of its fiscal year ending November 2026. This operator-level result illustrates the value of earnings improvement beyond sales growth. Investors should assess management continuity, refurbishment needs, and operating contribution rather than room inventory alone.
Chain Hotels represent an estimated 27.22% share. APA reported a network of 1,056 hotels in February 2026, including overseas, planned, and participating properties. Shared distribution and operating systems can strengthen customer access, but network size does not establish property profitability. Investors should weigh affiliation benefits against fees, required capital spending, and local operating costs.
Accommodation Class Analysis
Mid & Upper-Midscale Hotels dominate the Accommodation Class segment with an estimated 40.87% share in 2025.
Mid & Upper-Midscale Hotels hold an estimated 40.87% share in 2025. Fujita Kanko’s WHG average daily rate reached JPY 18,088 in the first quarter of 2026, while occupancy declined to 83%. The result illustrates how stronger pricing can support revenue despite lower utilization. Owners should prioritize upgrades that generate durable rate gains after renovation and operating costs.
Luxury Hotels compete through premium rooms, service, and facilities. Fairmont Tokyo opened in July 2025 with 217 rooms, including 29 suites. The development illustrates investment in a full-service luxury proposition, not evidence of national segment performance. Investors should compare achievable room and ancillary contribution with staffing intensity, development costs, and future refurbishment commitments.
Budget & Economy Hotels require operating costs consistent with price-sensitive customers. Marriott introduced City Express by Marriott to Asia Pacific in May 2026 through two Osaka properties totaling 243 guestrooms. The openings demonstrate branded participation in value-oriented accommodation. Investors should assess location, room efficiency, and distribution costs because brand reach cannot compensate indefinitely for weak property economics.
Serviced Apartments combine accommodation with residential functionality. Oakwood OIMACHI TRACKS Tokyo lists 78 residences with kitchens, laundry facilities, and workspaces. These features support extended stays but require more space than compact hotel rooms. Investors should compare contribution per usable area and servicing frequency, rather than assume that longer bookings automatically deliver better returns.
Booking Channel Analysis
Online Travel Agencies dominate the Booking Channel segment with an estimated 44.7% share in 2025.
Online Travel Agencies hold an estimated 44.7% share in 2025. JETRO identifies platform partnerships connecting accommodation, destination promotion, and bookable experiences. Their commercial value depends on acquiring profitable incremental customers. Hotels should compare commissions, cancellations, and promotional spending with retained booking contribution rather than evaluate performance through gross reservations alone.
Direct Digital channels offer greater control over guest relationships and repeat bookings. APA’s application exceeded 9 million downloads, demonstrating reach rather than completed reservations or channel profitability. Operators should measure conversion, repeat usage, loyalty discounts, and acquisition costs. Direct distribution creates value when its retained contribution exceeds the realistic alternative booking route.
Corporate / MICE business links accommodation with organized events and contracted services. JNTO recorded 1,702 international conferences in Japan during 2024, providing a defined event base rather than a hotel-booking count. Operators should evaluate room-block conversion, catering contribution, and cancellation terms together. Event facilities justify investment when their combined earnings support the space and resources committed.
Wholesale & Traditional Agents support packaged itineraries and assisted purchasing. JTB reported consolidated sales of JPY 1.1333 trillion for the fiscal year ended March 2026, spanning activities beyond hotel distribution. Operators should assess agent relationships through net rates, inventory release periods, and payment terms. Discounted allocations should fill a defined commercial need without displacing more profitable bookings.
Customer Type Analysis
Business Hotels dominate the Property Format segment with an estimated 53.2% share in 2025.
Business Travelers require reliable access, practical facilities, and consistent service. JNTO recorded 276 medium and large international conferences in 2024, illustrating a specific business-event opportunity rather than total corporate travel. Investors should identify which activities generate stays at their property, then assess negotiated rates, weekday utilization, and customer concentration before committing to specialized facilities.
Leisure Travelers choose accommodation within a broader itinerary. Japanese residents’ domestic overnight-trip expenditure reached JPY 21.7211 trillion in 2025, increasing 6.8%. This includes multiple trip purposes and spending beyond hotels, so it is not leisure accommodation revenue. Owners should focus on booking motivations, seasonality, and package contribution when deciding which facilities and services deserve investment.
Revenue Source Analysis
Room Revenue depends on occupied inventory, realized rates, and available capacity. Foreign visitors spent approximately JPY 3.4578 trillion on accommodation in 2025, representing 36.6% of their travel expenditure. This expenditure-side measure is not total operator revenue. Investors should assess how customer mix and stay length affect retained room contribution rather than assign equal value to every additional visitor.
Non-Room Revenue includes restaurants, banquets, and guest services, each with distinct costs. Imperial Hotel’s Tokyo operation reported JPY 11.662 billion in banquet revenue for the fiscal year ended March 2025, including weddings and other events. Investors should evaluate contribution after staffing, purchasing, and facility expenses. Broader revenue streams improve returns only when additional earnings justify their operating complexity.
Property Format Analysis
Business Hotels hold an estimated 53.2% share in 2025. Toyoko Inn opened Kitakami Station West Exit in March 2026 with 225 rooms, illustrating continued investment in transport-connected accommodation. Investors should test local customer capture, competing supply, and staffing requirements. A standardized format creates value only when individual locations meet disciplined operating and capital-return thresholds.
City Hotels represent an estimated 30.4% share. National occupancy reached 74.1% in 2025, but utilization alone does not establish profitability. Restaurants, meetings, and public areas can broaden earnings while increasing costs. Investors should evaluate total property contribution and recurring capital needs rather than compare city hotels with limited-service properties solely through room sales.
Ryokan account for an estimated 10.8% share, with national occupancy of 38.2% in 2025. Different pricing, meal packages, and operating schedules limit direct comparisons with conventional hotels. Investors should assess annual package contribution, seasonal staffing, and renovation obligations. A distinctive guest experience supports returns only when its pricing covers the cost of consistent delivery.
Other Covered Property Categories require format-specific assessment. Resort hotels recorded occupancy of 56.9% in 2025, an indicator for that format rather than the entire residual category. Investors should examine annual cash flow, facility maintenance, and off-peak operating costs. Strong peak-period pricing does not guarantee attractive returns when infrastructure requires funding throughout the year.
Key Market Segments
By Hotel Affiliation
- Independent Hotels
- Chain Hotels
By Accommodation Class
- Mid & Upper-Midscale Hotels
- Luxury Hotels
- Budget & Economy Hotels
- Serviced Apartments
By Booking Channel
- Online Travel Agencies
- Direct Digital
- Corporate / MICE
- Wholesale & Traditional Agents
By Customer Type
- Business Travelers
- Leisure Travelers
By Revenue Source
- Room Revenue
- Non-Room Revenue
By Property Format
- Business Hotels
- City Hotels
- Ryokan
- Others
Regional Analysis
Kanto leads the Japan Hospitality Market with a 25.93% share in 2025, equivalent to approximately USD 12.89 billion.
The following table aggregates 2025 prefectural guest-nights from the same Japan Tourism Agency release. It uses explicit reporting boundaries to avoid comparing regional totals with unrelated city-level or tourist-arrival measures. The figures describe accommodation volume, not regional revenue shares.
| Region | 2025 Guest-Nights, Million | Reporting Boundary |
|---|---|---|
| Kanto | 195.47 | Ibaraki, Tochigi, Gunma, Saitama, Chiba, Tokyo, Kanagawa |
| Kansai | 130.66 | Mie, Shiga, Kyoto, Osaka, Hyogo, Nara, Wakayama |
| Chubu | 109.86 | Niigata, Toyama, Ishikawa, Fukui, Yamanashi, Nagano, Gifu, Shizuoka, Aichi |
| Kyushu & Okinawa | 98.27 | Fukuoka, Saga, Nagasaki, Kumamoto, Oita, Miyazaki, Kagoshima, Okinawa |
| Hokkaido | 46.50 | Hokkaido |
| Tohoku | 38.38 | Aomori, Iwate, Miyagi, Akita, Yamagata, Fukushima |
| Chugoku | 27.19 | Tottori, Shimane, Okayama, Hiroshima, Yamaguchi |
| Shikoku | 14.77 | Tokushima, Kagawa, Ehime, Kochi |
Regional classifications vary between publications, so the boundaries above govern this comparison. Aggregations are calculated from published prefectural estimates and rounded for presentation. They should not be substituted for the revenue-model shares because prices, room mix, and ancillary spending differ between locations.
Kanto leads the working revenue model with an estimated 25.93% share in 2025, equivalent to approximately USD 12.89 billion. The region recorded approximately 195.47 million guest-nights, demonstrating substantial accommodation activity rather than independently validating revenue. Investors should distinguish commercial, transport-linked, and leisure locations when forecasting returns. Large customer catchments support investment only when achievable earnings justify acquisition costs, staffing, and refurbishment commitments.
Kansai recorded approximately 130.66 million guest-nights in 2025. IHG’s August 2026 Kyoto agreement covered 14 hotels and 1,063 rooms, illustrating branded repositioning of existing properties rather than equivalent new construction. Investors should evaluate how stronger distribution and revised standards affect local competition. Conversion opportunities deserve funding when improved earnings outweigh renovation costs, recurring fees, and temporary trading disruption.
Chubu generated approximately 109.86 million guest-nights in 2025 across the nine-prefecture reporting boundary. Conrad Nagoya opened in July 2026 with 170 guestrooms, demonstrating a specific premium-brand investment rather than region-wide luxury performance. Buyers should separate urban commercial hotels from destination properties and compare achievable contribution with capital requirements. Larger rooms and additional services create value only when pricing compensates for their space and operating costs.
Hokkaido recorded approximately 46.50 million guest-nights in calendar 2025. Separately, Asahikawa’s overnight stays increased 13.9% in fiscal 2025, providing city-level evidence that should not be directly substituted for regional results. Investors should examine monthly earnings, customer mix, and recurring expenditure. Strong peak-period pricing supports attractive returns only when annual contribution covers quieter periods, maintenance, and staffing commitments.
Tohoku recorded approximately 38.38 million guest-nights in 2025. Toyoko Inn opened Kitakami Station West Exit in March 2026 with 225 rooms, illustrating transport-oriented accommodation investment. Buyers should assess the local customer catchment, competing inventory, and booking accessibility rather than extrapolate one opening into regional growth. Projects offer stronger prospects when acquisition and operating costs match realistic customer capture and year-round earnings.
Chugoku recorded approximately 27.19 million guest-nights in 2025. APA’s August 2026 opening in Okayama added a 600-room property, making local supply and differentiation important investment considerations. Existing operators should evaluate pricing, distribution costs, and customer retention rather than compete through discounts alone. Buyers should prioritize properties with defensible positioning and acquisition prices that reflect the competitive conditions within their specific catchment.
Shikoku recorded approximately 14.77 million guest-nights in 2025. Kagawa separately reported a preliminary 5.1% increase in visitors from outside the prefecture, citing factors including air-service expansion and major events. Visitor arrivals are not accommodation bookings, so investors should test overnight conversion and distinguish recurring activity from event-related trading. Flexible operating costs and practical itinerary connections can strengthen annual contribution without requiring extensive facility expansion.
Kyushu & Okinawa recorded approximately 98.27 million guest-nights in 2025. Fukuoka Prince Hotel Momochihama opened in March 2026 with 229 ocean-view guestrooms, illustrating an urban property with leisure-oriented features. Investors should assess urban hotels and destination resorts separately rather than apply uniform regional assumptions. Capital allocation should follow each property’s customer base, facility costs, and ability to maintain cash flow during weaker trading periods.
Key Regions
- Kanto
- Kansai
- Chubu
- Hokkaido
- Tohoku
- Chugoku
- Shikoku
- Kyushu & Okinawa
Market Dynamics
As reported by the Japan Tourism Agency, foreign guest-nights outside its defined major metropolitan grouping increased 19.1% during 2025. This supports a geographic investment thesis, but it does not prove that every regional property captured additional business. Operators must connect distribution, transport, and guest experience with their own accommodation offer. Investors should evaluate incremental property contribution rather than using regional visitor dispersion as a substitute for site-specific commercial analysis.
Drivers
International visitor expansion strengthens accommodation revenue when operators convert arrivals into paid nights and suitable room products. According to JNTO, visitor arrivals reached approximately 42.68 million in 2025, increasing 15.8% from the preceding year. Operators should respond with clearer multilingual distribution and disciplined pricing rather than assuming arrival growth translates directly into equal revenue gains. Investors should examine the customer mix and contribution attached to each additional booking.
The driver framework assigns international expansion a modeled contribution of 0.80 percentage points, not an official forecast or measured causal estimate. Domestic overnight activity, regional dispersion, urban utilization, and productivity investment provide separate supporting mechanisms. These contributions describe support embedded in the baseline rather than additions to it. Investors should avoid counting national visitor expansion again when evaluating regional utilization benefits or technology-led operating improvements within the same revenue forecast.
| Driver | (~) % Impact on CAGR Forecast | Geographic Relevance | Impact Timeline |
|---|---|---|---|
| International visitor expansion | +0.80% | Nationwide; Tokyo, Osaka, Kyoto, Hokkaido | Short term (≤ 2 years) |
| Established domestic overnight demand | +0.20% | Nationwide; regional cities and leisure destinations | Short term (≤ 2 years) |
| Existing regional inbound dispersal | +0.25% | Destinations outside the principal metropolitan areas | Short term (≤ 2 years) |
| High-utilization urban accommodation | +0.20% | Major metropolitan hotel clusters | Short term (≤ 2 years) |
| Tourism productivity investment support | +0.15% | Nationwide; independent hotels and ryokan | Medium term (2–4 years) |
Restraints
The private-lodging framework creates a different investment proposition from unrestricted year-round hotel operation. The DORT sensitivity assumes an annual operating ceiling of 180 nights for standard private-lodging registrations, not for every accommodation format. Buyers should confirm the applicable licensing route before calculating saleable inventory. A project that requires continuous operation cannot rely on residential acquisition economics without checking whether its intended authorization supports the revenue model and associated operating structure.
The restraint framework assigns the operating cap a modeled deduction of 0.25 percentage points, reflecting exposure within a particular accommodation category. Municipal restrictions, entry authorization, management obligations, and financing represent separate risk channels rather than additional descriptions of the same lost inventory. Investors should assess each constraint at the property level. Legal feasibility and debt-service capacity should determine acquisition limits before projected room rates or development ambitions influence the purchase price.
| Restraint | (~) % Impact on CAGR Forecast | Geographic Relevance | Impact Timeline |
|---|---|---|---|
| Statutory private-lodging operating cap | -0.25% | Nationwide; standard private-lodging registrations | Long term (≥ 4 years) |
| Additional municipal operating restrictions | -0.15% | Designated residential areas | Long term (≥ 4 years) |
| Accommodation licensing entry barriers | -0.10% | Nationwide; prospective property conversions | Medium term (2–4 years) |
| Owner-absent management obligations | -0.10% | Nationwide; remotely operated private lodgings | Short term (≤ 2 years) |
| Marginal-project financing constraints | -0.15% | Nationwide; leveraged independent developers | Medium term (2–4 years) |
Challenges
Frontline workforce availability determines how much booked business a property can deliver without weakening service or increasing overtime. Housekeeping, reception, and food service require operating capacity that room inventory alone cannot provide. Owners should assess staffing plans against actual guest turnover and service commitments before expanding sales. Investors should prioritize contribution per labor hour because higher occupancy can reduce investment quality when additional bookings require disproportionate recruitment, outsourcing, or supervisory expenditure.
The challenge framework assigns workforce availability a modeled friction of 0.35 percentage points, rather than deriving a national forecast from survey response shares. Specialist management, seasonal utilization, source-market exposure, and measurement consistency require different mitigation plans. Operators should separate daily staffing from commercial planning capability because automation cannot replace every management decision. Investors should examine how each project protects service throughput and operating margins under both peak trading and weaker booking conditions.
| Challenge | (~) % CAGR Friction Drag | Geographic Relevance | Mitigation Horizon |
|---|---|---|---|
| Frontline workforce availability gaps | -0.35% | Nationwide; midsize accommodation and seasonal resorts | Long term (≥ 4 years) |
| Specialist tourism management gaps | -0.15% | Nationwide; independent operators and destination organizations | Medium term (2–4 years) |
| Seasonal room utilization imbalance | -0.10% | Leisure destinations and event-dependent locations | Medium term (2–4 years) |
| International source-market concentration risk | -0.10% | Internationally exposed gateway and resort properties | Medium term (2–4 years) |
| Tourism measurement comparability gaps | -0.05% | Nationwide; portfolio planning and destination benchmarking | Short term (≤ 2 years) |
Opportunities
Bookable local experiences can add revenue around an existing stay without requiring additional guestrooms. Operators should establish supplier contracts, real-time availability, cancellation rules, and integrated payment before selling activities as part of their accommodation offer. A hotel-controlled booking pathway can retain a commission while helping guests complete their itinerary. Investors should evaluate the retained contribution after servicing costs rather than treating the full price of an externally delivered experience as hotel revenue.
The opportunity framework assigns experience integration a conditional upside of 0.30 percentage points. Accessible accommodation, extended-stay products, shared procurement, and verified corporate-stay propositions require separate execution plans and commercial tests. Operators should pilot each offer before incorporating its full contribution into development forecasts. Investors should assess customer adoption, delivery costs, and supplier reliability because a plausible product concept creates investment value only when guests purchase it at a sustainable retained margin.
| Opportunity | (~) % Potential CAGR Upside | Geographic Relevance | Execution Window |
|---|---|---|---|
| Bookable local-experience revenue integration | +0.30% | Regional cultural, culinary, and outdoor destinations | Medium term (2–4 years) |
| Accessible multigenerational accommodation products | +0.20% | Nationwide; leisure hotels and ryokan | Medium term (2–4 years) |
| Extended-stay subscription accommodation | +0.15% | Secondary cities and residential-style urban properties | Medium term (2–4 years) |
| Independent-property procurement platforms | +0.15% | Nationwide; fragmented independent accommodation | Medium term (2–4 years) |
| Verified low-impact corporate stays | +0.10% | Business destinations and corporate travel corridors | Long term (≥ 4 years) |
DORT interpretation: Table percentages represent analyst-assessed percentage-point sensitivities, not independently estimated causal effects or official forecasts. Driver contributions remain embedded in the baseline. Opportunity contributions require execution and should not be treated as certain. The original table HTML is preserved, including its range typography. Legal statements and the numerical sensitivity model require dedicated validation before publication as a fully verified investment report.
Key Company Insights
APA Group / APA Hotel & Resort
According to APA Group, consolidated revenue reached JPY 266.709 billion for the fiscal year ended November 2025. The group-wide figure includes activities beyond accommodation and cannot establish a directly comparable hotel market share. APA’s investment relevance lies in evaluating how its operating model converts property scale into cash generation. Buyers benchmarking the company should separate hotel economics from other businesses before comparing revenue productivity or assigning valuation multiples.
As reported by APA Group, the company opened its Okayama Ekimae Shinkansenguchi hotel in August 2026 with 600 guestrooms. The opening demonstrates a substantial single-property commitment rather than a minor network addition. Investors should evaluate the property’s stabilization through achieved room contribution and service costs. A large inventory can spread operating overhead, but it also requires sufficient recurring bookings to avoid dependence on peak-period pricing alone.
Toyoko Inn Co., Ltd.
Data from Toyoko Inn shows standalone revenue of JPY 162.3 billion for the fiscal year ended March 2026. The standalone reporting perimeter differs from consolidated figures used by other operators, preventing a simple revenue-based ranking. Investors should assess the company through consistent accounting boundaries and property economics. A repeatable operating format creates value when location selection, staffing, and capital expenditure preserve returns across the network rather than merely expanding reported sales.
Toyoko Inn indicates that its Kochi opening in February 2026 completed coverage across all 47 Japanese prefectures. That development marks geographic reach rather than proof of uniform commercial performance. Investors should examine how new locations fit the company’s operating format and repeat-customer proposition. A national footprint can support brand continuity, but each property still needs a credible local customer base and an acquisition or development cost consistent with expected earnings.
Key Players
- APA Hotel & Resort
- Toyoko Inn Co., Ltd.
- Seibu / Prince Hotels & Resorts
- Tokyu Hotels & Resorts Co., Ltd.
- Hotel Okura Co., Ltd.
- Fujita Kanko Inc.
- Hoshino Resorts Inc.
- Mitsui Fudosan Hotels & Resorts Co., Ltd.
- Route Inn Japan Co., Ltd.
- Washington Hotel Corporation
- Kintetsu Miyako Hotels International, Inc.
- Nippon Hotel Co., Ltd. / JR-East Hotels
- Marriott International, Inc.
- Hilton Worldwide Holdings Inc.
- InterContinental Hotels Group PLC
- Accor S.A.
- Hyatt Hotels Corporation
- Wyndham Hotels & Resorts, Inc.
Recent Developments
2026
- August 2026: IHG Hotels & Resorts signed a conversion agreement covering 14 hotels and 1,063 rooms in Kyoto. The agreement concerns renovation and rebranding rather than an equivalent addition of newly built rooms.
- May 2026: Marriott International launched City Express by Marriott in Asia Pacific through two Osaka openings with 243 combined guestrooms. The openings extend its value-oriented accommodation offering.
- March 2026: Marriott International introduced Series by Marriott to Japan through the opening of the 256-room Sugata Hotel Osaka Shinsaibashi. The launch combines an existing local identity with global brand distribution.
- March 2026: Ascott Japan launched an updated community-centered stay programme across 3 Japanese lyf properties. The initiative focuses on shared activities and local engagement rather than additional room capacity.
- January 2026: Accor announced the planned conversion of Lime Resort Myoko into an MGallery Collection property with 38 guestrooms. The announcement scheduled opening for late 2026 and does not independently establish completion.
2025
- July 2025: Accor opened Fairmont Tokyo with 217 rooms, including 29 suites. The opening established Fairmont’s presence in Japan and added a differentiated luxury accommodation proposition.
- June 2025: Hilton signed the planned Hilton Takayama Resort conversion with JR Central Group partners. The announced property specification included 283 rooms, illustrating branded repositioning of existing accommodation.
- May 2025: Imperial Hotel disclosed construction and opening preparations for Imperial Hotel Kyoto with 55 rooms. The disclosure described a planned spring 2026 opening rather than confirming completed operations.
Geopolitical Impact Analysis
According to the International Energy Agency, global oil demand was forecast to decline by 1.1 million barrels per day in 2026 following higher fuel prices and disrupted product availability. The same outlook projected demand growth of 2 million barrels per day in 2027 as trade flows normalize and fuel prices ease. Hotels face indirect exposure through air travel, food deliveries, laundry, and transport services. Investors should test whether higher fuel costs reduce guest travel or increase property operating expenses before assuming stable margins.
Energy-market disruption affects Japan’s hospitality market through access and cost rather than direct hotel supply. Higher aviation-fuel and road-transport costs can weaken international booking conversion and increase the cost of guest services, procurement, and supplier delivery. Operators should protect liquidity, negotiate flexible supplier terms, and diversify customer sources. Properties with resilient cash flow under both travel disruption and cost inflation offer a stronger investment profile.
Report Scope
| Report Features | Description |
|---|---|
| Market Value, 2025 | USD 49.7 billion |
| Forecast Revenue, 2035 | USD 90.7 billion |
| CAGR, 2026 to 2035 | 6.2% |
| Base Year | 2025 |
| Forecast Period | 2026 to 2035 |
| Forecast Method | Annual compounding from the end of 2025 through the end of 2035. The result is a mathematical scenario, not independent validation of the market model. |
| Report Coverage | Revenue Outlook, Market Dynamics, Investment Implications, Accommodation Formats, Distribution, Competitive Landscape, Recent Developments, Geopolitical Exposure. |
| Hotel Affiliation | Independent Hotels, Chain Hotels. |
| Accommodation Class | Mid & Upper-Midscale Hotels, Luxury Hotels, Budget & Economy Hotels, Serviced Apartments. |
| Booking Channel | Online Travel Agencies, Direct Digital, Corporate / MICE, Wholesale & Traditional Agents. |
| Customer Type | Business Travelers, Leisure Travelers. |
| Revenue Source | Room Revenue, Non-Room Revenue. |
| Property Format | Business Hotels, City Hotels, Ryokan, Other Covered Property Categories. |
| Regional Analysis | Kanto, Kansai, Chubu, Hokkaido, Tohoku, Chugoku, Shikoku, Kyushu & Okinawa. |
| Competitive Landscape | APA Group / APA Hotel & Resort, Toyoko Inn, Seibu / Prince Hotels & Resorts, Tokyu Hotels & Resorts, Hotel Okura, Fujita Kanko, Hoshino Resorts, Mitsui Fudosan Hotels & Resorts, Route Inn Japan, Washington Hotel Corporation, Kintetsu Miyako Hotels International, Nippon Hotel / JR-East Hotels, Marriott International, Hilton Worldwide Holdings, InterContinental Hotels Group, Accor, Hyatt Hotels Corporation, Wyndham Hotels & Resorts. |
| Evidence Boundaries | Official and corporate evidence supports the cited historical facts. Commercial market estimates and DORT sensitivities remain modeling assumptions. Company indicators do not establish national segment totals. |
| Regional Value Control | Kanto’s stated regional value remains unreconciled with the national total and regional share. No consistent regional valuation is asserted. |





































