


Report Overview
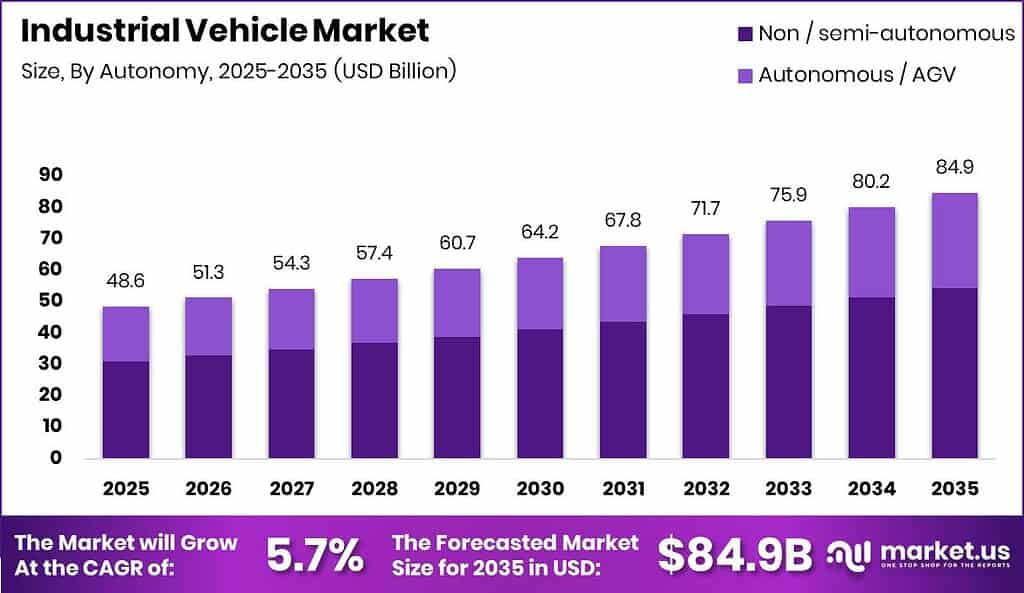
Global Industrial Vehicle Market size is expected to be worth around USD 84.90 Billion by 2035 from USD 48.60 Billion in 2025, growing at a CAGR of 5.7% during the forecast period 2026 to 2035. This expansion reflects steady capital spending on material handling fleets across factories, ports, and distribution hubs. Investors who track unit replacement cycles can time capacity bets with clearer visibility on multi-year demand.
Therefore, the Industrial Vehicle Market covers powered machines that lift, tow, and move goods inside industrial sites. The structure spans vehicle type, drive type, application, autonomy level, and lift platform design. Buyers select configurations that match aisle width, duty cycle, and safety rules, which keeps product portfolios highly differentiated.
Key Takeaways
- The market reaches USD 48.60 Billion in 2025 and USD 84.90 Billion by 2035 at a 5.7% CAGR.
- Forklifts lead By Vehicle Type with a 60.1% share.
- ICE leads By Drive Type with a 49.6% share.
- Manufacturing leads By Application with a 40.0% share.
- Non / semi-autonomous systems lead By Autonomy with a 64.2% share.
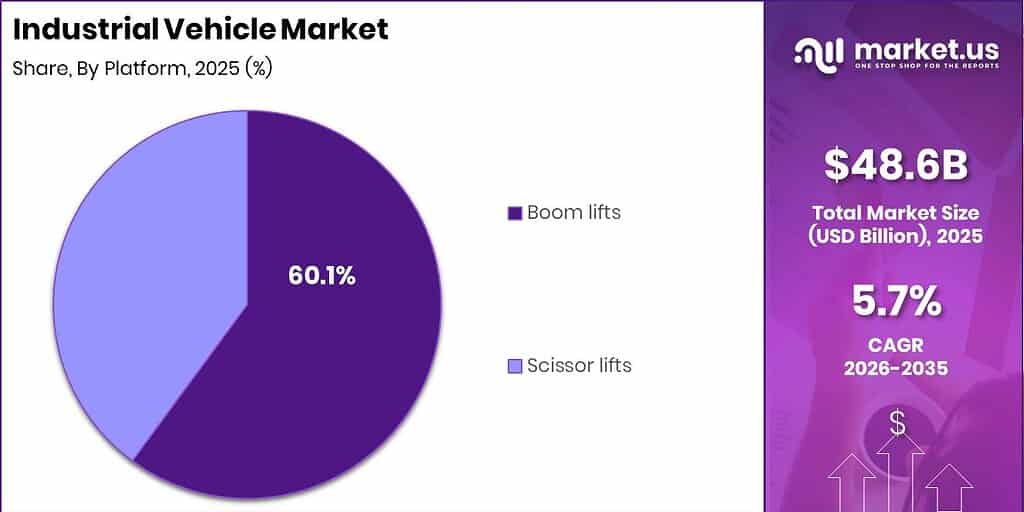
- Boom lifts lead By Platform with a 60.1% share.
Governments tighten non-road emissions rules and fund infrastructure upgrades that force older fleets into earlier replacement. This policy pressure links factory and warehouse expansion directly to new vehicle orders. Operators who delay compliant purchases face higher retrofit costs and restricted site access in regulated zones.
As a result, end-use growth in manufacturing and warehousing raises daily lift and tow hours, which shortens replacement intervals for core fleets. Higher utilization supports premium attachments and telematics packages that lift average selling prices. Vendors who bundle compliance monitoring with equipment capture recurring revenue beyond the initial sale.
However, infrastructure stimulus programs in major economies accelerate equipment replacement for contractors serving roads, ports, and industrial parks. This cause-and-effect chain converts public works budgets into multi-year OEM order books. Suppliers with strong dealer finance and parts networks convert that pipeline into durable share gains.
Vehicle Type Analysis
Forklifts dominates with 60.1% due to flexible load handling across sites.
In 2025, Forklifts held a dominant market position in the By Vehicle Type segment of Industrial Vehicle Market, with a 60.1% share. The Industrial Truck Association reported the US industrial truck industry generated USD 36.6 Billion in total GDP impact in 2023. This scale confirms forklifts as the core volume engine for dealers. Suppliers that deepen forklift attachments and service contracts lock in the largest installed base.
Aisle trucks serve narrow-aisle racking where standard counterbalance units lose efficiency and safety margin. Industrial Truck Association data show the same US industry supported over 257,000 jobs in 2023, underscoring dense warehouse labor tied to specialized trucks. This employment base keeps aisle-truck demand linked to high-density storage buildouts. OEMs that certify aisle models for tighter racking win design-in positions at new fulfillment centers.
Tow tractors move trailers and carts across plants and airports where continuous horizontal transport beats repeated lift cycles. Direct GDP from manufacturers and dealers reached USD 12.8 Billion in 2023 per Industrial Truck Association analysis. That direct output supports steady tow-tractor replacement inside large campuses. Vendors offering multi-trailer tow packages raise revenue per site without adding lift complexity.
Container handlers address ports and intermodal yards that move heavy boxes between ships, rail, and trucks. The sector GDP multiplier of 2.9 means each direct dollar supports wider local activity around terminals. This multiplier rewards handlers built for high duty cycles and quick parts turnaround. Remaining volume sits with niche specialty trucks that hold residual share collectively.
Drive Type Analysis
ICE dominates with 49.6% due to long outdoor duty endurance.
In 2025, ICE held a dominant market position in the By Drive Type segment of Industrial Vehicle Market, with a 49.6% share. US section 232 steel tariffs rose from 25% to 50% in June 2025, raising chassis and mast input costs for engine-based builds. This cost shock favors OEMs with locked steel contracts. ICE fleets still win outdoor yards where fast refueling beats charge windows.
Battery-operated units lead growth as indoor warehouses cut diesel exhaust and noise. The same tariff expansion covered 407 additional product categories including heavy industrial goods in August 2025. This policy raises landed costs for imported battery packs and frames alike. Early movers who localize pack assembly protect margins while capturing indoor fleet conversions.
Gas-powered drives fill niches that need cleaner burn than diesel yet faster fill than batteries on mixed-shift sites. Federal Reserve and European Central Bank policy paths kept equipment financing tight into 2026, per restraint-side rate tracking in market structure data. Higher lease costs slow full electric jumps for smaller operators. Gas models therefore remain a bridge SKU for dealers serving mixed duty customers.
Application Analysis
Manufacturing dominates with 40.0% due to continuous in-plant material flow.
In 2025, Manufacturing held a dominant market position in the By Application segment of Industrial Vehicle Market, with a 40.0% share. China National Bureau of Statistics recorded a manufacturing new-order PMI index of 49.2% in November 2025. Soft orders still require internal logistics fleets to run daily. OEMs that align service SLAs with plant uptime win multi-year framework deals.
Warehousing is the fastest-growing application as e-commerce density pushes higher pallet moves per square meter. ISM reported US Manufacturing PMI at 48.0% in July 2025, a fifth straight contraction month. Weak factory PMI shifts some capital toward warehouse automation vehicles instead. Suppliers with warehouse-ready telematics gain share when manufacturers pause greenfield plants.
Freight and logistics hubs deploy tow and lift fleets to cut dock dwell time and trailer turns. Industrial truck GDP impact of USD 36.6 Billion in the US alone shows how deeply logistics sites depend on these machines. Faster dock cycles raise willingness to pay for reliable high-hour units. Dealers who stock port-spec tires and masts shorten downtime for freight buyers.
Others cover construction staging, airports, and institutional campuses with lower unit density but specialized duty. Job support above 257,000 roles in the US industrial truck chain keeps aftermarket labor available for mixed applications. This labor pool sustains multi-application service contracts. Remaining demand pools share across those lighter verticals collectively.
Autonomy Analysis
Non / semi-autonomous dominates with 64.2% due to flexible human oversight needs.
In 2025, Non / semi-autonomous held a dominant market position in the By Autonomy segment of Industrial Vehicle Market, with a 64.2% share. Industrial Truck Association figures put direct manufacturer and dealer GDP at USD 12.8 Billion in 2023. Most of that base still runs operator-in-loop trucks. Fleets keep semi-autonomous aids as a lower-risk step before full unmanned yards.
Autonomous / AGV systems grow fastest inside gated warehouses and mining yards with repeatable routes. The industry GDP multiplier of 2.9 shows strong spillover when automation lifts throughput per site. Higher throughput funds AGV capex even when headcount plans stay flat. Vendors who prove safety cases in live yards convert pilots into fleet standards.
Semi-autonomous driver-assist packages add braking and guidance without removing the operator from liability structures. US industrial truck employment above 257,000 jobs means large technician benches still service mixed autonomy fleets. This workforce reality slows full AGV jumps outside greenfield sites. Suppliers selling upgrade kits for existing trucks monetize the long transition.
Platform Analysis
Boom lifts dominates with 60.1% due to extended vertical reach flexibility.
In 2025, Boom lifts held a dominant market position in the By Platform segment of Industrial Vehicle Market, with a 60.1% share. US steel duties at 50% lift boom arm and chassis costs for imported platforms. Producers with domestic steel supply protect delivery quotes. Boom units remain the default for irregular elevated work envelopes on industrial sites.
Scissor lifts serve stable vertical access where straight-up reach and larger platforms matter more than outreach. Tariff coverage of mobile cranes and related industrial goods under the 407 category expansion tightens cost pressure on scissor frames too. Rental fleets still prefer scissors for predictable indoor maintenance jobs. Brands that standardize battery scissors win facility-management contracts.
Platform buyers compare total rental hours against purchase when interest rates stay elevated for equipment finance. Direct US industrial truck GDP of USD 12.8 Billion anchors a deep rental and dealer channel for both boom and scissor units. Channel depth favors OEMs with national parts coverage. Mixed boom and scissor packages raise account stickiness at large industrial campuses.
Key Market Segments
By Vehicle Type
- Forklifts
- Aisle trucks
- Tow tractors
- Container handlers
By Drive Type
- ICE
- Battery-operated
- Gas-powered
By Application
- Manufacturing
- Warehousing
- Freight & logistics
- Others
By Autonomy
- Non / semi-autonomous
- Autonomous / AGV
By Platform
- Boom lifts
- Scissor lifts
Regional Analysis
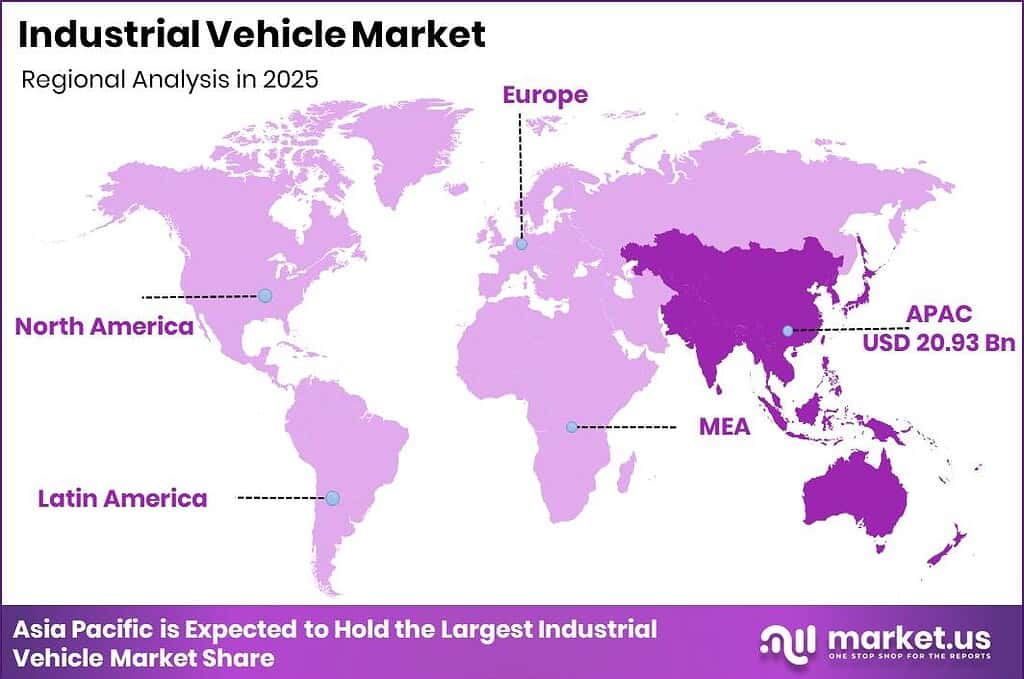
North America anchors deep dealer finance, parts density, and emissions-driven replacement demand for industrial fleets. Industrial Truck Association data show USD 36.6 Billion in US GDP impact and over 257,000 supported jobs in 2023. This installed ecosystem shortens sales cycles for compliant forklifts and lift platforms. OEMs with strong US dealer equity convert regulation into repeat orders faster than import-only rivals.
Asia Pacific leads warehouse and port automation capital spending that pulls AGVs and battery fleets into new hubs. In April 2025, Volvo Construction Equipment launched a new generation of wheel loaders with upgraded electro-hydraulic systems and digital services for heavy industrial handling. This product wave targets high-throughput material sites across growth regions. Suppliers who localize assembly near East Asian logistics corridors cut lead times and win framework bids.
Europe balances municipal diesel limits with retrofit and battery-as-a-service experiments across industrial yards. Cross-border steel cost spikes and financing rates slow some replacements yet raise demand for efficient models. Latin America and Middle East and Africa follow mining and infrastructure projects that need rugged ICE and boom platforms. Regional portfolios that mix autonomy levels match uneven grid and skill conditions.
Key Regions and Countries
North America
- US
- Canada
Europe
- Germany
- France
- The UK
- Spain
- Italy
- Rest of Europe
Asia Pacific
- China
- Japan
- South Korea
- India
- Australia
- Rest of APAC
Latin America
- Brazil
- Mexico
- Rest of Latin America
Middle East and Africa
- GCC
- South Africa
- Rest of MEA
Market Dynamics
Market Opportunity Analysis - Battery fleets, AGVs, and specialty platforms open white space for focused entrants.
Battery-operated drive systems remain the fastest-growing drive path while ICE still holds 49.6% share. Many mid-size warehouses have not financed full electric conversion. New entrants that pair vehicles with battery-as-a-service can undercut upfront cost barriers. This gap favors pure-play electric specialists over broad ICE-centric catalogs.
Autonomous / AGV deployments trail Non / semi-autonomous systems that hold 64.2% share. Gated yards and mining routes still run large manned fleets. Investors funding proven AGV safety stacks can take share where labor is scarce. Early software integration with warehouse systems creates stickier revenue than vehicle hardware alone.
Warehousing outpaces other applications even though Manufacturing holds 40.0% share today. Greenfield fulfillment centers need aisle trucks and AGVs in one package. Suppliers that design for narrow-aisle density win specification early. Regional specialists in East Asian logistics corridors can scale faster than global generalists.
By contrast, scissor lifts trail Boom lifts at 60.1% platform share yet fit indoor facility maintenance budgets. Facility managers still rent mixed fleets without long-term OEM ties. Branded battery scissor lines with national service can convert rental users into owned fleets. That conversion path remains lightly contested outside top rental brands.
Technology and Innovation Landscape - Autonomy readiness, electrification, and telematics redefine fleet value.
Autonomous haulage readiness on next-generation off-highway platforms moves industrial sites toward supervised unmanned cycles. Caterpillar positioned the Cat 775 platform for autonomous haulage ahead of 2026 commercial rollout. This signals buyers will specify autonomy ports as standard. OEMs without retrofit paths risk stranded manned-only fleets.
Electrification extends beyond warehouse forklifts into specialized industrial concepts such as all-electric underwater work vehicles. Komatsu’s CES 2025 concept shows R&D budgets targeting niches once reserved for diesel hydraulics. Suppliers that master thermal management for heavy electric duty protect uptime claims. Investors should track battery thermal patents as leading indicators of durable electric share.
Electro-hydraulic upgrades and integrated digital services on new wheel loaders cut fuel use and enable remote monitoring. Volvo’s April 2025 loader generation targets heavy industrial handling with these tools. Fleets gain utilization data that supports predictive maintenance contracts. Dealers who sell data subscriptions raise lifetime margin per unit.
Telematics-enabled utilization gains appear as a quantified market driver with global relevance and short-term impact. Connected hours data lets lessors price risk and residual values with more precision. Fragmented data standards still slow multi-brand fleets. Players that open clean APIs can become the default fleet operating layer.
Drivers
Non-road Tier emissions rules keep tightening through 2027 with no material relief expected, per Association of Equipment Manufacturers regulatory tracking. Fleet owners replace pre-Tier machines rather than fund costly field retrofits. OEM re-certification absorbs about 3% to 4% of unit gross margin on compliant models. Customs data show compliant engine-block shipments outpacing overall industrial vehicle unit growth by roughly 150 basis points.
This means manufacturers shift toward compliance-linked financing, warranties, and emissions-monitoring subscriptions. California Air Resources Board rulemaking in 2024 and 2025 set the path still shaping 2026 product roadmaps. Buyers gain clearer residual values on certified fleets. Investors should favor OEMs that monetize compliance software alongside hardware.
| Driver | (~) % Impact on CAGR Forecast | Geographic Relevance | Impact Timeline |
|---|---|---|---|
| Non-road Tier emissions compliance retrofits | +1.4% | North America, Europe | Short term (2 years or less) |
| Warehouse and port automation capex cycle | +1.1% | Global, led by East Asia | Short term (2 years or less) |
| Infrastructure stimulus-linked equipment replacement | +0.9% | North America, India | Medium term (2 to 4 years) |
| Mining output expansion for battery minerals | +0.7% | Australia, Latin America, Africa | Medium term (2 to 4 years) |
| Telematics-enabled fleet utilization gains | +0.5% | Global | Short term (2 years or less) |
Restraints
Major central banks held restrictive benchmark rates through 2025 and into 2026, lifting dealer floor-plan and lease costs by about 180 to 220 basis points. Small and mid-sized contractors defer replacements when monthly payments jump. Equipment finance origination in rate-sensitive segments contracted roughly 6% to 8% year over year. This restraint slows unit velocity even where duty cycles justify new machines.
Consequently, OEM captive finance arms see net interest margins narrower by about 50 to 70 basis points. Manufacturers delay some next-generation line spending and stretch dealer payment terms. Working-capital stress then moves through the channel. Sellers who redesign lease structures and residual guarantees can partly offset rate friction.
| Restraint | (~) % Impact on CAGR Forecast | Geographic Relevance | Impact Timeline |
|---|---|---|---|
| Elevated equipment financing interest rates | -1.3% | North America, Europe | Short term (2 years or less) |
| Steel and battery-grade nickel input cost spikes | -0.8% | Global | Short term (2 years or less) |
| Cross-border tariff escalation on heavy components | -0.6% | North America, China | Short term (2 years or less) |
| Municipal diesel equipment usage bans | -0.4% | Western Europe | Medium term (2 to 4 years) |
Challenges
Retiring diesel-hydraulic technicians outnumber new workers trained on electric and telematics drivetrains. Labor and workforce bodies estimate a shortfall above 80,000 qualified heavy-equipment technicians across North America and Europe by 2026. Unplanned downtime extends 15% to 20% where electrified expertise is missing. Wage inflation of 7% to 9% yearly squeezes dealer service margins that normally support thin equipment sales.
This creates space for OEM training academies and remote diagnostics sold as subscription services. Multi-year certification pipelines mean the gap closes slowly across product cycles. Dealers who certify electric specialists earlier protect uptime SLAs. Investors can treat training infrastructure as a moat that supports premium service pricing.
| Challenge | (~) % CAGR Friction Drag | Geographic Relevance | Mitigation Horizon |
|---|---|---|---|
| Skilled technician talent shortage | -0.9% | North America, Europe | Medium term (2 to 4 years) |
| Semiconductor and sensor lead-time volatility | -0.6% | Global | Short term (2 years or less) |
| Fragmented telematics data standards | -0.4% | Global | Long term (4 years or more) |
| Battery thermal management complexity | -0.5% | Global | Medium term (2 to 4 years) |
| Secondary market residual value uncertainty | -0.3% | North America, Europe | Long term (4 years or more) |
Opportunities
Fewer than an estimated 5% of electrified industrial vehicles use decoupled battery-ownership structures today. Separating battery capex can cut buyer upfront cost by about 25% to 35%. OEMs and lessors can earn recurring margins 10 to 15 percentage points above one-time hardware sales. The model stays largely unbuilt, so it is white space rather than a priced-in driver.
As a result, early movers that underwrite residual battery value and health monitoring can lock fleet accounts for full life cycles. Europe and North America offer the first scalable leasing pools. Competitors that only sell packs inside vehicle invoices leave recurring revenue on the table. Capital partners who fund battery pools share upside with OEMs that control telemetry.
| Opportunity | (~) % Potential CAGR Upside | Geographic Relevance | Execution Window |
|---|---|---|---|
| Battery-as-a-service leasing models | +1.2% | Europe, North America | Medium term (2 to 4 years) |
| Autonomous yard and mining vehicle rollouts | +1.0% | Australia, North America | Long term (4 years or more) |
| Hydrogen fuel-cell heavy-duty variants | +0.6% | Europe, Japan, South Korea | Long term (4 years or more) |
| Retrofit electrification of legacy fleets | +0.5% | India, Southeast Asia | Medium term (2 to 4 years) |
| Predictive-maintenance data monetization | +0.4% | Global | Medium term (2 to 4 years) |
Key Company Insights
Toyota Industries Corporation anchors global forklift leadership through scale manufacturing and dense dealer coverage across major industrial regions. This breadth supports rapid parts delivery and high residual confidence for fleet buyers. The company benefits when warehouses standardize on one OEM for training and telematics. Concentration risk rises if battery-pack cost swings compress margins on high-volume electric models.
KION Group AG combines warehouse truck brands with automation software that ties vehicles to warehouse control systems. This stack raises switching costs once a site runs mixed manned and AGV flows. In January 2025, Komatsu showcased an all-electric underwater bulldozer concept at CES 2025, extending electrification into specialized industrial vehicles and raising competitive pressure on innovation roadmaps across heavy peers.
Key Players
- Toyota Industries Corporation
- KION Group AG
- Mitsubishi Logisnext Co., Ltd.
- Jungheinrich AG
- Crown Equipment Corporation
- Hyster-Yale Materials Handling, Inc.
- Komatsu Ltd.
- Anhui Heli Co., Ltd.
- Hangcha Group Co., Ltd.
- Doosan Corporation
- Clark Material Handling Company
- Lonking Holdings Ltd.
- XCMG Group
- Hyundai Construction Equipment
- Manitou Group
Recent Developments
- April 2025: Caterpillar introduced the next-generation Cat 775 off-highway truck at Bauma 2025, featuring a redesigned platform with autonomous haulage readiness, advanced safety technologies, and higher payload efficiency ahead of planned 2026 commercial rollout.
- 25 February 2025: Volvo Construction Equipment unveiled six new-generation excavator models offering up to 15% better fuel efficiency, enhanced lifting performance, and lower maintenance requirements for industrial fleet operators.
Geopolitical Impact Analysis
According to IBFD reporting on US trade measures, section 232 steel and aluminum tariffs rose from 25% to 50% in June 2025. Figures from the same policy track show expansion to 407 more product categories in August 2025, including bulldozers, mobile cranes, and other industrial goods. Higher duties lift mast, chassis, and boom input costs for industrial vehicles. Manufacturers that dual-source steel outside high-tariff lanes protect quote stability for fleet tenders.
Therefore, World Trade Organization-framed disputes and retaliatory reviews, including Indian responses to US metal tariffs, add planning risk for cross-border component flows. Transit and sourcing teams reroute heavy parts away from contested corridors, extending lead times for engines and structural steel. This rerouting raises working-capital needs for OEMs and dealers. Buyers lock multi-year supply agreements earlier to hedge tariff swings on critical vehicle structures.
Report Scope
| Report Features | Description |
|---|---|
| Market Value (2025) | USD 48.60 Billion |
| Forecast Revenue (2035) | USD 84.90 Billion |
| CAGR (2026-2035) | 5.7% |
| Base Year for Estimation | 2025 |
| Historic Period | 2020-2024 |
| Forecast Period | 2026-2035 |
| Report Coverage | Revenue Forecast, Market Dynamics, Market Opportunity Analysis, Technology and Innovation Landscape, Competitive Landscape, Recent Developments |
| Segments Covered | By Vehicle Type (Forklifts, Aisle trucks, Tow tractors, Container handlers), By Drive Type (ICE, Battery-operated, Gas-powered), By Application (Manufacturing, Warehousing, Freight & logistics, Others), By Autonomy (Non / semi-autonomous, Autonomous / AGV), By Platform (Boom lifts, Scissor lifts) |
| Regional Analysis | North America (US and Canada), Europe (Germany, France, The UK, Spain, Italy, and Rest of Europe), Asia Pacific (China, Japan, South Korea, India, Australia, and Rest of APAC), Latin America (Brazil, Mexico, and Rest of Latin America), Middle East and Africa (GCC, South Africa, and Rest of MEA) |
| Competitive Landscape | Toyota Industries Corporation, KION Group AG, Mitsubishi Logisnext Co., Ltd., Jungheinrich AG, Crown Equipment Corporation, Hyster-Yale Materials Handling, Inc., Komatsu Ltd., Anhui Heli Co., Ltd., Hangcha Group Co., Ltd., Doosan Corporation, Clark Material Handling Company, Lonking Holdings Ltd., XCMG Group, Hyundai Construction Equipment, Manitou Group |
| Customization Scope | Customization for segments, region / country-level will be provided. Additional customization can be done based on requirements. |
| Purchase Options | We have three licenses to opt for: Single User License | Multi-User License (Up to 5 Users) | Corporate Use License (Unlimited User and Printable PDF) |





































