
Global Offshore Wind Power Market Size, Share, Growth Analysis By Installation (Fixed Structure, Floating Structure), By Capacity (Up to 3 MW, 3 MW to 5 MW, Above 5 MW), By Water Depth (Shallow Water (Less-than 30 M Depth), Transitional Water (30-60 M Depth), Deepwater (More than 60 M Depth)) , By Region and Companies - Industry Segment Outlook, Market Assessment, Competition Scenario, Trends and Forecast 2025-2034
- Published date: Nov 2025
- Report ID: 167354
- Number of Pages: 257
- Format:
-
keyboard_arrow_up
Quick Navigation
Report Overview
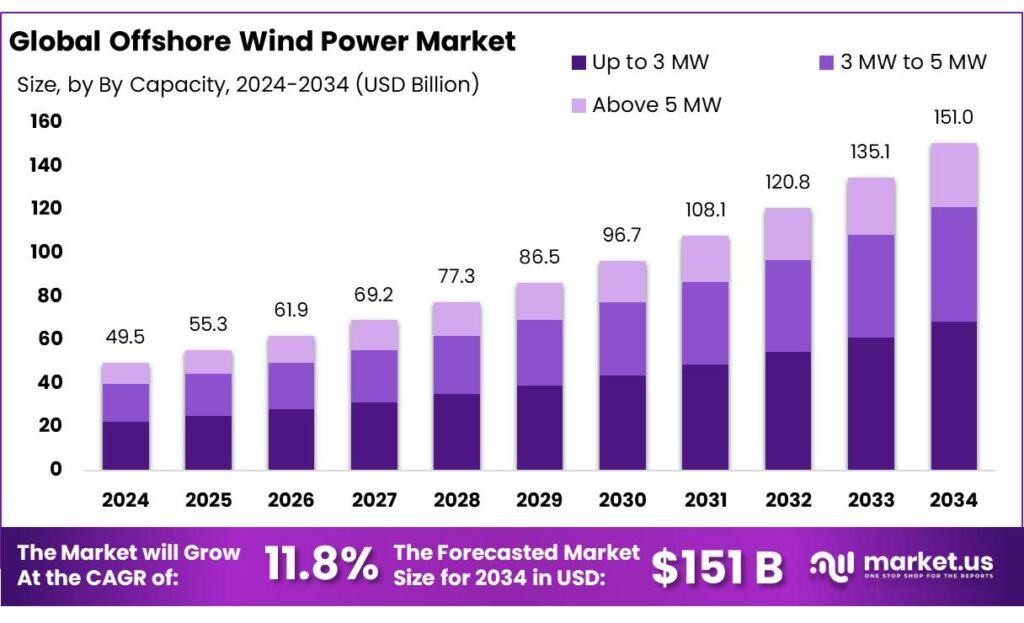
The Global Offshore Wind Power Market size is expected to be worth around USD 151.0 Billion by 2034, from USD 49.5 Billion in 2024, growing at a CAGR of 11.8% during the forecast period from 2025 to 2034. In 2024, Europe held a dominan market position, capturing more than a 45.20% share, holding USD 22.3 Billion revenue.
The offshore wind industry is established as a rapidly expanding segment of the global wind market, driven by larger turbine sizes, falling levelised costs, and expansion into deeper waters via fixed-bottom and floating technologies. Global installed offshore capacity was reported at approximately 83.2 GW at the end of 2024, representing roughly 7–7.5% of total global wind capacity.
The industrial scenario is characterised by maturing technology, rising turbine scale, and an evolving supply chain. Installed offshore wind capacity was estimated at ~79.4 GW in 2024 by an international renewables agency, showing a multi-fold increase over the last decade as foundations, turbine sizes and project management practices were standardised.
Key driving factors have been policy commitments, auction frameworks, and targeted public investment to address permitting and grid integration. In the United States, federal objectives include deployment goals of 30 GW by 2030 and a pathway beyond 110 GW by 2050, with dedicated DOE initiatives to reduce costs and unlock floating offshore wind potential. In the European Union, member-state ambitions have been aggregated into regional ranges of approximately 86–89 GW by 2030, 259–261 GW by 2040, and 356–366 GW by 2050, which will drive a significant pipeline of tenders, ports investment and electrical transmission upgrades.
Policy and government initiatives. Ambitious public targets are underpinning pipeline growth: the European Commission’s offshore strategy aims to raise EU offshore renewable capacity from current levels to ≥60 GW by 2030 and ~300 GW by 2050. In the United States, the federal target of 30 GW of offshore wind by 2030 has been promulgated to accelerate project approvals and port and supply investments. These targets are being supported by state and national permitting, port upgrades, and industrial policies.
Key Takeaways
- Offshore Wind Power Market size is expected to be worth around USD 151.0 Billion by 2034, from USD 49.5 Billion in 2024, growing at a CAGR of 11.8%.
- Fixed Structure held a dominant market position, capturing more than a 79.9% share in the Offshore Wind Power Market.
- Above 5 MW held a dominant market position, capturing more than a 67.8% share in the Offshore Wind Power Market.
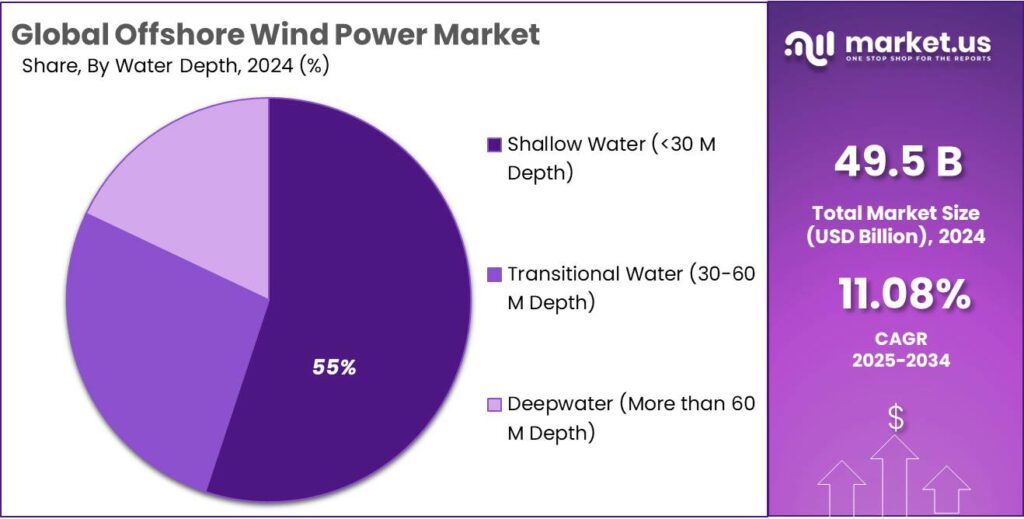
- Hallow Water (<30 M Depth) held a dominant market position, capturing more than a 55.2% share of the Offshore Wind Power Market.
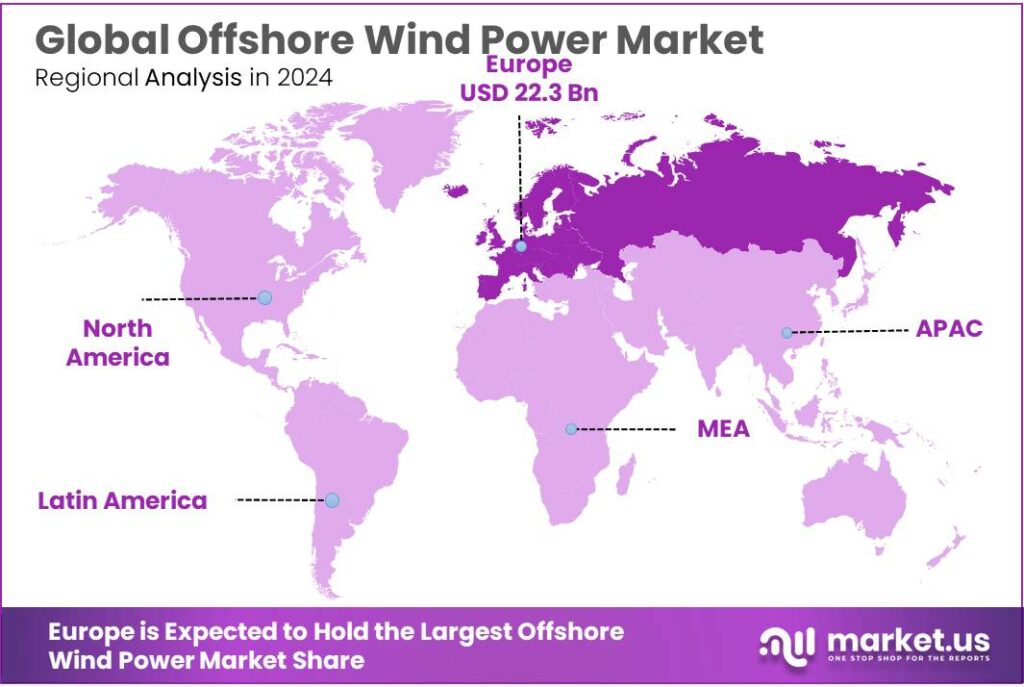
- Europe leads the offshore wind power market with a dominant 45.20% share, valued at USD 22.3 Bn.
By Installation Analysis
Fixed Structure dominates with 79.9% share in offshore wind installations.
In 2024, Fixed Structure held a dominant market position, capturing more than a 79.9% share in the Offshore Wind Power Market. This strong foothold mainly comes from its long-established engineering base, predictable installation process, and cost efficiency compared with floating platforms. Countries such as the UK, China, Germany, Denmark, and the Netherlands continued expanding fixed-bottom capacity as part of ongoing offshore wind expansion programs, supporting stable demand across shallow and mid-depth coastal zones.
Moving forward into 2025, fixed-structure installations are expected to remain relevant, especially in regions with favorable seabed conditions below 60 meters in depth. Governments in Europe and Asia are still awarding seabed leases that align with traditional fixed installation technologies. Engineering advancements in turbine size—from 12 MW to 18 MW classes—are also being adapted to fixed foundation designs, maintaining industry confidence despite increasing water depths. However, while growth continues, some transition is anticipated in deeper waters where floating wind gains traction.
By Capacity Analysis
Above 5 MW turbines dominate offshore wind capacity with 67.8% share.
In 2024, Above 5 MW held a dominant market position, capturing more than a 67.8% share in the Offshore Wind Power Market. This shift toward large turbines reflects the industry’s push for higher efficiency, fewer units per project, and reduced overall cost per installed megawatt. Many new offshore wind farms launched in 2024 used turbines in the 8 MW to 14 MW range, supporting faster installation cycles and maximizing wind capture in deep-water, high-wind regions.
Looking ahead into 2025, demand for turbines above 5 MW is expected to strengthen further as manufacturers scale up production of next-generation models. Several turbine makers are now preparing platforms exceeding 15 MW, driven by government energy transition targets and power purchase agreements requiring higher output per turbine. The trend also aligns with environmental goals, as fewer turbines mean less disruption during installation and more efficient use of seabed space.
By Water Depth Analysis
Shallow Water (<30 M Depth) dominates with a 55.2% share due to easier installation and cost benefits.
In 2024, Shallow Water (<30 M Depth) held a dominant market position, capturing more than a 55.2% share of the Offshore Wind Power Market. Most early offshore wind farms were built in shallow areas because the seabed conditions in these zones allowed simpler engineering methods and reduced installation complexity. Fixed foundation systems such as monopiles and gravity-based structures were widely used in these shallow regions, lowering construction risk and bringing predictable project timelines.
Looking into 2025, shallow-water projects remain an essential part of offshore wind development, especially in regions where coastlines have firm seabed support and established supply chains. Although deeper water sites and floating wind concepts are gaining attention, many announced tenders and grid connections for 2025 still focus on shallow coastal areas due to lower upfront cost and established logistical frameworks.
Key Market Segments
By Installation
- Fixed Structure
- Floating Structure
By Capacity
- Up to 3 MW
- 3 MW to 5 MW
- Above 5 MW
By Water Depth
- Shallow Water (<30 M Depth)
- Transitional Water (30-60 M Depth)
- Deepwater (More than 60 M Depth)
Emerging Trends
Record-high auctions and pipeline expansion signal a turning point in offshore wind
One of the strongest trends currently shaping the offshore wind industry is the rapid escalation of auction awards and project pipelines around the world. In 2024, the global installed offshore wind capacity reached about 83 GW, enough to power some 73 million households. What’s especially noteworthy is that last year’s capacity auctions awarded a record 56 GW of new capacity globally—highlighting just how governments and regulators are accelerating commitments.
This builds on an underlying shift: offshore wind is not only being built, but it is actively being scheduled out far ahead of time with large capacity volumes. The sheer size of the 2024 award number 56 GW signals that more projects are moving from concept to delivery, which in turn encourages supply-chain investment, port infrastructure upgrades, turbine manufacturing scale-up and logistics planning. All of this strengthens the basic foundation of the industry.
At the same time, while the auctions are high, the new capacity additions themselves tell a nuanced story. In 2024, offshore wind accounted for just 6.7% of new grid-connected wind capacity and represented 7.3% of the total installed wind capacity at year-end. This indicates that although offshore is growing rapidly, it still remains a smaller share of the broader wind market. That contrast—big policy push, still modest share—makes sense: offshore wind involves larger engineering challenges, longer timelines, and deeper integration into the grid.
Drivers
Government climate goals and net-zero pledges are pushing offshore wind forward
A big driving force behind offshore wind power today is simple: governments have promised to cut emissions fast, and they need reliable, large-scale clean power to do it. At COP28, more than 130 governments agreed to work toward tripling global renewable capacity to at least 11,000 GW by 2030, and offshore wind is one of the few technologies that can add huge volumes of power in a relatively small area.
By 2024, global wind capacity had reached about 1,131 GW, with offshore wind accounting for roughly 79.4 GW, according to IRENA. That means offshore wind has grown almost six-fold from around 12 GW in 2015, highlighting how quickly policymakers and utilities are moving into sea-based projects. This sharp rise is not happening by accident; it is directly linked to clean-energy targets, carbon-pricing schemes, and coal-phase-out plans in Europe, Asia, and now North America.
Energy agencies are clear that this pace still has to accelerate. The IEA estimates wind power needs to produce around 7,100 TWh of electricity by 2030 in its Net Zero pathway, almost tripling output compared with 2023 levels. Offshore wind carries a large share of that burden because its turbines are big, capacity factors are high, and many coastal countries lack enough land for onshore build-out. In simple terms, if governments want net-zero power systems, they cannot get there without a major offshore build.
Industry and governments have already mapped out what that expansion could look like. GWEC and other international bodies expect more than 380–410 GW of new offshore wind capacity to be installed over the next decade, taking total offshore capacity into the hundreds of gigawatts by 2030. This pipeline is supported by auction programs in the UK, EU, China, Taiwan, South Korea, Japan, and the U.S., where regulators are offering long-term power contracts and grid-connection guarantees to reduce risk for developers.
Restraints
Rising supply-chain and material costs weigh heavily on offshore wind growth
One of the major restraining factors facing the offshore wind power sector is the sharp increase in supply-chain and material costs, which are undermining project economics, investor confidence and deployment timelines. Many offshore wind farms rely on large volumes of steel, copper, aluminium, cabling, turbine components and installation vessels, all of which have seen steep price inflation in recent years. For example, the International Energy Agency (IEA) reports that since early 2020 the price of steel has increased by about 50%, copper by 60%, and aluminium by 80 %.
These rises matter a great deal in offshore wind because each megawatt of capacity installed at sea often requires greater amounts of materials and heavier foundations compared with land-based wind. A 2021 study by the National Renewable Energy Laboratory (NREL) found that for a 30 GW offshore wind target by 2030, the sector would need to expand annual steel and electrical-cable demand by roughly 50% and 90%, respectively, relative to the 2020s.
For project developers and governments alike this means either the levelised cost of electricity (LCOE) goes up—or bid prices in auctions become too risky. The IEA’s “Projected Costs of Generating Electricity 2020” report indicated that although offshore wind costs had fallen broadly, five years earlier the median LCOE still exceeded USD 150/MWh, and only recently dropped below USD 100/MWh on many projects.
Opportunity
Deep-water & floating wind hold huge expansion potential for offshore wind power
One of the major growth opportunities for the offshore wind power sector lies in harnessing deep-water zones and floating wind technologies, enabling access to vast new areas of offshore resource that were previously out of reach. According to International Renewable Energy Agency (IRENA), the global floating offshore wind industry had only around 270 MW of operational capacity as of 2023, despite a pipeline of approximately 244 GW of upcoming projects.
Second, floating offshore wind open new geographies: countries without extensive shallow continental shelves (such as Japan, United States west coast, parts of Southern Hemisphere) now have a pathway to offshore wind deployment. When governments build policies and lease areas geared towards floating platforms, the addressable market expands dramatically. Indeed IRENA projects global offshore wind capacity could reach as much as 2000 GW by 2050 under favourable conditions.
Technically and economically the scale looks meaningful. While the primary revenue for a wind farm remains electricity generation, modelling studies suggest adding aquaculture could boost lifetime value and improve project investment cases—especially as floating and deeper-water wind farms become more common and incremental margins matter more. One review found that globally the fixed and floating offshore wind potential is around 71,000 GW of capacity using current technology.
Regional Insights
Europe dominates the Offshore Wind Power Market with a 45.20% share, valued at USD 22.3 billion in 2024.
Europe leads the offshore wind power market with a dominant 45.20% share, valued at USD 22.3 Bn. Europe has emerged as the core region for offshore wind, driven by strong climate policy, mature supply chains and supportive regulation. In 2024, Europe is estimated to account for around 45.20% of global Offshore Wind Power Market revenues, with a value close to USD 22.3 Bn, underpinned by a rapidly growing installed base. The European Commission reports that offshore wind capacity in the EU reached about 19.38 GW in 2023, confirming the bloc’s role as an early mover in large-scale offshore deployment.
In this period, Europe remained the core hub for offshore wind development, supported by mature policy frameworks, advanced grid infrastructure, and strong political will to cut carbon emissions. The region had around 37 GW of installed offshore wind capacity out of a total 285 GW of wind capacity by the end of 2024, showing how central offshore projects are to Europe’s energy mix. The European Commission’s offshore renewable energy strategy targets at least 60 GW of offshore wind by 2030 and 300 GW by 2050, giving long-term visibility to developers, port operators, and turbine manufacturers.
Key Regions and Countries Insights
- North America
- US
- Canada
- Europe
- Germany
- France
- The UK
- Spain
- Italy
- Rest of Europe
- Asia Pacific
- China
- Japan
- South Korea
- India
- Australia
- Rest of APAC
- Latin America
- Brazil
- Mexico
- Rest of Latin America
- Middle East & Africa
- GCC
- South Africa
- Rest of MEA
Key Players Analysis
GE Vernova, GE’s energy spin-off, continues to play a significant role in offshore wind. Despite a US$1.1 billion loss in 2023, the company reported a backlog of around US$4 billion in offshore equipment orders, which it expects to fulfill by 2025. GE’s Haliade platform remains central to its future strategy, even as it shifts to a “workhorse” model to improve margins.
Vestas is a long-established global wind OEM and remains a top-tier player in offshore wind. According to GWEC data, Vestas held a significant share (about 10–11%) of cumulative global offshore installations by end of 2024. The company leverages strong R&D, modular turbine designs, and digital optimization to maintain its competitiveness, especially in markets where robust onshore experience can support offshore expansion.
Doosan Heavy Industries is a prominent South Korean OEM focusing on offshore wind turbine manufacturing as well as EPC. In 2021, Doosan signed a KRW 190 billion (~€141 million) contract to supply 5.56 MW turbines for the Jeju Hallim offshore wind farm. Its advanced 8 MW DS205-8MW turbine, type-certified in 2022, is designed to withstand typhoon winds up to 70 m/s, enhancing its regional competitiveness.
Top Key Players Outlook
- General Electric
- Vestas
- Shanghai Electric Wind Power Equipment Co.
- Siemens Gamesa
- Doosan Heavy Industries and Construction
- Hitachi
- Rockwell Automation
- Nordex SE
- Hyundai Motor Group
- Schneider Electric
- Zhejiang Windey Co.
- Taiyuan Heavy Industry Co
Recent Industry Developments
In 2024, General Electric made a notable push in offshore wind by commissioning its first of the 13 MW+ Haliade‑X turbines for the Vineyard Wind 1 project in the U.S.—one unit delivered roughly 5 MW to the grid on 2 Jan 2024, and five turbines were expected to reach full capacity early in the year.
In 2024, Siemens Gamesa Renewable Energy (SGRE) secured a significant offshore wind turbine contract valued at £1.0 billion (US $1.3 billion) to supply 64 turbines for the 960 MW East Anglia TWO offshore wind farm in the UK.
Report Scope
Report Features Description Market Value (2024) USD 49.5 Bn Forecast Revenue (2034) USD 151.0 Bn CAGR (2025-2034) 11.8% Base Year for Estimation 2024 Historic Period 2020-2023 Forecast Period 2025-2034 Report Coverage Revenue Forecast, Market Dynamics, Competitive Landscape, Recent Developments Segments Covered By Installation (Fixed Structure, Floating Structure), By Capacity (Up to 3 MW, 3 MW to 5 MW, Above 5 MW), By Water Depth (Shallow Water (<30 M Depth), Transitional Water (30-60 M Depth), Deepwater (More than 60 M Depth)) Regional Analysis North America – US, Canada; Europe – Germany, France, The UK, Spain, Italy, Rest of Europe; Asia Pacific – China, Japan, South Korea, India, Australia, Singapore, Rest of APAC; Latin America – Brazil, Mexico, Rest of Latin America; Middle East & Africa – GCC, South Africa, Rest of MEA Competitive Landscape General Electric, Vestas, Shanghai Electric Wind Power Equipment Co., Siemens Gamesa, Doosan Heavy Industries and Construction, Hitachi, Rockwell Automation, Nordex SE, Hyundai Motor Group, Schneider Electric, Zhejiang Windey Co., Taiyuan Heavy Industry Co Customization Scope Customization for segments, region/country-level will be provided. Moreover, additional customization can be done based on the requirements. Purchase Options We have three licenses to opt for: Single User License, Multi-User License (Up to 5 Users), Corporate Use License (Unlimited User and Printable PDF) 
-
-
- General Electric
- Vestas
- Shanghai Electric Wind Power Equipment Co.
- Siemens Gamesa
- Doosan Heavy Industries and Construction
- Hitachi
- Rockwell Automation
- Nordex SE
- Hyundai Motor Group
- Schneider Electric
- Zhejiang Windey Co.
- Taiyuan Heavy Industry Co
Our Clients
- 167354
- Nov 2025


