
Global Nonylphenol Market Size, Share Analysis Report By Grade (Reagent Grade, Industrial Grade), By Application (Antioxidant, Emulsifiers, Stabilizers, Detergents, Cleaning, Dispersing Agent, Others), By End-Use (Chemical, Building, and Construction, Food And Beverages, Automotive, Pulp And Paper, Agrochemicals, Oil And Gas, Others) , By Region and Companies - Industry Segment Outlook, Market Assessment, Competition Scenario, Trends and Forecast 2025-2034
- Published date: Nov 2025
- Report ID: 164041
- Number of Pages: 320
- Format:
-
keyboard_arrow_up
Quick Navigation
Report Overview
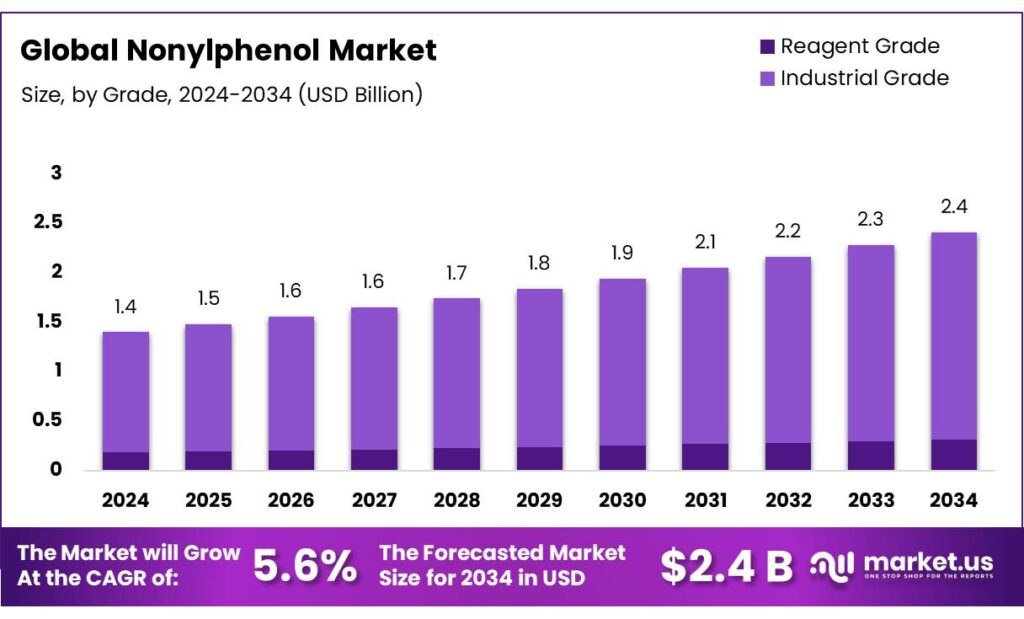
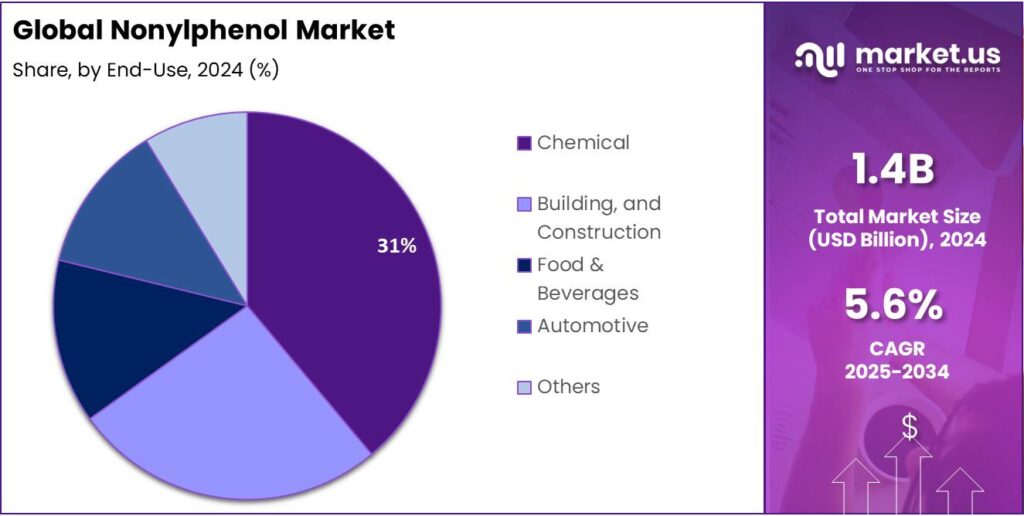
The Global Nonylphenol Market size is expected to be worth around USD 2.4 Billion by 2034, from USD 1.4 Billion in 2024, growing at a CAGR of 5.6% during the forecast period from 2025 to 2034. In 2024 North America held a dominant market position, capturing more than a 43.8% share, holding USD 3.3 Billion in revenue.
Nonylphenol (NP) is an alkylphenol used mainly to make nonylphenol ethoxylates (NPEs), powerful non-ionic surfactants for textile processing, industrial cleaning, paper, and emulsification. Its persistence and endocrine-disrupting properties have prompted tighter oversight. A World Health Organization assessment estimated that 2,690 kg/day of NP could reach surface waters in a continental scenario via wastewater transformation of NPEs, with 2.5% of NPE entering a plant ultimately converted to NP—quantifying the environmental pathway that underpins policy action.
In the European Union, NPE in textile articles that can be washed in water may not be placed on the market at ≥0.01% (w/w) after 3 February 2021, a hard limit set by REACH Annex XVII. This has accelerated the shift toward non-APEO surfactants in apparel supply chains and laundering applications. In the United States, EPA’s NP/NPE Action Plan (2010) and subsequent proposals for Significant New Use Rules signal closer federal scrutiny of new uses and broader workplace and wastewater risk management—guiding formulators to lower-risk alternatives without compromising industrial cleaning efficacy.
Energy economics also frame NP value chains. The chemical sector—where surfactants sit in downstream chains—is the largest industrial energy consumer and the third-largest in direct CO₂ emissions. IEA estimates ~935 Mt of direct CO₂ from primary chemical production in 2022 with intensity around 1.3 t CO₂ per tonne of primary chemicals, highlighting pressure to decarbonize power and heat serving surfactant intermediates. Globally, about 10% of plastics are recycled, so material-efficiency levers must expand to dampen virgin feedstock growth. Coal supplied ~36% of process energy for primary chemicals in 2022, underlining regional energy-price and emissions exposure for NP producers tied to coal-heavy grids.
Demand signals are mixed. On one hand, global detergent and textile processing volumes still require performant surfactants; on the other, retailers and brands specify APEO-free wet-processing. The energy-system backdrop matters: industry used 37% (166 EJ) of global final energy in 2022, with chemicals the largest industrial energy consumer—reinforcing that decarbonization costs and electricity prices will shape competitiveness for NP substitutes and alternatives.
Regulatory pressure is a primary driving factor. Numeric standards create clear compliance targets and catalyze reformulation. Facilities that handle or transform NP-related substances must ensure effluents meet the EPA criteria to sustain NPDES permit compliance, which has prompted investment in better segregation, advanced oxidation, and biological polishing steps. In the EU single market, the 0.1% content threshold under REACH materially narrowed the addressable market for conventional NPE-based formulations, accelerating demand for readily biodegradable surfactants with lower bioaccumulation profiles.
Key Takeaways
- Nonylphenol Market size is expected to be worth around USD 2.4 Billion by 2034, from USD 1.4 Billion in 2024, growing at a CAGR of 5.6%.
- Industrial Grade held a dominant market position, capturing more than an 87.3% share of the global nonylphenol market.
- Emulsifiers held a dominant market position, capturing more than a 28.7% share of the global nonylphenol market.
- Chemical sector held a dominant market position, capturing more than a 31.2% share of the global nonylphenol market.
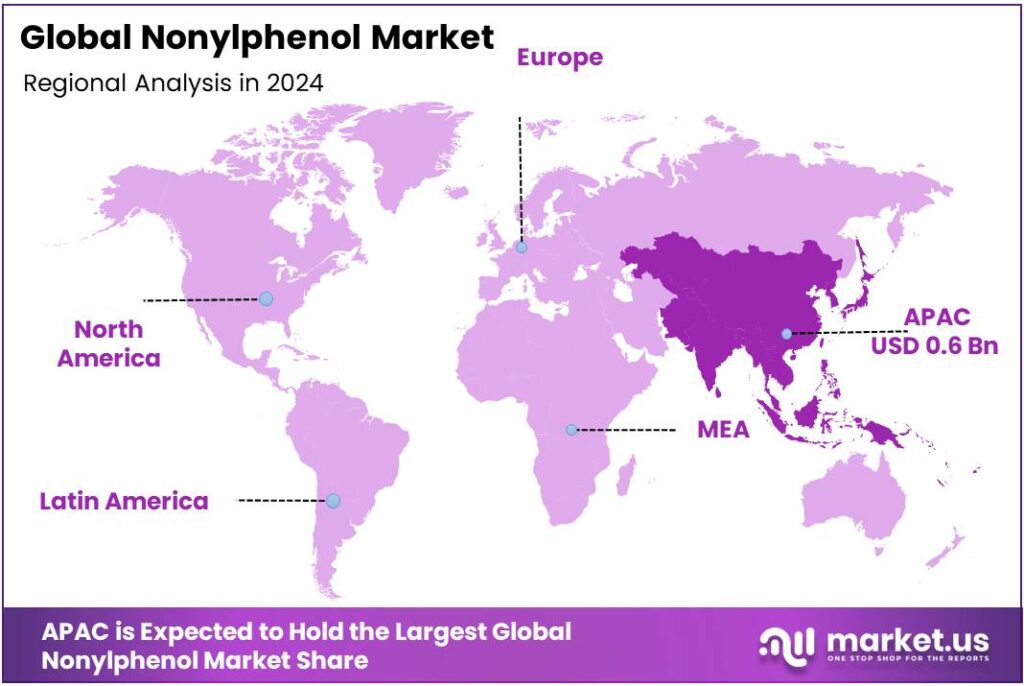
- Asia-Pacific (APAC) region held a dominant position in the global nonylphenol market, accounting for 42.9% of total revenue, valued at approximately USD 0.6 billion.
By Grade Analysis
Industrial Grade dominates with 87.3% share driven by high industrial consumption and chemical versatility
In 2024, Industrial Grade held a dominant market position, capturing more than an 87.3% share of the global nonylphenol market. This grade is widely utilized in large-scale manufacturing processes due to its chemical stability, cost-effectiveness, and compatibility with industrial formulations. Industrial-grade nonylphenol is primarily employed in producing nonylphenol ethoxylates, resins, lubricants, and surfactants that are essential for sectors such as oilfield chemicals, textiles, and plastics. The year 2024 witnessed sustained demand growth in these sectors, as industrial production in Asia-Pacific and North America rebounded post-supply chain recovery.
By 2025, industrial-grade demand is expected to remain steady, supported by its continued use in emulsifiers and coatings across manufacturing plants. The segment’s high share reflects its indispensable role in bulk chemical synthesis and formulation processes, where quality consistency and large-volume applications are critical. Moreover, industries prefer industrial-grade nonylphenol for its high purity levels and thermal stability, which ensure optimal performance in harsh processing conditions. The stable pricing trend in 2025 further supports its adoption across industrial and commercial formulations.
By Application Analysis
Emulsifiers lead the segment with 28.7% share owing to their broad industrial applications and stability performance
In 2024, Emulsifiers held a dominant market position, capturing more than a 28.7% share of the global nonylphenol market. The strong demand for emulsifiers was driven by their extensive use in formulations for paints, coatings, agrochemicals, and industrial cleaners. Nonylphenol-based emulsifiers are valued for their excellent dispersing and wetting properties, enabling uniform mixing of oil and water-based components in industrial processes. Their chemical stability and compatibility with a wide range of raw materials made them a preferred choice for manufacturing industries during 2024, particularly across Asia-Pacific and Europe.
In 2025, the emulsifier segment is expected to maintain steady growth, supported by expanding applications in metalworking fluids, polymerization processes, and textile auxiliaries. Industrial manufacturers continue to rely on nonylphenol-derived emulsifiers to enhance product consistency and improve surface interaction in coatings and adhesive formulations. The segment’s 28.7% share in 2024 reflects its critical contribution to end-use industries where reliable emulsion formation is essential for process efficiency.
By End-Use Analysis
Chemical sector dominates with 31.2% share driven by extensive use in industrial formulations and synthesis processes
In 2024, the Chemical sector held a dominant market position, capturing more than a 31.2% share of the global nonylphenol market. This dominance was attributed to the compound’s critical role as an intermediate in producing nonylphenol ethoxylates, resins, stabilizers, and antioxidants used across multiple chemical manufacturing processes. The chemical industry relies heavily on nonylphenol for synthesizing surfactants, lubricants, and polymer additives that enhance product performance and stability. The segment’s growth in 2024 was supported by increased industrial activity and rising demand for specialty chemicals in developing economies.
By 2025, the chemical end-user segment is projected to maintain its leading position, driven by the continued expansion of industrial production in Asia-Pacific and North America. Nonylphenol remains indispensable in many chemical formulations due to its versatility, high reactivity, and cost efficiency. The compound’s role in manufacturing stabilizers for plastics and as a precursor in coating materials continues to strengthen its demand base.
Key Market Segments
By Grade
- Reagent Grade
- Industrial Grade
By Application
- Antioxidant
- Emulsifiers
- Stabilizers
- Detergents
- Cleaning
- Dispersing Agent
- Others
By End-Use
- Chemical
- Building, and Construction
- Food And Beverages
- Automotive
- Pulp And Paper
- Agrochemicals
- Oil And Gas
- Others
Emerging Trends
Zero-APEO, proof-of-safety shift across food chains
A clear trend around nonylphenol (NP) is the move to “zero-APEO” (no NP/nonylphenol-ethoxylates) in products and processes that touch food—and the matching demand for proof. The food system is growing fast and is more regulated at trace levels, so buyers expect evidence that auxiliaries, wash waters, and textiles are free from NP. The scale explains why this matters: the UN Food and Agriculture Organization reports global fisheries and aquaculture output hit 223.2 million tonnes in 2022. That is a record, and it extends strict buyer requirements deep into seafood processing plants, food-service laundries, and packaging lines.
Within that total, aquaculture has taken the lead. In 2022, farmed aquatic animals surpassed wild catch for the first time, with ~94.4 million tonnes farmed versus ~91 million tonnes captured, marking a structural shift toward compliance-sensitive, standards-driven production. This tilt concentrates NP scrutiny in water-intensive facilities that must document low residues to safeguard export access.
Europe is locking in this trend by tightening end-of-pipe expectations. The revised Urban Wastewater Treatment Directive entered into force 1 January 2025, adding obligations for advanced (micropollutant) treatment. For industries that discharge to sewer—textile laundries serving caterers, seafood plants using nonwovens and wipes—this means monitoring and, where needed, polishing steps that specifically address micropollutants like NP.
At product level, the EU’s REACH update on nonylphenol ethoxylates prohibits placing textile articles on the market at ≥ 0.01% by weight if they can be washed, a rule in force for EU trade since 3 February 2021. Food-service linens, kitchen cloths, and nonwovens must therefore be APEO-free or demonstrate trace-level residues below this threshold. Brands now write these limits into purchase specs, and exporters audit upstream chemistry to avoid shipment holds.
Drivers
Regulatory Restriction in Textiles as a Driving Factor
One of the key driving factors for the changing industrial landscape of the chemical Nonylphenol (NP) is regulatory pressure—particularly the mandated restrictions on NP and its ethoxylates (NPEs) in textile and apparel applications. For example, under the Commission Regulation (EU) 2016/26 amending the REACH Regulation, textile articles that can reasonably be expected to be washed in water cannot contain NPEs at concentrations equal to or greater than 0.01% by weight from 3 February 2021.
This low threshold of 0.01% by weight essentially drives textile manufacturers and supply-chain chemical processors to eliminate NP / NPE usage in dyeing, finishing or surfactant operations in fabrics sold into the European Union.
For the food-industry adjacent sectors—such as packaging films, textile-backed food-service fabrics, wipes, and nonwoven applications—this regulation means that chemical suppliers cannot reliably offer NP-based auxiliaries without risking non-compliance. The requirement to stay under 0.01% effectively raises the cost of compliance, forces substitution or elimination of NP/NPE chemistries, and places pressure on upstream chemical vendors and formulation houses to develop alternative surfactants or finishing aids.
So, in human terms: imagine you’re a supplier of table linen for a food-service chain in Europe. Twenty years ago, you use a finishing aid containing NP because it’s cheap and effective. Now, the law says your finished articles can’t release NP above the 0.01% level when washed. You either redesign the chemistry, perform detailed residue testing, or face losing your supply contract. That change in model—from “use whatever works” to “must meet trace-level limit”—is one of the major forces redirecting NP usage and driving substitution, innovation and reformulation in chemicals, textiles, and by extension food-service and packaging sectors.
Restraints
Food-contact And Drinking-water Oversight Is the Brake
Tight controls on what can touch food and what can appear in drinking water now act as the strongest brake on nonylphenol (NP) use. In the European Union’s recast Drinking Water regime, the Commission formally placed NP on the watch list with a guidance value of 300 ng/L (0.3 µg/L)—a level that triggers investigation and risk-reduction steps if exceeded. This value was set in the 19 January 2022 Implementing Decision and reflects World Health Organization recommendations, making it a powerful, health-anchored constraint.
On the food side, EU law—underpinned by the European Food Safety Authority’s scientific work—enforces migration limits from packaging and processing equipment into food. A core benchmark is the Overall Migration Limit of 60 mg/kg of food (or 10 mg/dm²) for plastics, forcing converters to prove extremely low transfer of all constituents, including NIAS like NP, under intended use. This pushes suppliers to avoid NP-based systems in food-contact applications or invest in costly compliance testing.
U.S. oversight adds another layer. The U.S. Food and Drug Administration requires pre-market authorization via the food-contact notification pathway; without it, a substance cannot be used in contact with food. FDA points stakeholders to 21 CFR Parts 175–178, where permitted indirect additives and their conditions live—placing a clear, enforceable gate on NP uses unless safety is demonstrated for that specific contact scenario.
Real-world measurements also keep pressure high. Regional marine surveillance (OSPAR) has reported NP in biota, with <1–37 µg/kg (wet weight) in blue mussels and <1–44 µg/kg (wet weight) in fish liver, and 0.007–4.8 µg/L in marine and estuarine waters—evidence that NP residues persist and bioaccumulate. Such numbers reinforce why regulators and food-industry buyers ask for NP-free chemistries in nets, lines, nonwovens, wipes and food-service textiles that contact water and food environments.
Opportunity
Compliance-driven monitoring And removal around food chains
There’s a clear growth opening around measuring and removing nonylphenol (NP) across food-linked supply chains so exporters can keep market access. Seafood is a powerful example. The UN Food and Agriculture Organization (FAO) reports global fisheries and aquaculture output hit a record 223.2 million tonnes in 2022.
That scale—and its continued rise—means more seafood plants, laundries handling food-service textiles, and packaging operations that must document very low NP residues to sell into strict markets. Aquaculture has now overtaken wild catch: media summaries of FAO’s 2024 report note 94.4 million tonnes farmed vs. 91 million tonnes wild in 2022, underscoring a fast-growing, compliance-sensitive segment that buys cleaning chemistries, filtration, and lab services.
Food-contact rules compound this opportunity. In the EU, plastics that contact food must meet an Overall Migration Limit (OML) of 60 mg/kg food (or 10 mg/dm²), with specific migration limits set case-by-case. Even when NP is not intentionally added, labs must show that NIAS like degradation traces are controlled. That drives steady demand for NP screening, method validation, and supplier audits across converters making films, trays, and coated papers for seafood and broader food markets.
In the United States, the FDA Food Code 2022 steers how food-service operations clean and sanitize equipment and surfaces. Operators must use EPA-registered chemistries per label and demonstrate sanitization performance—pushing buyers toward tested formulations and third-party verification when they switch away from NP-related auxiliaries or when they need to prove low residues in wash water and on contact surfaces.
Regional Insights
Asia-Pacific leads the global Nonylphenol market with 42.9% share valued at USD 0.6 billion, supported by strong industrial expansion and chemical production growth
In 2024, the Asia-Pacific (APAC) region held a dominant position in the global nonylphenol market, accounting for 42.9% of total revenue, valued at approximately USD 0.6 billion. This dominance is primarily driven by rapid industrialization, expanding manufacturing infrastructure, and high consumption of surfactants, resins, and emulsifiers across industries such as textiles, plastics, and oilfield chemicals.
The region’s robust chemical production growth—recorded at around 5.2% annually according to industry and energy agency estimates—continues to strengthen demand for nonylphenol as a key raw material. India’s chemical sector, for instance, is projected to reach USD 300 billion by 2025, driving substantial demand for nonylphenol derivatives used in industrial and specialty chemical applications.
Key Regions and Countries Insights
- North America
- US
- Canada
- Europe
- Germany
- France
- The UK
- Spain
- Italy
- Rest of Europe
- Asia Pacific
- China
- Japan
- South Korea
- India
- Australia
- Rest of APAC
- Latin America
- Brazil
- Mexico
- Rest of Latin America
- Middle East & Africa
- GCC
- South Africa
- Rest of MEA
Key Players Analysis
Huntsman Corporation – Huntsman has long operated in the alkylphenols/phenolic intermediates space, including a “SURFONIC® N nonylphenol ethoxylate” series as early as 2006. The company is a global specialty-chemicals player with ~15,000 employees and 78 operations in 24 countries. In the NP space, Huntsman is positioned to supply intermediates and surfactant precursors, while also facing regulatory headwinds on NP/NPE usage and shifts toward non-APEO alternatives.
Solvay S.A. – Solvay has articulated clear product stewardship regarding NP/NPEs: for example, its hydrogen peroxide business certifies no nonylphenol ethoxylates are present in the product. While this suggests Solvay is reducing or eliminating NP/NPE linkages, it still retains broader chemical-intermediate operations that may touch alkylphenol derivatives. The company therefore occupies a transitional role: legacy supply-chain exposure to NP chemistry, but active positioning on regulatory compliance and alternative chemistries.
Dover Chemical Corporation – Dover Chemical lists para-nonylphenol (PNP) and di-nonylphenol (DNP) among its alkylphenol product lines, with a facility expansion in 1997 to serve global polymer and additive markets. The company is vertically integrated into polymer additives, rubber, plastics and surfactant precursors, giving it solid NP value-chain exposure. Its challenge lies in adapting product lines to regulatory constraints on NP/NPEs and declining downstream usage in some regions.
Top Key Players Outlook
- Huntsman
- Solvay S.A.
- Stepan Company
- SI Group
- Dover Chemical
- Eni
- Sasol
- PCC Group
- Sabic
- Daqing Zhonglan
Recent Industry Developments
In 2024, Solvay S.A. posted underlying net sales of €4,686 million and achieved an underlying EBITDA of €1,052 million with a margin of 22.5%.
In 2024, Stepan Company generated annual net sales of USD 2,180.3 million, representing a decline of 6.26% year-on-year.
Report Scope
Report Features Description Market Value (2024) USD 1.4 Bn Forecast Revenue (2034) USD 2.4 Bn CAGR (2025-2034) 5.6% Base Year for Estimation 2024 Historic Period 2020-2023 Forecast Period 2025-2034 Report Coverage Revenue Forecast, Market Dynamics, Competitive Landscape, Recent Developments Segments Covered By Grade (Reagent Grade, Industrial Grade), By Application (Antioxidant, Emulsifiers, Stabilizers, Detergents, Cleaning, Dispersing Agent, Others), By End-Use (Chemical, Building, and Construction, Food And Beverages, Automotive, Pulp And Paper, Agrochemicals, Oil And Gas, Others) Regional Analysis North America – US, Canada; Europe – Germany, France, The UK, Spain, Italy, Rest of Europe; Asia Pacific – China, Japan, South Korea, India, Australia, Singapore, Rest of APAC; Latin America – Brazil, Mexico, Rest of Latin America; Middle East & Africa – GCC, South Africa, Rest of MEA Competitive Landscape Huntsman, Solvay S.A., Stepan Company, SI Group, Dover Chemical, Eni, Sasol, PCC Group, Sabic, Daqing Zhonglan Customization Scope Customization for segments, region/country-level will be provided. Moreover, additional customization can be done based on the requirements. Purchase Options We have three licenses to opt for: Single User License, Multi-User License (Up to 5 Users), Corporate Use License (Unlimited User and Printable PDF) 
-
-
- Huntsman
- Solvay S.A.
- Stepan Company
- SI Group
- Dover Chemical
- Eni
- Sasol
- PCC Group
- Sabic
- Daqing Zhonglan
Our Clients
- 164041
- Nov 2025


